
Oil and chemical spills
This assessment uses numbers of spills above a set size threshold (above one tonne) as its basis and as a proxy for ‘significant’. Total reported spill incidents show an increasing trend over the assessment period, but most of them are small. Oil spills above one tonne have shown a decrease in terms of actual numbers and as a proportion of overall spills. The evidence presented in this assessment supports the conclusion that the target is currently being met for oil spills. However, of note is that during this period there is an increase in chemical related incidents from the Offshore oil and gas sector.
Background
The UK target for spills
Occurrence and extent of significant acute pollution effects (e.g., slicks resulting from spills of oil and oil products or spills of chemical) and their impact on biota affected by this pollution should be minimised through appropriate risk-based approaches.
Key Pressures and Impacts
The Key pressures resulting in spills from the shipping industry include increased marine traffic, larger vessel sizes and increased navigational pressures in key areas such as approaches to ports and harbours all of which are generally increased over the assessment period. The UK oil and gas industry is under unprecedented pressure to maintain productivity against a background of low oil prices and maturing oil fields. Therefore, a shift towards enhanced oil recovery, late life operations and decommissioning requires a general adaption of working practices. While these pressures provide a changing operational environment and new potential threats there is no clear evidence suggesting any subsequent impact on the occurrence of oil spills.
In the event of a major spill there a significant area may be affected potentially causing impacts on key ecological habitats, commercial fish and aquaculture practices and leisure/business use of the marine and coastal environment.
Measures taken to address the impacts
The shipping, port & harbours and offshore oil & gas industries are effectively managed in UK waters with implementation of key national and international regulations with a focus on safety and the minimisation of marine pollution. In the event of spills occurring the UK has a well-developed and exercised process of response set out in the UK National Contingency Plan most recently updated in August 2017. Understanding the environmental significance of spills is supported through the cross-government Premiam (Pollution Response in Emergencies: Marine Impact Assessment and Monitoring) initiative which has established post spill monitoring guidelines and procedures for initiating and coordinating monitoring and impact assessment surveys (www.cefas.co.uk/premiam).
Monitoring and assessment
The assessment scales were the Greater North Sea and the Celtic Seas. The assessment of status and trends are based on a dataset for numbers of spills in UK waters is collated annually by the Advisory Committee on the Protection of the Seas (ACOPS) on behalf of the Maritime and Coastguard Agency (MCA) using data collected from the Shipping, ports & harbours and offshore oil and gas industries. This provides a consistent and long-term dataset that enables good assessment of status and trends though cannot correct for changes in incident reporting practices. Further in-depth analysis of this dataset is conducted to investigate any significant spatial trends (currently based on spill volume data) in support of the UK Marine Strategy (UKMS) indicator.
No specific assessment thresholds are established for this indicator and the definition of ‘significant’ acute pollution in the context of spills is not available. For this assessment spill volume (e.g., spills > 1 tonne) is used as a proxy for significance. Trend analysis for this assessment has considered the number and proportion of spills above the 1 tonne threshold. Cooperation with other countries The UK government is fully engaged with European and international partners across a range of initiatives and groups relating to the prevention of oil spills including those presided over by OSPAR, IMO and EMSA.
Further information
The introduction of contaminants, including oil and chemicals, into the marine environment present a potential threat to marine resources and the associated biodiversity. Acute, short-term releases from accidental spills occur regularly in UK waters and therefore could, in sufficient volumes/numbers, contribute to an overall deterioration of Good Environmental Status (GES).
This assessment has focussed primarily on the reported spills of oil and oil-based products in UK waters and draws on information gathered from pollution report returns gathered by the UK Maritime and Coastguard Agency (MCA) and the UK Department for Energy Security and Net Zero (DESNZ) for spills originating from marine accidents (primarily shipping and ports) and the offshore oil & gas industry respectively. Spills of chemicals are also assessed, though these are primarily from the offshore sector. These data are checked and compiled into a standard format by the Advisory Committee on Protection of the Sea (ACOPS) on an annual basis (at the time of writing the data is only available up to 2017). The ACOPS datasets allow some analysis by spill position and volume. However, no assessment is made as to the environmental ‘significance’ of any given spill and, therefore, assessment and trend analysis is primarily limited to the numbers of reported incidents.
Assessment method
All the source spill data used as the basis of this assessment is derived from ACOPS reports following their own processes of collation and validation which they conduct under contract to the UK MCA. Much of this spill incident data is collected via a survey questionnaire issued by the MCA to relevant authorities including local coastal authorities, ports & harbours, and Environment Agency regional offices. In addition, questionnaire responses are supplemented with information from Petroleum Operation Notices (PON1’s) collated by DESNZ and Pollution Reports (POLREPs) provide by the MCA. ACOPS collates this information into a database, checking for any duplications, before generating a definitive spill dataset that is comparable across years. This ‘normalised’ dataset was further analysed to ascertain metrics relating to numbers of spills both regionally (i.e., in the Greater North Sea and Celtic Sea regions) and into size categories (less than 0.01 tonnes, between 0.01and 0.1 tonnes, between 0.1 and 1.0 tonnes, between 1 and 10 tonnes, between 10 and 100 tonnes, and more than 100 tonnes).
The UKMS target for acute spills refers to the assessment of ‘significant’ spills. However, no specific definition of significant is provided. A wide range of issues would contribute to whether any spill could be considered as ‘significant’ in terms of likely environmental impact, including volume, toxicity of spilled material, potential for dilution/dispersion at spill site, proximity of vulnerable marine resources (and their relative sensitivity), time of year and the effectiveness/availability of treatment options (e.g., chemical dispersion). A standardised process for taking account of these factors in the assessment of the significance levels of individual incidents is not available nor would it be practical for the purposes of this assessment. Therefore, the assessment is based on an evaluation of total numbers of spill incidents occurring annually with additional analysis of numbers of spills above certain size categories. Temporal trends are then assessed in terms of total reported spills (for oil and chemicals) and those above certain size thresholds and compared to previous data/assessments to provide a qualitative analysis in relation to UKMS targets.
Results
As no easily determined definition of ‘significant’ spills is available, analysis was conducted primarily based on numbers of reported incidents. The last published ACOPS report on chemical and oil spills in the UK exclusive economic zone (ACOPS 2017), provides the best indication of overall spill trends from 2000 to 2017 (Figure 1). Over that period the annual number of spills from vessels has remained similar between 100 to 200 incidents but during the same period spill incidents from offshore oil and gas installations has risen to between 500 and 600 annually. While this has resulted in a small overall upward trend in incident numbers the data are too variable to make strong statements for overall trends.
Oil Spills
A more detailed analysis has been conducted on the datasets provided from 2015 to 2017 (at the time of writing datasets for 2018 onwards are not available). Table 1 shows the frequency of recorded oil spill incidents from 2015 to 2017, sorted by the data source (e.g., offshore industry (DESNZ) and shipping/other (MCA)) and the size category (tonnes). Over this shorter period there is a general upward trend in overall incident reports, primarily driven from increased reports from the Oil & Gas sector. However, anecdotal evidence suggests this trend may be driven by improved and more stringent reporting practices in the sector (a positive development) rather than any real upward trend in spill numbers. The incidents from shipping appear more stable over this period.
The oil spill frequency data has also been analysed to ascertain the magnitude of incidents and trends relating to the two primary sea areas within the assessment, the Celtic Sea, and Greater North Sea. Table 2 shows the relative number of oil spills in each region from each sectoral source. As expected, given the primary locations of oil and gas activity and major shipping routes, most incidents from both sectors have taken place in the Greater North Sea (GNS). Over the analysed period oil spill reports in the GNS area account for 91%, 86% and 91% respectively for 2015, 2016 and 2017 (ACOPS 2015, ACOPS 2016, ACOPS 2017). The trend of incident numbers in each sea region over this short period reflects the overall trends for the whole dataset in that incidents numbers from the Oil and Gas sector have been rising and the shipping/ports trend is steady. Maps showing the spatial extent of the spills, including their size and source, are provided as Figures 2 , 3 and 4 for 2015, 2016 and 2017 respectively.
However, while raw incident numbers are a useful metric, they can also be affected by changes in reporting practices (these changes may have contributed to the upward trend in the oil and gas spill figures). The UKMS target refers to ‘the occurrence and extent of significant acute pollution events’ (e.g., reported oil spills for the purposes of this assessment). However, in the absence of a clear definition of ‘significant’ in this context this assessment uses spill volume as a proxy of significance whilst accepting that potential environmental impact (a preferred measure for significance) is dependent on a range of other factors that are not quantified here. Table 3 shows an analysis of the data from 2015 to 2017 showing the number and percentage of oil spills that were greater than 1 tonne. This analysis shows a generally downward trend over the three-year period relative to the last report for 2012 to 2014 with total spills above tonne being 12, 9 and 8 compared to 25, 18 and 14 for 2012, 13 and 14 respectively. The 2018 UKMS assessment stated that 6% of total reported spills were above two tonnes in 2010, by comparison only 2% of total spills were above 1 tonne in the 2017 data.
Chemical Spills
The data for chemical spills shows that these incidents are generally less frequent and much more skewed in terms of source and geographic area than for oil spills. Table 4 shows the total number of spills by size category and sector. The vast majority (97%) of chemical spills are reported from the offshore oil & gas industry and increased in 2016 and 2017 relative to 2015 (261 and 254 respectively compared to 213). Table 5 shows the data sorted by sea region showing that most chemical spills occur in the GNS area. Even when one analyses the data from a ‘significant’ spill (e.g., spills above 1 tonne) perspective there is no discernible trend with the proportion of chemical spills above 1 tonne running at 18%, 20% and 20% for years 2015, 2016 and 2017 respectively (Table 6). Of more significance in 2016 there were four shipping incidents involving spills above one tonne with three involving waxy solids (potentially paraffin or palm oil) and one involving rapeseed oil.
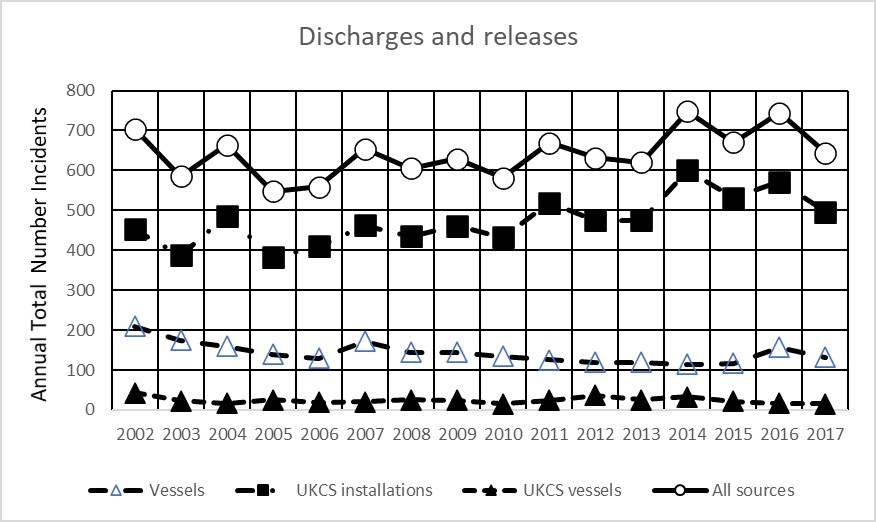
Figure 1 Annual totals for reported discharges and releases attributed to vessels and offshore oil and gas installations and support vessels 2000 – 2017.
Alternative text: Graph showing the change in the total number of discharge and release incidents between 2002 and 2017 depending on the type of vessel or installation and all sources combined.
Table 1. Numbers of reported oil spill incidents (not including chemical spills) from 2015-2017 sorted by source sector and size.
|
Source |
Size (tonnes) |
2015 |
2016 |
2017 |
|
Oil & Gas |
<0.01 |
248 |
268 |
267 |
|
|
0.01 - 0.1 |
66 |
57 |
56 |
|
|
0.1 - 1.0 |
42 |
33 |
33 |
|
|
1.0 - 10 |
7 |
6 |
6 |
|
|
10 - 100 |
2 |
0 |
0 |
|
|
>100 |
0 |
0 |
0 |
|
|
Unknown |
1 |
0 |
0 |
|
|
Source Total |
366 |
364 |
362 |
|
Shipping & Ports |
<0.01 |
57 |
29 |
35 |
|
|
0.01 - 0.1 |
31 |
38 |
27 |
|
|
0.1 - 1.0 |
10 |
15 |
11 |
|
|
1.0 - 10 |
1 |
2 |
2 |
|
|
10 - 100 |
2 |
1 |
0 |
|
|
>100 |
0 |
0 |
0 |
|
|
Unknown |
10 |
53 |
46 |
|
|
Source Total |
111 |
138 |
121 |
|
Oil spill Total |
|
477 |
502 |
483 |
Table 2. Numbers of reported oil spill incidents from 2015-2017 sorted by source sector and sea region
|
Area |
Source |
2015 |
2016 |
2017 |
|
Greater North Sea |
Oil & Gas |
347 |
336 |
326 |
|
|
Shipping/Ports |
39 |
59 |
83 |
|
|
Total |
386 |
321 |
366 |
|
Celtic Sea |
Oil & Gas |
19 |
28 |
35 |
|
|
Shipping/Ports |
70 |
79 |
38 |
|
|
Total |
89 |
107 |
73 |
|
Outside region |
|
2 |
0 |
1 |
|
Total |
|
477 |
502 |
483 |
Table 3. Analysis of reported oil spill incident data (2015-2017) to show the percentage of spills over 1 tonne as a proxy for ‘significant’ spills.
|
Source |
Size category |
2015 |
2016 |
2017 |
|
Oil & Gas |
Greater than 1 tonne |
9 |
6 |
6 |
|
|
Sector Total |
366 |
364 |
362 |
|
|
% greater than 1 tonne |
2.5 |
1.6 |
1.7 |
|
Shipping & Ports |
Greater than 1 tonne |
3 |
3 |
2 |
|
|
Sector Total |
111 |
138 |
121 |
|
|
% greater than 1 tonne |
2.7 |
2.2 |
1.7 |
|
|
|
|
|
|
|
Total greater than 1 tonne |
|
12 |
9 |
8 |
|
Total |
|
477 |
502 |
483 |
|
% Total |
|
2.5 |
1.8 |
1.7 |
Table 4. Numbers of reported chemical spill incidents from 2015-2017 sorted by source sector and size.
|
Source |
Size (tonnes) |
2015 |
2016 |
2017 |
|
Oil & Gas |
<0.01 |
51 |
76 |
76 |
|
|
0.01 - 0.1 |
58 |
54 |
55 |
|
|
0.1 - 1.0 |
59 |
64 |
64 |
|
|
1.0 - 10 |
27 |
37 |
37 |
|
|
10 - 100 |
10 |
10 |
10 |
|
|
>100 |
0 |
1 |
1 |
|
|
Unknown |
1 |
0 |
0 |
|
|
Sector Total |
206 |
242 |
243 |
|
Shipping & Ports |
<0.01 |
|
3 |
1 |
|
|
0.01 - 0.1 |
5 |
4 |
4 |
|
|
0.1 - 1.0 |
0 |
5 |
1 |
|
|
1.0 - 10 |
0 |
4 |
0 |
|
|
10-100 |
0 |
0 |
|
|
|
Unknown |
2 |
3 |
5 |
|
|
Sector Total |
7 |
19 |
11 |
|
Total Chemical |
|
213 |
261 |
254 |
Table 6. Analysis of reported chemical spill incident data (2015-2017) to show the percentage of spills over 1 tonne as a proxy for ‘significant’ spills.
|
Source |
Size category |
2015 |
2016 |
2017 |
|
Oil & Gas |
Greater than 1 tonne |
37 |
48 |
48 |
|
|
Sector Total |
206 |
242 |
243 |
|
|
% greater than 1 tonne |
18 |
20 |
20 |
|
Shipping & Ports |
Greater than 1 tonne |
0 |
4 |
0 |
|
|
Sector Total |
7 |
19 |
11 |
|
|
% greater than 1 tonne |
0 |
21 |
0 |
|
|
|
|
|
|
|
Total greater than 1 tonne |
|
37 |
52 |
48 |
|
Total |
|
213 |
261 |
254 |
|
% Total |
|
17 |
20 |
19 |

Figure 2. Map showing spatial extent, size, and source for reported oil spills in 2015.
Alternative text: Map showing spatial extent, size, and source for reported oil spills in 2015 for the UK.

Figure 3. Map showing spatial extent, size, and source for reported oil spills in 2016.
Alternative text: Map showing spatial extent, size, and source for reported oil spills in 2016 for the UK.

Figure 4. Map showing spatial extent, size, and source for reported oil spills in 2017.
Alternative text: Map showing spatial extent, size, and source for reported oil spills in 2017 for the UK.

Figure 5. Map showing spatial extent, size, and source for reported chemical spills in 2015.
Alternative text: Map showing spatial extent, size, and source for reported chemical spills in 2015 for the UK.

Figure 6. Map showing spatial extent, size, and source for reported chemical spills in 2016.
Alternative text: Map showing spatial extent, size, and source for reported chemical spills in 2016 for the UK.

Figure 7. Map showing spatial extent, size, and source for reported chemical spills in 2017.
Alternative text: Map showing spatial extent, size, and source for reported chemical spills in 2017 for the UK.
Conclusions
Since the UK initial assessment of the of spills in 2012 there has been a continuing upward trend in the number of reported oil spills from the oil & gas sector and this has contributed to a slight upward increase in the overall total spills recorded. However, this may be, in part, due to changes in reporting behaviour which may be introducing uncertainty into any temporal trend analysis. The increased number is primarily attributed to greater frequency of reporting for small incidents (less than 0.1 tonne). Total incidents from the shipping/ports sector are generally stable.
A clearer indication is the numbers of ‘significant’ oil spill incidents for which spill volume is used as a proxy for potential environmental impact. Using an arbitrary threshold (above 1 tonne) for larger spills the trend since the last assessment is generally decreasing. Considering the number of spills (above one tonne) as a percentage of the total recorded spills there is a downwards shift from 7.2% in 2012 to 2.9% in 2014 which continues into 2015 (2.5%) to 2017(1.7%).
There is an upward trend in the chemical spill data over the reported period with 213 in 2015 and 261 and 254 in 2016 and 2017 respectively. This trend is mirrored in the number of incidents of less than one tonne, and which could be considered potentially ‘significant’ with 37,52 and 48 in 2015, 2016 and 2017. The percentage of chemical spills above one tonne over the reported period was 17-20% compared to 1.7-2.5% for the reported oil spills.
Considering the oil and chemical spill data together, the overall number of reported spills increase between 2015, 2016 and 2017 at 690, 763 and 737 respectively. However, the overall number of spills above one tonne as a percentage of the total number was like that for the period 2012, 2013 and 2014 (11.5%, 10.7% and 6.7%) with 7.1, 8.0 and 7.6% for 2015, 2016 and 2017 respectively. Of interest in this latter period is that the chemical incident figures for the oil and gas sector have the dominant influence.
The 2018 assessment stated that in 2010 only 6% of oil spills above 2 tonnes. For the period from 2015 to 2017 the percentage of oil spills above one tonne is 1.7-2.5% indicating an overall decreasing trend. The UKMS target indicates that the occurrence and extent of acute spill events should be minimised through risk-based approaches. The evidence presented in this assessment supports the conclusion that the target is currently being met for oil spills. However, there is some evidence of increasing proportion of chemical spills from the Oil and Gas industry during the period 2015 to 2017.
Knowledge gaps
-
This analysis uses third party reporting of incidents as the key data source and the UKMS assessment is not the primary driver for that process. As a result, there is little control over reporting practices, and this can have a significant effect on temporal inter-comparability for trend analysis. Understanding reporting practices, and how they influence and promote standardisation would be beneficial for future assessments.
-
The use of spill volume as a proxy for environmental ‘significance’ is a blunt tool. Numerous other factors, such as proximity to sensitive/valuable resource, the type of oil/chemical spilled and seasonality, are potentially of greater importance. To avoid future misinterpretation of this indicator consideration should be given to the development of a more robust assessment of ‘significant’ spills in this context.
References
ACOPS. 2015. Annual Survey of reported discharges and releases attributed to vessels and offshore oil and gas installations operating in the United Kingdom’s exclusive economic zone (UK EEZ). UNC0015 https://www.acops.org.uk/wp-content/uploads/2019/05/ACOPS-Annual-Pollution-Survey-2015.pdf
ACOPS. 2016. Annual Survey of reported discharges and releases attributed to vessels and offshore oil and gas installations operating in the United Kingdom’s exclusive economic zone (UK EEZ). UNC0016 https://www.acops.org.uk/wp-content/uploads/2019/07/ACOPS-Annual-Survey-2016.pdf
ACOPS. 2017. Annual Survey of reported discharges and releases attributed to vessels and offshore oil and gas installations operating in the United Kingdom’s exclusive economic zone (UK EEZ). UNC0017
Authors
Mark Kirby1
1 Centre for the Environment, Fisheries and Aquaculture Science
Citation:
Mark Kirby (2024). Oil and chemical spills indicator assessment for the UK Marine Strategy. In: UK Marine Online Assessment Tool, available at: https://moat.cefas.co.uk/pressures-from-human-activities/contaminants/oil-spills/
Assessment metadata
| Assessment Type | UK marine strategy |
|---|---|
Descriptor 8 | |
| Point of contact email | marinestrategy@defra.gov.uk |
| Metadata date | Wednesday, January 1, 2025 |
| Title | Oil and chemical spills |
| Resource abstract | |
| Linkage | |
| Conditions applying to access and use | © Crown copyright, licenced under the Open Government Licence (OGL). |
| Assessment Lineage | |
| Dataset metadata | Please, see data sets published in ACOPs reports 2017, 2016, 2015: |
| Dataset DOI | Please, see information on data sets published in ACOPS reports (Annual Survey of reported discharges and releases attributed to vessels and offshore oil and gas installations operating in the United Kingdom’s exclusive economic zone). ACOPS 2017. UNC0017 https://www.acops.org.uk/wp-content/uploads/2020/08/ACOPS_Ann-Rep-2017-final.pdf ACOPS 2016. UNC0016 https://www.acops.org.uk/wp-content/uploads/2019/07/ACOPS-Annual-Survey-2016.pdf ACOPS 2015. UNC0015 https://www.acops.org.uk/wp-content/uploads/2019/05/ACOPS-Annual-Pollution-Survey-2015.pdf |
The Metadata are “data about the content, quality, condition, and other characteristics of data” (FGDC Content Standard for Digital Geospatial Metadata Workbook, Ver 2.0, May 1, 2000).
Metadata definitions
Assessment Lineage - description of data sets and method used to obtain the results of the assessment
Dataset – The datasets included in the assessment should be accessible, and reflect the exact copies or versions of the data used in the assessment. This means that if extracts from existing data were modified, filtered, or otherwise altered, then the modified data should be separately accessible, and described by metadata (acknowledging the originators of the raw data).
Dataset metadata – information on the data sources and characteristics of data sets used in the assessment (MEDIN and INSPIRE compliance).
Digital Object Identifier (DOI) – a persistent identifier to provide a link to a dataset (or other resource) on digital networks. Please note that persistent identifiers can be created/minted, even if a dataset is not directly available online.
Indicator assessment metadata – data and information about the content, quality, condition, and other characteristics of an indicator assessment.
MEDIN discovery metadata - a list of standardized information that accompanies a marine dataset and allows other people to find out what the dataset contains, where it was collected and how they can get hold of it.