
Trends and status of liver neoplasms in flatfish
Three regions exhibited an ‘elevated’ or ‘significant’ response, although most regions exhibited a ‘background response’ including Eastern Channel, Minches and Western Scotland, Scottish Continental Shelf, and Western Channel and Celtic Sea in the assessment period (2011-2020). Overall, there has been a small 0.04 % increase in liver neoplasms across UK biogeographic regions when taken as a whole, although this was statistically insignificant.
Background
UK Target on liver neoplasms in flatfish
Liver neoplasms are benign or malignant tumours and have been the subject of numerous investigations into hazardous substances and their biological effects. This indicator is used to supplement the target covering the biological effects of contaminants set out in the Marine Strategy Part 1 which requires that for biological effects “the intensity of those biological or ecological effects due to contaminants agreed by OSPAR as appropriate for UK Marine Strategy (UKMS) purposes are below the toxicologically based standards”. This indicator provides valuable information on the cause-effect relationship between environmental contaminants and the presence of neoplastic liver lesions in fish and has therefore been included in the assessment of GES for Descriptor 8 of the UKMS.
Key pressures and Impacts
The key pressure associated with high incidences of liver neoplasms in wild fish populations is chronic long-term exposure to anthropogenic contaminants including the organohalogens and metals. Fish age has an influence on the formation of liver neoplasms; however, this assessment tool normalises for these factors, which is critical to investigate environmental contaminants and this top-level indicator of contaminant exposure.
Measures taken to address the impacts
There is a robust UK legislative framework in place for controlling pollution from the main sources of contaminants (energy production, transport, urban and industrial uses, including appropriate consenting and WFD River Basin Management Plans described in the Marine Strategy Part 3. However, many genotoxic chemicals entered the sea before many of the controls were put in place and, due to their persistence, are still present.
Further information
Fish disease monitoring has historically contributed to the OSPAR Coordinated Environmental Monitoring Programme (CEMP) of the Joint Assessment Monitoring Programme (JAMP). This has been carried out in the UK under national monitoring activities since the 1980s as part of the National Marine Monitoring Programme (NMMP) and subsequently CSEMP (Clean Seas Environmental Monitoring Programme). The CSEMP monitors spatial and temporal trends of externally visible infectious diseases (including parasitic, bacterial and viral conditions) and toxicopathic pathological conditions (including reproductive disorders i.e. intersex; and liver neoplasms). Monitoring of these diseases has been quality assured under the Biological Effects Quality Assurance in Marine Monitoring (BEQUALM) Programme since 2004. All UK data is submitted to the UK Marine Environment Monitoring and Assessment National (MERMAN) database and the International Council for the Exploration of the Seas (ICES) International Databank.
Histopathology has previously been used to investigate the cause-effect relationship between environmental contaminants and the presence of toxicopathic liver lesions in numerous fish species (Stein and others, 1990; Myers and others, 1994; Stentiford and others, 2003; Stehr and others, 2004; Lang and others, 2017). Bottom-dwelling fish, particularly flatfish (Figure 1) , are sensitive biomonitoring species resulting from their sedimentary habitat and a diet primarily consisting of benthic organisms. As such, in polluted environments they have a higher chance of being exposed to potentially harmful sediment-associated environmental contaminants. The liver is the major organ responsible for the absorption, metabolism and storage of nutrients. It is the primary barrier between the digestive system and the blood, therefore playing an important role in the detoxification of toxins, hazardous substances and their metabolites. Liver cells (hepatocytes) can store large quantities of glycogen or lipid (influenced by species, sex, maturity, physiological condition and temperature) resulting in differential sensitivity to hazardous lipophilic substances (Hinton and others, 2001). These substances can directly impact upon liver structure and function causing acute hepatocellular toxic injury and cell death following intracellular metabolism of parent compounds into highly reactive molecules. These molecules readily combine with proteins, DNA and RNA, impairing routine biological functions. They can also impart their effects indirectly by disrupting interactions and signalling between cells. The continued long-term assault of the liver by these mechanisms can result in the formation of chronic toxic liver injury e.g. neoplasia (carcinogenesis) (Figure 2 and Figure 3) (Hinton and Couch, 1998; Hinton and others, 2008). For these reasons, the liver is a key target organ for investigating the toxic effects of contaminants in the aquatic environment.

Figure 1. The common dab (Limanda limanda) is the primary bioindicator species for coastal and offshore fish disease monitoring in the UK.

Figure 2. Large cancerous neoplasm (*) on the liver from a dab sampled from the Greater North Sea.

Figure 3. Histology of neoplasmic lesion used to confirm the diagnosis of externally visible neoplastic lesions (as shown in Figure 2). This provides increased sensitivity for the detection of lesions (see arrow) that are not ordinarily visible to the naked eye.
Liver neoplasms are benign or malignant tumours and have been the subject of numerous studies investigating hazardous substances and their biological effects. Laboratory and mesocosm studies have successfully induced neoplastic lesions within fish livers following exposure to contaminants (Hawkins and others, 1990; Vethaak and others, 1996) and previous field studies have observed correlations between anthropogenic contaminants and neoplastic liver lesions. Several studies undertaken in North America provide strong evidence that polycyclic aromatic hydrocarbons (PAHs) and persistent organic pollutants (POPs), including polychlorinated biphenyls (PCBs) and organochloride pesticides, result in the formation of abnormal liver conditions including neoplastic lesions in several fish species (Myers and others, 1990; Myers and others, 1998; Stehr and others, 2004). Polybrominated diphenyl ethers (PBDEs) are structurally similar to PCBs, persistent and may also be implicated in the formation of liver neoplasms in fish. European field studies have since identified similar toxicopathic, pre-neoplastic and neoplastic lesions in the European flounder (Platichthys flesus) and common dab (Limanda limanda) (Figure 1) that are considered the primary bioindicator species in the OSPAR North-east Atlantic region (Köhler, 1990; Lang and others, 2006; Vethaak and others, 2009; Stentiford and others, 2010). Furthermore, the monitoring of liver neoplasms has been used successfully to demonstrate site recovery with regards to the biological effects of contaminants (Baumann and Harshbarger, 1995; Myers and others 2008) saw reductions in the prevalence of liver neoplasms.
The assessment of liver neoplasms requires a careful approach, not least due to the corresponding influence of fish age on their prevalence (Myers and others, 1994; Vethaak and others, 2009; Stentiford and others, 2010). Like other species, including humans, age is positively correlated (although not exclusively) to the formation of cancer and is a therefore a potentially confounding factor for the interpretation of liver neoplasms in fish, (Myers and others, 1994; Vethaak and others, 2009; Stentiford and others, 2010). Whether this influence in fish is simply the result of increasing age or the continued long-term chronic exposure to contaminants over time, is difficult to determine. Nevertheless, it is crucial to determine the age of individual fish sampled if true like-for-like spatial and temporal comparisons are to be made. Previous comparisons of age-matched fish cohorts have revealed that whilst incidences of liver neoplasms increase with age, the age of onset is accelerated at those locations that also exhibit a high prevalence of liver neoplasms (Stentiford and others, 2010). The method used in this assessment was developed to address confounding age-related effects and was previously used in the 2018 assessment using data obtained between 2004 and 2015. However, the data obtained from Scottish coastal waters during that assessment period was unable to be incorporated into the assessment model resulting from species differences between 2004 and 2010. This current assessment supersedes the 2018 assessment and includes all UK data obtained between 2011 and 2020.
Assessment method
Field sample collection and analysis
Dab were collected from 47 CSEMP fishing stations within UK coastal and offshore waters between 2011 and 2020. There were differences concerning the number and size of fish sampled between years and sites resulting from (a) the availability of fish during fishing activities, and (b) differences in sampling strategies between England and Wales (E&W) and Scotland i.e. annual (Scotland) vs biennial (E&W). For clarity, a sampling matrix is provided in Table 1.
Table 1: This sampling matrix shows the fishing stations and UK biogeographic regions sampled between 2011-20 in E&W and Scotland. The E&W CSEMP adopts a biennial sampling of Greater North Seas and Celtic Seas. The Scottish CSEMP utilises a site-specific risk-based approach informed by hazardous chemical assessments, with locations visited annually to once every six years.
|
COUNTRY |
FISHING STATION |
UK BIOGEOGRAPHIC REGION |
2011 |
2012 |
2013 |
2014 |
2015 |
2016 |
2017 |
2018 |
2019 |
2020 |
|
E&W |
Burbo Bight |
Irish Sea |
|
X |
|
X |
|
X |
|
X |
|
X |
|
E&W |
Inner Cardigan Bay |
Irish Sea |
|
|
|
|
|
|
|
|
|
|
|
E&W |
Liverpool Bay |
Irish Sea |
|
X |
|
X |
|
X |
|
X |
|
X |
|
E&W |
Morecambe Bay |
Irish Sea |
|
X |
|
X |
|
X |
|
X |
|
|
|
E&W |
North Cardigan Bay |
Irish Sea |
|
X |
|
X |
|
X |
|
X |
|
|
|
E&W |
Red Wharf Bay |
Irish Sea |
|
X |
|
X |
|
X |
|
X |
|
|
|
E&W |
St Bees Head |
Irish Sea |
|
X |
|
X |
|
X |
|
X |
|
X |
|
E&W |
South Cardigan Bay |
Irish Sea |
|
X |
|
X |
|
X |
|
X |
|
X |
|
E&W |
Southeast Isle of Man |
Irish Sea |
|
X |
|
X |
|
|
|
X |
|
|
|
E&W |
Central Dogger |
Southern North Sea |
X |
|
X |
|
X |
|
X |
|
X |
|
|
E&W |
Indefatigable Bank |
Southern North Sea |
X |
|
X |
|
X |
|
X |
|
X |
|
|
E&W |
North Dogger |
Southern North Sea |
X |
|
X |
|
X |
|
X |
|
X |
|
|
E&W |
Northeast Dogger |
Southern North Sea |
X |
|
X |
|
|
|
X |
|
X |
|
|
E&W |
Off Humber |
Southern North Sea |
X |
|
X |
|
X |
|
X |
|
X |
|
|
E&W |
Outer Humber |
Southern North Sea |
|
|
X |
|
|
|
X |
|
X |
|
|
E&W |
Outer Gabbard |
Southern North Sea |
|
|
|
|
|
|
X |
|
X |
|
|
E&W |
Smith’s Knoll |
Southern North Sea |
X |
|
X |
|
|
|
X |
|
X |
|
|
E&W |
West Dogger |
Southern North Sea |
X |
|
X |
|
X |
|
X |
|
X |
|
|
E&W |
Amble |
Northern North Sea |
X |
|
X |
|
X |
|
X |
|
X |
|
|
E&W |
Farne Deeps |
Northern North Sea |
X |
|
X |
|
X |
|
X |
|
|
|
|
E&W |
Off Flamborough |
Northern North Sea |
X |
|
X |
|
X |
|
X |
|
X |
|
|
E&W |
Tees Bay |
Northern North Sea |
X |
|
X |
|
X |
|
X |
|
X |
|
|
E&W |
Carmarthen Bay |
W. Channel & Celtic Sea |
|
X |
|
X |
|
X |
|
X |
|
X |
|
E&W |
Celtic Deep |
W. Channel & Celtic Sea |
|
|
|
X |
|
|
|
|
|
|
|
E&W |
West Lundy |
W. Channel & Celtic Sea |
|
X |
|
|
|
X |
|
X |
|
X |
|
E&W |
South Eddystone |
W. Channel & Celtic Sea |
|
X |
|
X |
|
X |
|
X |
|
X |
|
E&W |
Newhaven |
E. Channel |
X |
|
X |
|
X |
|
X |
|
X |
|
|
E&W |
Rye Bay |
E. Channel |
X |
|
X |
|
X |
|
X |
|
X |
|
|
E&W |
Inner Lyme Bay |
E. Channel |
|
|
|
|
|
|
|
X |
|
|
|
Scotland |
Holy Loch |
Irish Sea |
X |
X |
|
|
X |
X |
|
X |
X |
X |
|
Scotland |
Pladda |
Irish Sea |
|
|
|
|
|
|
X |
|
|
|
|
Scotland |
NMMP25 |
Irish Sea |
X |
|
|
|
X |
X |
|
X |
|
X |
|
Scotland |
St Andrews Bay |
Northern North Sea |
|
|
|
|
|
|
|
|
X |
|
|
Scotland |
NMMP165 |
Northern North Sea |
X |
X |
X |
X |
X |
X |
X |
X |
X |
X |
|
Scotland |
Balta Shetland |
Northern North Sea |
X |
X |
|
|
|
|
|
|
X |
|
|
Scotland |
Fair Isle |
Northern North Sea |
|
|
|
|
|
|
|
X |
|
|
|
Scotland |
Kingston Hudds |
Northern North Sea |
|
|
|
|
|
|
X |
X |
|
X |
|
Scotland |
Outer Forth |
Northern North Sea |
|
|
|
|
X |
|
X |
|
X |
X |
|
Scotland |
Long Forties |
Northern North Sea |
|
|
|
|
X |
|
|
|
|
|
|
Scotland |
NMMP105 |
Northern North Sea |
X |
|
X |
X |
|
|
X |
|
|
X |
|
Scotland |
NMMP95 |
Northern North Sea |
|
|
X |
|
|
X |
|
|
X |
|
|
Scotland |
North Coll |
Minches & Western Scotland |
|
|
|
|
|
|
|
|
|
|
|
Scotland |
Colonsay |
Minches & Western Scotland |
|
|
|
|
|
|
|
X |
|
X |
|
Scotland |
NMMP85 |
Minches & Western Scotland |
X |
|
|
|
|
|
|
X |
|
|
|
Scotland |
Gallen Head |
Scottish Continental Shelf |
|
|
|
X |
|
|
|
|
X |
|
|
Scotland |
West Orkney |
Scottish Continental Shelf |
|
|
|
|
|
|
|
|
|
|
|
Scotland |
Burra Haaf |
Scottish Continental Shelf |
|
|
|
X |
|
|
|
|
|
|
Fish livers were processed for histological analysis using laboratory guidelines described by Feist and others (2004). All fish were analysed for neoplastic lesions using diagnostic criteria agreed under the BEQUALM Fish Disease Measurement programme. Individual fish were given a non-accumulative score of 1, if at least one neoplastic lesion was detected (e.g. the presence of two individual lesion types would result in a score of 1). Age determination of corresponding fish was carried out using otolith analysis (Easey and Milner, 2004) and used to determine the prevalence of liver neoplasms for each age class.
Statistical analysis
The analysis assessed the prevalence of liver neoplasms from samples collected between 2011 and 2020. The data were split into two assessment periods comprised of ‘Assessment 1’ (2011-2015) and ‘Assessment 2’ (2016-2020). The prevalence of liver neoplasms was compared between the following UK biogeographic areas: (1) Northern North Sea, (2) Southern North Sea, (3) Eastern Channel, (4) Western Channel and Celtic Sea, (5) Irish Sea, (6) Minches and Western Scotland, (7) Scottish Continental Shelf, and (8) Atlantic Northwest Approaches.
Data were pre-selected for fish aged between 3 to 6 years that correspond to the interquartile range (Table 2), due to relatively low sample sizes of young and old fish. This approach allowed the assessment to avoid extreme bias particularly because older age classes of fish exhibit a higher prevalence of cancer due to their relatively limited availability during sampling. This approach also allowed the comparison of independent population cohorts of fish between the two assessment periods, facilitated by the interquartile range of four years being shorter than the five-year assessment periods.
Table 2: Summary of key statistics showing the age distribution of dab sampled between assessment periods.
|
|
MIN |
1ST QUARTILE |
MEDIAN |
MEAN |
3RD QUARTILE |
MAX |
|
2011-2015 |
1 |
3 |
4 |
4.37 |
6 |
13 |
|
2016-2020 |
1 |
3 |
5 |
4.73 |
6 |
12 |
A binomial generalised linear mixed model (GLMM) was used to compare differences in liver neoplasm prevalence between the two assessment periods, and the eight UK biogeographic marine areas including: (1) Northern North Sea, (2) Southern North Sea, (3) Eastern Channel, (4) Western Channel and Celtic Sea, (5) Irish Sea, (6) Minches and Western Scotland, (7) Scottish Continental Shelf, and (8) Atlantic Northwest Approaches. Fish sex was incorporated into the GLMM as a random effect to account for differences in the ratio of male and female fish sampled between sites, regions, and years. Age was also incorporated into the model as a random effect to account for differences in the number of fish within each age classes. Statistical analysis from the mixed effects logistic regression was followed by pairwise comparisons to determine spatial and temporal differences, including their statistical significance.
Results
Assessment of liver neoplasms by UK biogeographic region
There was a significant variation in the prevalence of liver neoplasms between individual UK biogeographic regions (Figure 5, Table 6). Statistical analysis of individual UK biogeographic regions revealed a statistically significant decrease (p=<0.001) in liver neoplasm prevalence in the Irish Sea (7.80 → 5.60 %), and the Western Channel and Celtic Sea regions (3.07 → 1.64 %), between the two assessment periods. A prevalence decrease was also observed in the Eastern Channel (3.20 → 2.01 %), and the Minches and Western Scotland (4.55 → 0.75 %) regions, although these were not statistically significant (p=0.365 and 0.205, respectively). Increases in the prevalence of liver neoplasms between the two assessment periods were observed in the Southern North Sea (6.03 → 7.91 %), Northern North Sea (2.58 → 4.18 %), and Scottish Continental Shelf (1.09 → 2.27 %), although these results were not statistically significant (p=0.085, 0.080 and 0.736, respectively). Taken together, there was a small increase (on average) in the prevalence of liver neoplasms collectively across all UK biogeographic regions (4.96 → 5.00 %) between the two assessment periods, although this was not statistically significant.
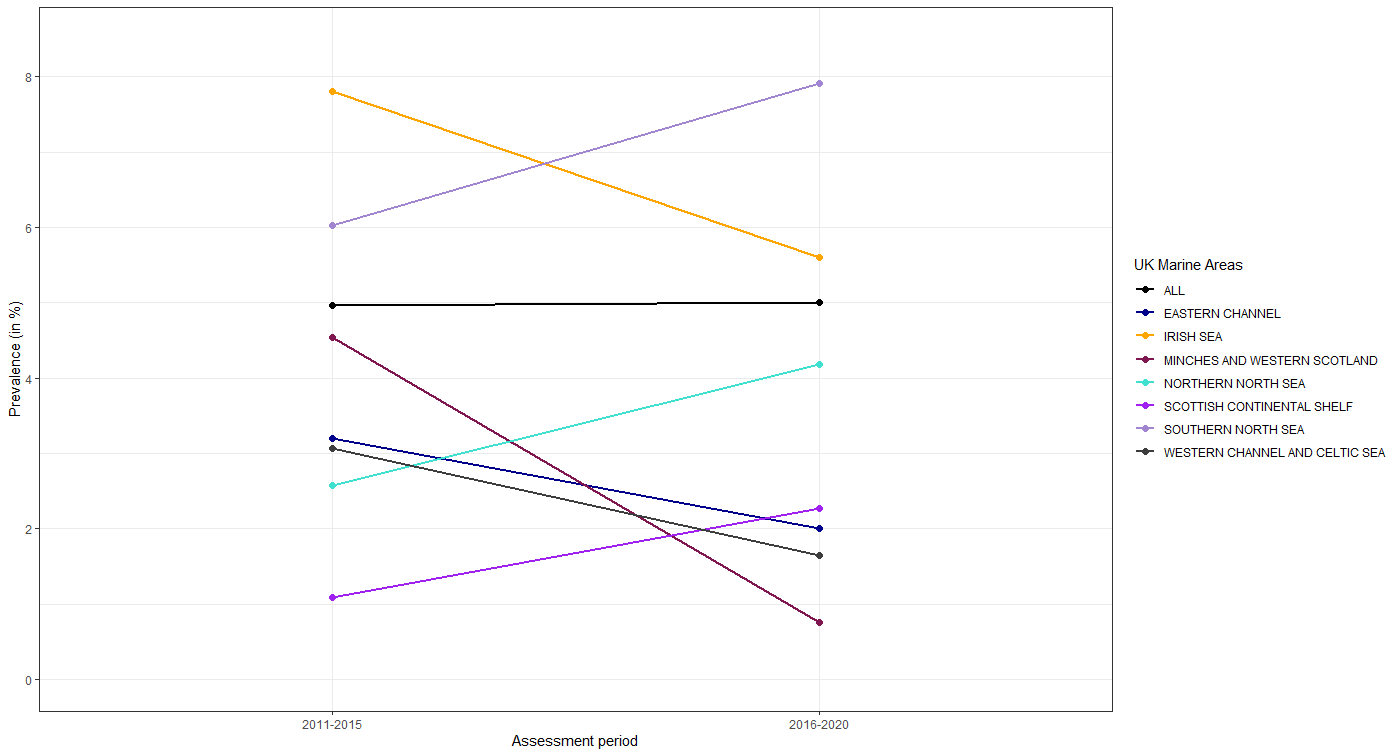
Figure 5: Liver neoplasm prevalence in dab sampled during the assessment periods of 2011-15 and 2016-2020 across UK biogeographic regions for interquartile range fish aged 3-6 years old.
Table 6: The percentage prevalence and assessment status of liver neoplasms in UK biogeographic regions during the two assessment periods of 2011-15 and 2016-2020. Arrows denote direction of trend when 2016-2020 period compared to 2011-2015 (upward arrow indicates increasing trend; downward arrow decreasing trend; a diagonal arrow indicates a significant respective trend).
|
UK BIOGEOGRAPHIC REGION |
2011-2015 (%) |
2016-2020 (%) |
|
EASTERN CHANNEL |
3.21 |
2.01↓ |
|
IRISH SEA |
7.80 |
5.60↘ |
|
MINCHES AND WESTERN SCOTLAND |
4.55 |
0.75↘ |
|
NORTHERN NORTH SEA |
2.58 |
4.18↑ |
|
SCOTTISH CONTINENTAL SHELF |
1.09 |
2.27↑ |
|
SOUTHERN NORTH SEA |
6.03 |
7.91↑ |
|
WESTERN CHANNEL AND CELTIC SEA |
3.07 |
1.64↓ |
|
ALL REGIONS |
4.96 |
5.00↓ |
The status of liver neoplasm in common dab for each biogeographic region is mapped in Figure 6 for 2011-2015 assessment period, and in Figure 7 for the 2016-2020 assessment period.

Figure 6: The status of liver neoplasms in common dab in each biogeographic region during the 2011-15 assessment period. Light blue: background response. Dark blue: elevated response. Red: significant response. The black dots are the monitoring sites.

Figure 7: The status of liver neoplasms in common dab in each biogeographic region during the 2016-20 assessment period. Light blue: background response. Dark blue: elevated response. Red: significant response. The black dots are the monitoring sites.
Further information
Preliminary statistical analysis
The total number of fish within each age class that were diagnosed with and without neoplastic liver lesions between 2011 and 2020 is shown in Figure 4. The data show that fish aged 1-2 years exhibited low incidences of liver neoplasms. Furthermore, old fish were not available in sufficient numbers and therefore showed increased liver neoplasm prevalence, when present, within the older age classes. This increased prevalence in small numbers of old fish resulted in substantial leverage on the data. Further analysis of our data showed that the interquartile range consisted of 3 to 6-year-old fish (Table 3).
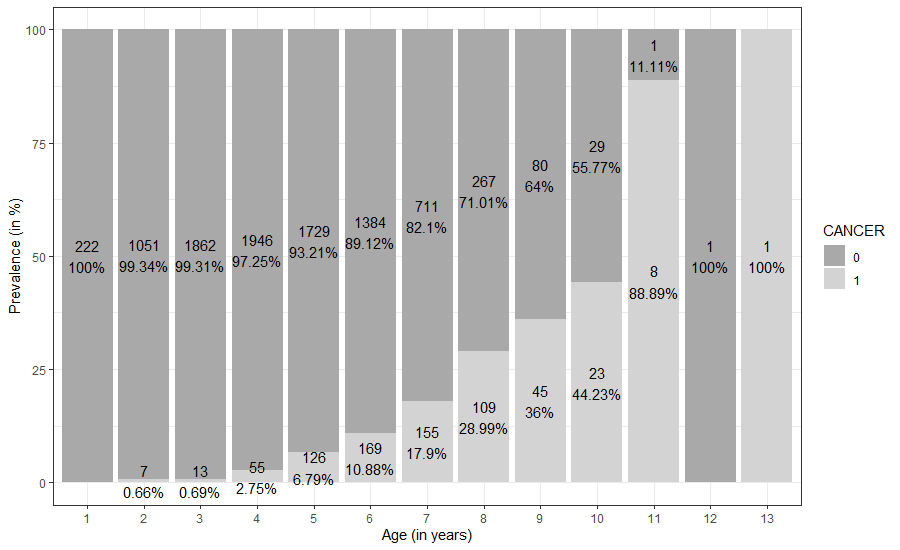
Figure 4: The prevalence of liver neoplasms in dab per age class across all UK biogeographic regions between 2011 and 2020. Data show the number of fish sampled within each age class and the percentage of fish (in %) with a positive (1) or negative (0) diagnosis of neoplastic liver lesion.
Based on this analysis, we concluded that the final indicator assessment should only incorporate 3 to 6-year-old fish, thus avoiding age bias and maintaining statistical rigour. The number of interquartile range fish sampled each year from individual UK biogeographic regions is reported in Table 3.
Table 3: The total number of interquartile range dab sampled each year from the five UK biogeographic marine areas.
|
UK BIOGEOGRAPHIC REGION |
2011 |
2012 |
2013 |
2014 |
2015 |
2016 |
2017 |
2018 |
2019 |
2020 |
|
EASTERN CHANNEL |
78 |
0 |
133 |
0 |
101 |
0 |
122 |
36 |
91 |
0 |
|
IRISH SEA |
25 |
386 |
0 |
422 |
64 |
404 |
14 |
508 |
22 |
320 |
|
MINCHES AND WESTERN SCOTLAND |
22 |
0 |
0 |
0 |
0 |
0 |
0 |
89 |
0 |
44 |
|
NORTHERN NORTH SEA |
259 |
36 |
307 |
71 |
296 |
56 |
288 |
110 |
335 |
145 |
|
SCOTTISH CONTINENTAL SHELF |
0 |
0 |
0 |
92 |
0 |
0 |
0 |
0 |
44 |
0 |
|
SOUTHERN NORTH SEA |
311 |
0 |
342 |
0 |
259 |
0 |
469 |
0 |
454 |
0 |
|
WESTERN CHANNEL AND CELTIC SEA |
0 |
75 |
0 |
88 |
0 |
108 |
0 |
142 |
0 |
116 |
Table 4 shows the number of fish sampled within each age class for each assessment period for all five UK biogeographic regions. Sex did not explain any of the variability in the prevalence of liver neoplasms and was subsequently removed from the model.
Table 4: The number of interquartile range dab (per age class) sampled in corresponding UK biogeographic regions during the two assessment periods (2011-15 and 2016-2020).
|
|
2011-2015 |
2016-2020 |
2011-2015 |
2016-2020 |
2011-2015 |
2016-2020 |
2011-2015 |
2016-2020 |
2011-2015 |
2016-2020 |
2011-2015 |
2016-2020 |
2011-2015 |
2016-2020 |
|
AGE |
EASTERN CHANNEL |
EASTERN CHANNEL |
IRISH SEA |
IRISH SEA |
MINCHES & W. SCOTLAND |
MINCHES & W. SCOTLAND |
NORTHERN NORTH SEA |
NORTHERN NORTH SEA |
SCOTTISH CONT. SHELF |
SCOTTISH CONT. SHELF |
SOUTHERN NORTH SEA |
SOUTHERN NORTH SEA |
W. CHANNEL & CELTIC SEA |
W. CHANNEL & CELTIC SEA |
|
3 |
164 |
122 |
338 |
316 |
6 |
21 |
247 |
163 |
22 |
7 |
160 |
104 |
64 |
141 |
|
4 |
102 |
88 |
225 |
363 |
7 |
46 |
237 |
270 |
40 |
10 |
205 |
232 |
58 |
118 |
|
5 |
29 |
30 |
194 |
362 |
6 |
50 |
241 |
274 |
20 |
17 |
224 |
322 |
23 |
63 |
|
6 |
17 |
9 |
140 |
227 |
3 |
16 |
244 |
227 |
10 |
10 |
323 |
265 |
18 |
44 |
Development of assessment thresholds
The prevalence range of liver neoplasms in E&W waters is reportedly the highest observed within the OSPAR region of the Northeast Atlantic (Stentiford and others, 2009; Stentiford and others, 2010; Lang and others, 2015). As a result, the indicator response was classified into three response ‘background’, ‘elevated’ and ‘significant’ by dividing the total observable range of liver neoplasm prevalence corresponding to biogeographic region, into thirds (Table 5).
Table 5: Thresholds for background, elevated and significant responses for UK biogeographic regions were defined by separating the maximum observable range of liver neoplasm prevalence (7.9 %), into thirds.
|
BACKGROUND |
ELEVATED |
SIGNIFICANT |
|
RESPONSE |
RESPONSE |
RESPONSE |
|
≤2.63 % |
2.64-5.26 % |
≥5.27 % |
Statistical analysis and assessment of liver neoplasms by UK biogeographic region
There was a significant variation in the prevalence of liver neoplasms between individual UK biogeographic regions (Figure 5, Table 6). Statistical analysis of individual UK biogeographic regions revealed a statistically significant decrease (p=<0.001) in liver neoplasm prevalence in the Irish Sea (7.80 → 5.60 %), and the Western Channel and Celtic Sea regions (3.07 → 1.64), between the two assessment periods. The assessment for Irish Sea and the Western Channel and Celtic Sea regions was ‘significant response’ (≥5.27 %) and ‘background response’ (≤2.63 %), respectively (Table 5 and Table 6). A prevalence decrease was also observed in the Eastern Channel (3.21 → 2.01 %), and the Minches and Western Scotland (4.55 → 0.75 %) regions, although these were not statistically significant (p=0.365 and 0.205, respectively). The assessment for Eastern Channel, and the Minches and Western Scotland were ‘background response’. Increases in the prevalence of liver neoplasms between the two assessment periods were observed in the Southern North Sea (6.03 → 7.91 %), Northern North Sea (2.58 → 4.18 %), and Scottish Continental Shelf (1.09 → 2.27 %), although these results were not statistically significant (p=0.085, 0.080 and 0.736, respectively). The assessment for Southern North Sea, Northern North Sea, and Scottish Continental Shelf were ‘significant response’, ‘elevated response’ and ‘background response’, respectively. Taken together, there was a small increase (on average) in the prevalence of liver neoplasms collectively across UK biogeographic regions (4.96 → 5.0 %) between the two assessment periods, although this was not statistically significant.
Conclusions
This UKMS regional assessment indicates that there has been a marginal increase in the overall prevalence of liver neoplasms (cancer) in UK waters, although this is not statistically significant. The assessment indicates that the Irish Sea and Southern North Sea exhibit a ‘significant response’, whilst the Northern North Sea shows an ‘elevated response’. All remaining UK biogeographic regions exhibit a ‘background response’. Comparisons between regions should be interpreted carefully, since the sampling effort was different between regions during the assessment periods e.g. the number of sites per region and numbers of fish samples per location, therefore the difference in prevalence may be an artefact of sampling programme design.
Further information
This UKMS regional assessment indicates that there has been a marginal increase in the overall prevalence of liver neoplasms (cancer) in UK waters, although this is not statistically significant. The assessment indicates that the Irish Sea and Southern North Sea exhibit a ‘significant response’, whilst the Northern North Sea shows an ‘elevated response’. All remaining UK biogeographic regions exhibit a ‘background response’. Of the seven biogeographic regions assessed, only two exhibited a significant change in trend i.e. a statistically significant decrease in the Irish Sea, and Minches and Western Scotland regions. However, comparisons between regions should be interpreted carefully since the sampling effort (discussed below) was different between regions during the assessment periods. Examples of this include (1) the potential lack of fish available at fishing stations, (2) the number of sites per region varied resulting in considerable differences in the number of fish sampled between regions, and (3) the frequency in which E&W fishing stations were sampled in comparison to Scotland (Table 1). Consequently, the difference in prevalence may be an artefact of sampling programme design, highlighting the importance of maintaining consistency in long-term monitoring programmes.
This indicator assessment incorporates long-standing sampling sites from across the UK. These sites were established before the implementation of the UK biogeographic regions resulting in some regions containing more sampling sites compared to others e.g. Eastern English Channel contains three sampling sites compared to the Irish Sea, which contains twelve. This results in unbalanced data whereby the number of fish sampled per region varies considerably. Additionally, some sampling sites (including those in regions with relatively few), consistently fish relatively poorly resulting in relatively fewer numbers of fish for assessment purposes. This is further complicated when considering that this indicator assessment requires the use of interquartile range fish (3- to 6-years-old), which is a critical component for normalising age-related effects. This age data is not known to scientists in the field and is only obtained following downstream processing of otoliths within the laboratory, making it difficult to select for age during field sampling. Consequently, the combination of (1) differences in the number of sampling sites per biogeographic region, and (2) the odds of not obtaining enough interquartile range fish, can result in some regional assessments being statistically insignificant. Increasing the number of sites in underrepresented biogeographic regions and finding innovative ways to target interquartile range fish will help to address these challenges accordingly.
However, there are two potential options for mitigating these concerns. Firstly, establishing new sampling locations will increase their number within regions that have relatively few, helping to ensure that relatively consistent numbers of fish are sampled between biogeographic regions. Secondly, a previous study showed that whilst it is generally accepted that fish length is correlated to age, there is a wide variation in the mean age of dab between sampling locations, when selecting fish using length as stipulated in the International Council for Exploration of the Seas (ICES) guidelines (Stentiford and others 2010). Therefore, it would be beneficial to explore the distribution of historical length data for dab at each sampling location to help establish site-specific length selection criteria. This may allow for predominantly selecting dab within the interquartile age range, although will not increase the number of fish available at those locations that have historically provided relatively few fish.
References
Baumann, P.C. and Harshbarger, J.C., (1995). Decline in liver neoplasms in wild brown bullhead catfish after coking plant closes and environmental PAHs plummet. Environmental Health Perspectives, 103(2), p.168.
Easey, W. and Millner, R.S., (2008). Improved methods for the preparation and staining of thin sections of fish otoliths for age determination. Cefas Science Serries Technical Report, 143: 12pp.
Feist, S.W., Lang, T., Stentiford, G.D., Köhler, A., (2004). Biological effects of contaminants: Use of liver pathology of the European flatfish dab (Limanda limanda L.) and flounder (Platichthys flesus L.) for monitoring. ICES techniques in marine environmental sciences, 1-43.
Hawkins, W.E., Walker, W.W., Overstreet, R.M., Lytle, J.S. and Lytle, T.F., (1990). Carcinogenic effects of some polycyclic aromatic hydrocarbons on the Japanese medaka and guppy in waterborne exposures. Science of the total environment, 94(1-2), pp.155-167.
Hinton, D. E. and Couch, J. A. (1998). Architectural pattern, tissue and cellular morphology in livers of fishes: relationship to experimentally induced neoplastic responses. In Fish Ecotoxicology. Braunbeck, T., Hinton, D.E., Streit, B. (eds), pp 141-64. Birkhäuser Verlag, Basel, Switzerland.
Hinton, D. E., Segner, H. and Braunbeck, T. (2001). Toxic responses of the liver. In Target Organ Toxicity in Marine and Freshwater teleosts, Volume 1. Schlenk, D., Benson W.H. (eds), pp. 225 - 266. CRC Press, Boca Raton.
Hinton, D. E., Segner, H., Au, D. W., Kullman, S. W. and Hardman, R. C. (2008). Liver toxicity. In The Toxicology of Fishes. Giulo, R.T., Hinton, D.E. (eds), pp. 327 - 400. CRC Press, Boca Raton.
Köhler, A., (1990). Identification of contaminant-induced cellular and subcellular lesions in the liver of flounder (Platichthys flesus L.) caught at differently polluted estuaries. Aquatic Toxicology 16, 271-293.
Lang, T., Wosniok, W., Barsiene, J., Broeg, K., Kopecka, J., Parkkonen, J., (2006). Liver histopathology in Baltic flounder (Platichthys flesus) as indicator of biological effects of contaminants. Marine Pollution Bulletin 53, 488-496.
Lang, T., Feist, S.W., Stentiford, G.D., Bignell, J.P., Vethaak, A.D. and Wosniok, W., (2017). Diseases of dab (Limanda limanda): Analysis and assessment of data on externally visible diseases, macroscopic liver neoplasms and liver histopathology in the North Sea, Baltic Sea and off Iceland. Marine Environmental Research, 124, pp.61-69.
Myers, M.S., Landahl, J.T., Krahn, M.M., Johnson, L.L. and McCain, B.B., (1990). Overview of studies on liver carcinogenesis in English sole from Puget Sound; evidence for a xenobiotic chemical etiology I: pathology and epizootiology. Science of the Total Environment, 94(1), pp.33-50.
Myers, M.S., Stehr, C.M., Olson, O.P., Johnson, L.L., McCain, B.B., Chan, S.L. and Varanasi, U., (1994). Relationships between toxicopathic hepatic lesions and exposure to chemical contaminants in English sole (Pleuronectes vetulus), starry flounder (Platichthys stellatus), and white croaker (Genyonemus lineatus) from selected marine sites on the Pacific Coast, USA. Environmental Health Perspectives, 102(2), p.200.
Myers, M.S., Johnson, L.L., Hom, T., Collier, T.K., Stein, J.E. and Varanasi, U., (1998). Toxicopathic hepatic lesions in subadult English sole (Pleuronectes vetuls) from Puget Sound, Washington, USA: relationships with other biomarkers of contaminant exposure. Marine Environmental Research, 45(1), pp.47-67.
Myers, M.S., Anulacion, B.F., French, B.L., Reichert, W.L., Laetz, C.A., Buzitis, J., Olson, O.P., Sol, S. and Collier, T.K., (2008). Improved flatfish health following remediation of a PAH-contaminated site in Eagle Harbor, Washington. Aquatic Toxicology, 88(4), pp.277-288.
Stein, J.E., Reichert, W.L., Nishimoto, M. and Varanasi, U., (1990). Overview of studies on liver carcinogenesis in English sole from Puget Sound; evidence for a xenobiotic chemical etiology II: biochemical studies. Science of the total environment, 94(1), pp.51-69.
Stehr, C.M., Myers, M.S., Johnson, L.L., Spencer, S., Stein, J.E., (2004). Toxicopathic liver lesions in English sole and chemical contaminant exposure in Vancouver Harbour, Canada. Marine Environmental Research 57, 55-74.
Stentiford, G.D., Bignell, J.P., Lyons, B.P. and Feist, S.W., (2009). Site-specific disease profiles in fish and their use in environmental monitoring. Marine Ecology Progress Series, 381, pp.1-15.
Stentiford, G.D., Longshaw, M., Lyons, B.P., Jones, G., Green, M., Feist, S.W., (2003). Histopathological biomarkers in estuarine fish species for the assessment of biological effects of contaminants. Marine Environmental Research 55, 137-159.
Stentiford, G.D., Bignell, J.P., Lyons, B.P., Thain, J.E., Feist, S.W., (2010). Effect of age on liver pathology and other diseases in flatfish: implications for assessment of marine ecological health status. Marine Ecology Progress Series 411, 215-230.
UKMMAS. 2010. Charting Progress 2. The state of UK seas. Department of Environment, Food and Rural Affairs, London, UK. ISBN 9780112432937. 166pp. Available from: http://webarchive.nationalarchives.gov.uk/20141203181034/http://chartingprogress.defra.gov.uk/
Vethaak, A.D. and Jol, J.G., (1996). Diseases of flounder Platichthys flesus in Dutch coastal and estuarine waters, with particular reference to environmental stress factors. I. Epizootiology of gross lesions. Diseases of Aquatic Organisms, 26(2), pp.81-97.
Vethaak, A.D., Jol, J.G. and Pieters, J.P., (2009). Long-term trends in the prevalence of cancer and other major diseases among flatfish in the southeastern North Sea as indicators of changing ecosystem health. Environmental science & technology, 43(6), pp.2151-2158.
Authors
John Paul Bignell1, Mickael Teixeira Alves1, Hannah Anderson2
1Centre for the Environment, Fisheries and Aquaculture Science
2Marine Directorate of the Scottish Government
Citation:
John Paul Bignell, Mickael Teixeira Alves, Hannah Anderson (2024). Trends and status of liver neoplasms in flatfish indicator assessment for the UK Marine Strategy. In: UK Marine Online Assessment Tool, available at: https://moat.cefas.co.uk/pressures-from-human-activities/contaminants/liver-neoplasms/
Assessment metadata
| Assessment Type | UK Marine Strategy |
|---|---|
Contaminants | |
| Point of contact email | marinestrategy@defra.gov.uk |
| Metadata date | Sunday, June 1, 2025 |
| Title | Trends and status of liver neoplasms in flatfish |
| Resource abstract | |
| Linkage | |
| Conditions applying to access and use | © Crown copyright, licenced under the Open Government Licence (OGL). |
| Assessment Lineage | |
| Dataset metadata | |
| Dataset DOI | The Scottish Government, Marine Directorate. 2025. https://doi.org/10.7489/12541-1 |
The Metadata are “data about the content, quality, condition, and other characteristics of data” (FGDC Content Standard for Digital Geospatial Metadata Workbook, Ver 2.0, May 1, 2000).
Metadata definitions
Assessment Lineage - description of data sets and method used to obtain the results of the assessment
Dataset – The datasets included in the assessment should be accessible, and reflect the exact copies or versions of the data used in the assessment. This means that if extracts from existing data were modified, filtered, or otherwise altered, then the modified data should be separately accessible, and described by metadata (acknowledging the originators of the raw data).
Dataset metadata – information on the data sources and characteristics of data sets used in the assessment (MEDIN and INSPIRE compliance).
Digital Object Identifier (DOI) – a persistent identifier to provide a link to a dataset (or other resource) on digital networks. Please note that persistent identifiers can be created/minted, even if a dataset is not directly available online.
Indicator assessment metadata – data and information about the content, quality, condition, and other characteristics of an indicator assessment.
MEDIN discovery metadata - a list of standardized information that accompanies a marine dataset and allows other people to find out what the dataset contains, where it was collected and how they can get hold of it.