
Condition of Benthic Habitat Communities based on the Relative Margalef diversity index
In the Celtic Seas, Good Environmental Status was achieved in 32% of assessments and not achieved in 68% of assessments, where adequate data was sufficient to calculate the values. This is the first assessment in the UKMS for the Celtic Seas for this indicator.
The confidence in the assessment is generally poor or low due to the lack of monitoring data suitable for the assessment. Assessments are mostly based on data collected during 2009-2015, as more recent data are limited.
In the Greater North Sea, the OSPAR assessment for the Condition of Benthic Habitat Communities: Margalef diversity in Region II (Greater North Sea) was used to assess GES in 2024 for the UK and indicated uncertain status.
Background
Benthic habitats are vital for the health of the marine environment and are under threat from various anthropogenic pressures, including but not limited to, physical disturbance, nutrient and organic enrichment, sedimentation, and contaminants. All these pressures are expected to reduce the diversity of benthic communities at various degrees, depending on the sensitivity of individual species and/or communities to different types of pressures.
The indicator Condition of Benthic Habitat Communities (hereafter BH2b) is based on the Margalef diversity index (i.e., number of species corrected for their abundance) which is calculated at sample level and compared against reference values to obtain a Relative Margalef diversity index (DM’) and assess the state of benthic habitats. Relative Margalef diversity ranges from 0 to 1, with higher values indicating higher diversity.
This indicator has been used previously in the OSPAR Intermediate Assessment (IA2017; OSPAR, 2017) and UK Marine Strategy 2019 (UKMS; Phillips and others, 2018) to assess condition of subtidal habitats in the Southern North Sea.
The application of the BH2b indicator has been further expanded for the OSPAR Quality Status Report 2023 (QSR 2023) to assess benthic habitat condition in the Greater North Sea, using benthic monitoring data collected with grabs or cores (Wijnhoven and others, 2023). In comparison with the OSPAR IA2017, the method made assessments at broad scale habitat classifications based on the North Atlantic definitions and used a different approach to estimate reference values.
This assessment applied the BH2b method to assess condition in the UKMS Celtic Seas for the first time.
Figure 1. Mediomastus fragilis, Lumbrineris spp. and venerid bivalves in circalittoral coarse sand or gravel. Photo credit: Keith Hiscock

Further information
The BH2b indicator is a common indicator in OSPAR Region II (Greater North Sea) and candidate in OSPAR Region III (Celtic Seas). The methodology applied in this assessment was based on the latest development produced for the QSR 2023.
The indicator uses relative benthic community diversity as an indicator of the benthic habitat quality status. Community diversity is assessed using the Margalef diversity index (DM) given by:

S = species richness
N = total sample abundance
To account for natural variability of diversity between different broad scale habitat types (BHTs) and assessment areas, the Relative Margalef Diversity (DM’) is used to assess habitat condition:

Dass = Assessed/sample Margalef diversity
Dref = Reference Margalef diversity for good ecological state
The value for Dref is estimated from Margalef diversity (DM) values from samples collected in low pressure areas. Reference Margalef diversity estimates are specific to broad scale habitats within the same biogeographical area.
During development and optimisation of the BH2b method (van Loon and others, 2018) anthropogenic pressures tested included bottom-contacting fishing, organic enrichment, sedimentation, and Titanium dioxide contamination. Margalef diversity was shown to be one of the best performing benthic indices when assessing these pressures in the Southern North Sea and can be regarded as a generally applicable multi-pressure index with relatively high sensitivity and precision (van Loon and others, 2018). Although physical disturbance by fisheries is considered the most widespread anthropogenic pressure on the condition of benthic habitats, interpretations of assessment results should consider additional pressures present in the area or habitat of interest, both environmental and anthropogenic.
BH2b is in principle applicable to any assessment unit and habitat type providing the availability of enough data collected with standardised methodologies and the possibility of calculating reference condition for the estimation of Relative Margalef diversity (DM’).
In the QSR 2023, three sampling categories were suggested for application of BH2b in the Greater North Sea:
-
Grab-Core: Sampled surface area around 0.1 m2 and mesh size of 1 mm
-
Dredge-Trawl: Sampled surface area >3 m2 and mesh sizes in range 5 mm – 2.2 cm
-
Small core: Sampled surface area around 0.0143 m2 and mesh size of 1 mm
These categories were selected based on the data made available by OSPAR Contracting Parties as part of a data call put forward for the QSR 2023, with the aim to maximise the comparability of the data.
Relative Margalef diversity DM’ can be calculated for any type of community data where the sampling, laboratory procedures and specimen recordings including taxonomy are standardised as much as possible. Lack of, or incomplete, standardisation can affect assessment results, therefore, datasets should be stratified accordingly to minimise noise caused by differences in sampling methodology or biogeography. It is acknowledged that a full standardisation was problematic, as there was no standardised agreed benthic monitoring protocol. Although three sampling categories were originally suggested, the QSR 2023 assessment did not consider dredge/trawl samples due to the large variation in sample diversity observed for this sampling category. The small core samples of 0.0143 m2 were included as the common monitoring approach for Denmark only.
The use of the Relative Margalef Diversity (DM’), based on case specific reference values (sampling methodology, habitat type, and biogeography), allows the comparison of community diversity at the scale of assessment areas (e. g. OSPAR benthic assessment units or CP2 Regions) as an indicator of community status.
At present there are not agreed OSPAR thresholds at regional level. For the purposes of summarising results for the QSR 2023 assessment of the Greater North Sea DM’ results were provisionally grouped into three broad categories. These groups were derived from the exponentially decreasing relationship between normalized Margalef diversity and fishing activity outlined in van Loon and others (2018), using as boundary between low and moderate diversity the diversity values observed at the boundary between moderate and high fishing intensity levels (as defined in the indicator Extent of Physical Disturbance (BH3)):
-
relatively low diversity (DM’ <0.6)
-
relatively moderate diversity (DM’ ≥ 0.6 & < 0.8)
-
relatively high diversity (DM’ ≥ 0.8)
For reporting of the UK Marine Strategy Part 1 2024, the relative diversity categories applied in the QSR2023 were further grouped to identify Good Environmental Status (GES), using relative Margalef diversity = 0.6 as quality threshold between good/not good status
This assessment is the first application of the BH2b method in the Celtic Seas. The results presented here in combination with the outcomes of the QSR 2023 assessment for the Greater North Sea will provide a more complete assessment of benthic habitat condition in the UKMS Celtic Seas sub-region.
Assessment method
Overview of the UKMS assessment method for the Relative Margalef Diversity Index in the Celtic Seas
This assessment focused on the UKMS Celtic Seas sub-region (Figure 2). To reduce the effect of natural variability in the characteristics of benthic communities, The Celtic Seas area was additionally divided by the Charting Progress 2 regions (CP2; JNCC, 2022). These regions have been drafted based on key environmental characteristics, grouping data by these regions helped avoid some of the biogeographic variability among broad scale habitats inherent across the whole Celtic Seas area.
Benthic sample data covering the period 2009 to 2021 were selected to match those reported for the QSR 2023 (Wijnhoven and others, 2023) with two assessment periods considered: i) 2016 to 2021, representing the most recent years and ii) 2009 to 2015 representing the previous reporting cycle reported in the IA2017 (OSPAR, 2017) and UK Marine Strategy 2019 (Phillips and others, 2018). Fishing pressure information that most closely matched the assessment period (2009 to 2020; ICES, 2021) was used when identifying areas of low anthropogenic pressure for estimations of reference Margalef diversity (Dref).
The indicator used Margalef diversity (species richness and natural logarithm of sample abundance) as an indicator for impacts of anthropogenic pressures.
Analysis was primarily undertaken using R Statistical Software (v3.6.1; R core Team, 2019), primarily with the ‘sf’ (Pebesma, 2018) and ‘tidyverse’ packages (Wickham and others, 2019) amongst others. The scripts used to prepare and process the data for the assessment are presented using the ‘rmarkdown’ package (Allaire and others, 2022) and available by request from the JNCC.
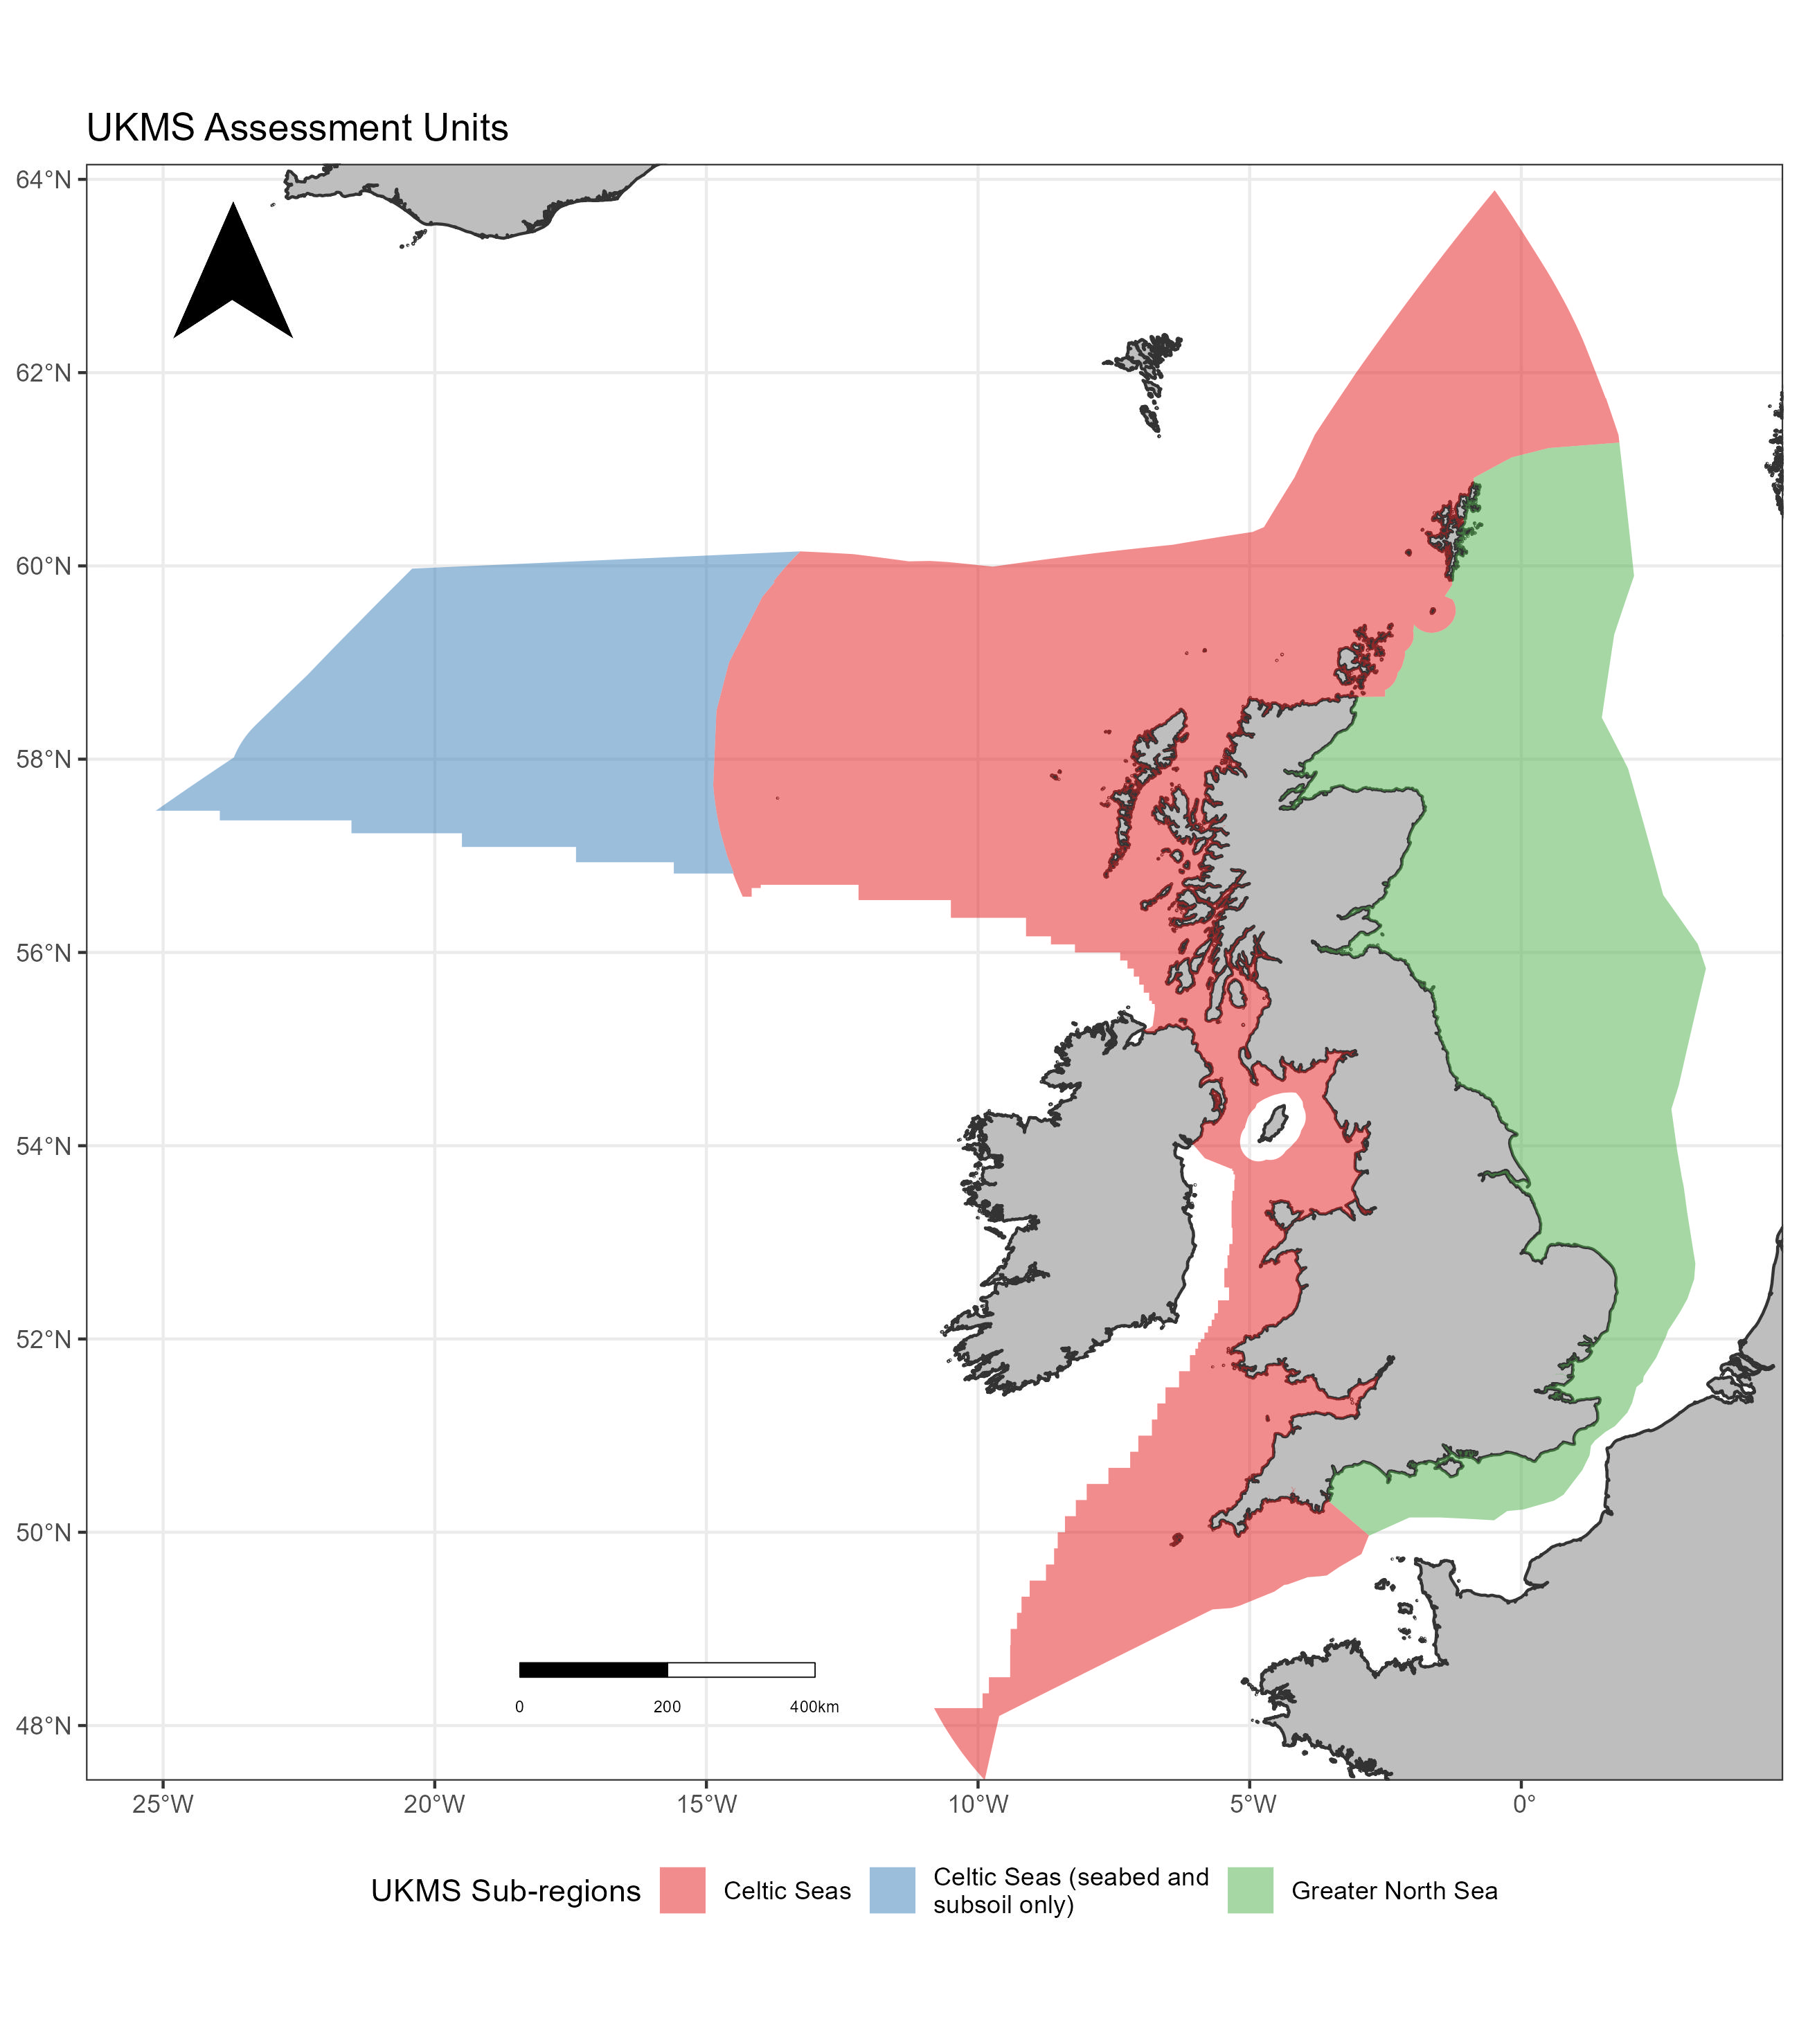
Figure 2. UK Marine Strategy sub-regions.
Data Gathering
Benthic sample data covering the period 2009-2021 were extracted from Marine Recorder (Public) snapshot: https://jncc.gov.uk/our-work/marine-recorder/(version "2022-08-05"), the OneBenthic Database (OneBenthic, 2020) and the ‘Marine Environment Monitoring and Assessment National database’ (MERMAN; snapshot obtained on 17/08/2022, licensed under the Open Government Licence v3.0, nationalarchives.gov.uk).
Additional data were provided by UK agencies in response of a data call to the benthic subgroup of the Healthy and Biologically Diverse Seas Evidence Group (HBDSEG):
-
the Environment Agency provided data from the Water Environment Regulations (WER) dataset. Data from WER contains public sector information licensed under the Open Government Licence v3.0 (OGL, nationalarchives.gov.uk).
-
Natural Resources Wales provided an extract from the KiEco database showing benthic sample grab sites across the Celtic Sea. Information provided in the dataset include sample details, species found in the area, and the type of sediment on the seabed. “Contains Natural Resources Wales information © Natural Resources Wales and database right. All rights reserved.”
Additional data portals were queried for suitable data: the national biodiversity Data Archive Centre, DASSH, and Marine Data Exchange portals. No further data were, however, extracted from these portals, given that information available was very granular, difficult to navigate, variable in the format, and potentially duplicating information already available in Marine Recorder or OneBenthic. For these reasons the amount of work required to gather, format and screen the data from these sources at the spatial scale need for the assessment was considered unfeasible.
Benthic sample data were filtered to the boundaries of the Celtic Seas sub-region area (Figure 3), no sample data were available for the ‘Celtic Seas (seabed and subsoil only)’ reporting area (Figure 2). Sample data were intersected with Charting Progress 2 Regions (CP2; JNCC, 2022), hereafter referred as assessment units. CP2 regions were used to stratify the data and reduce the effect of natural variability in the calculation of habitat specific reference diversity values. The use of CP2 regions for data stratification was preferred over the use of OSPAR benthic assessment units given the unequal distribution of monitoring data. For example, within the OSPAR Northern Celtic Sea assessment unit, approximately 75% of samples are in the Irish Sea CP2 region with relatively few samples beyond the Western Isles. By splitting the Northern Celtic Sea in four CP2 regions it reduced the risk of inferring habitat condition from samples collected in different bioregions.
No sample data were available in the Atlantic North-West Approaches, Rockall Trough and Faroe-Shetland Channel CP2 region.
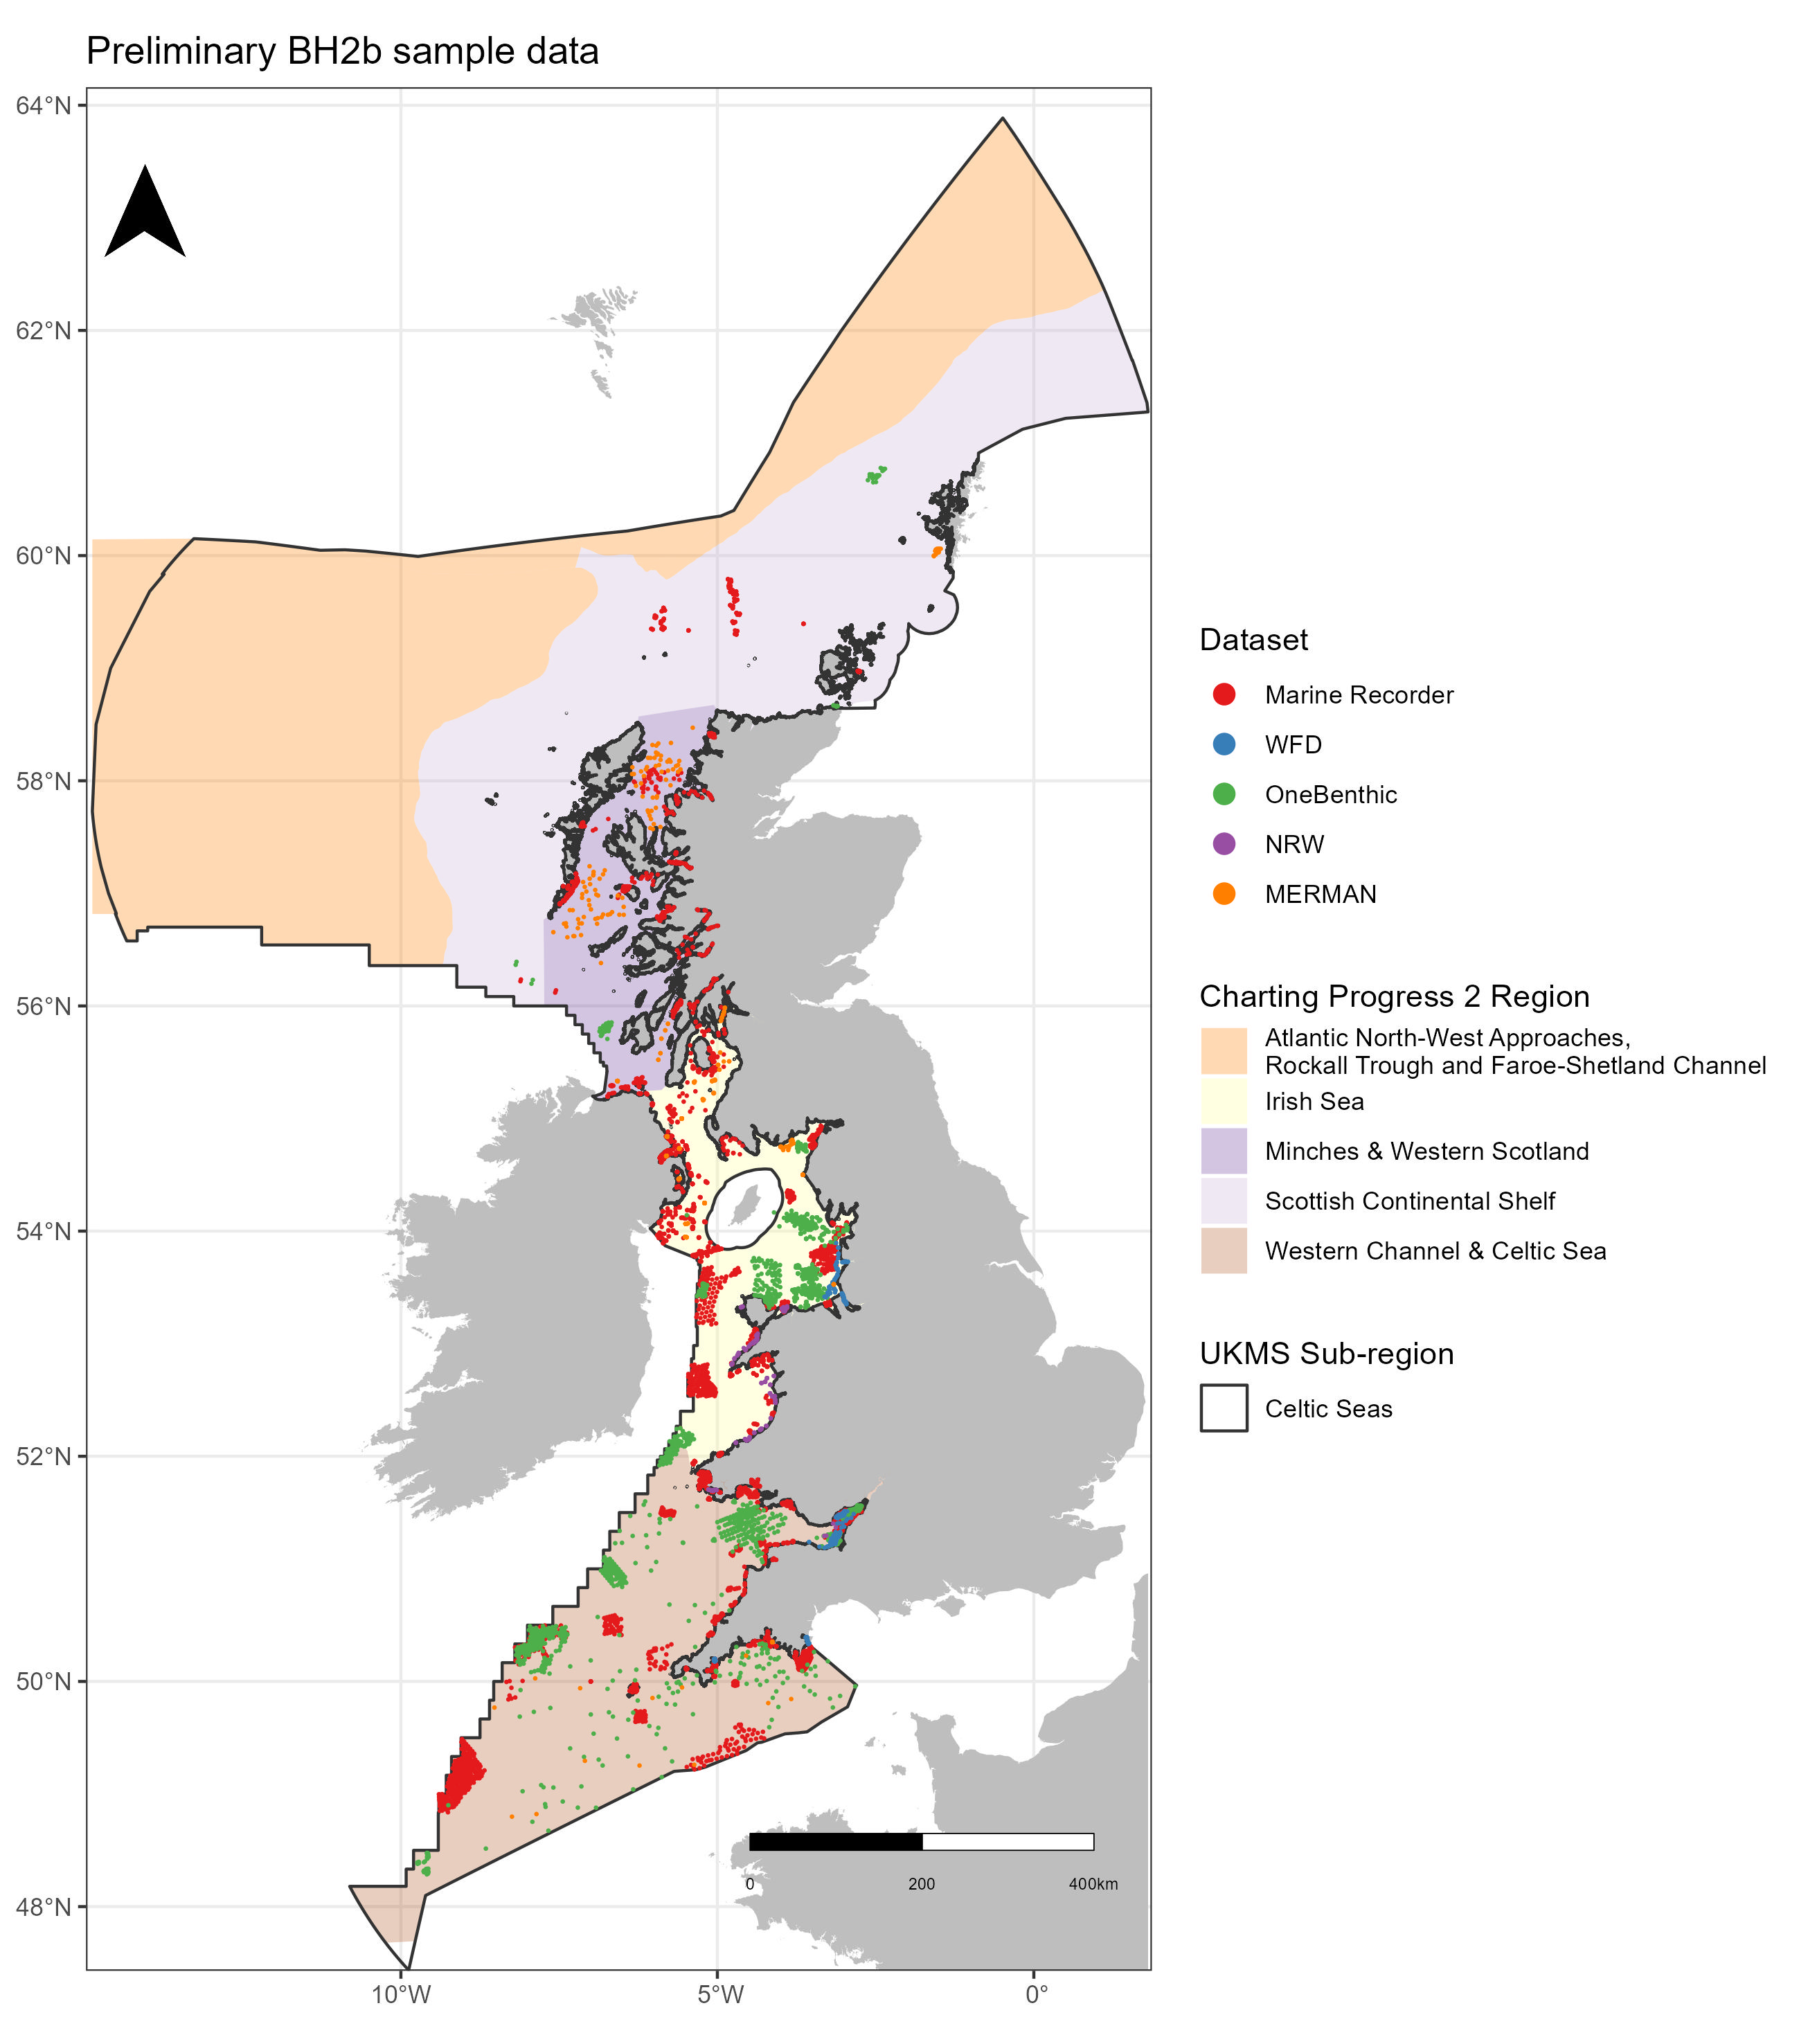
Figure 3: Distribution of data considered for the Celtic Seas BH2b assessment. The reporting region “Celtic Seas (seabed and subsoil only)” is not displayed as no data were available. Data sources included Marine Recorder (version "2022-08-05"), Water Environment Regulations (Water Framework Directive (WFD) in the map legend) monitoring data (Environment Agency), Natural Resources Wales dataset, MERMAN and the OneBenthic Grab/Core database (2020).
Removal of duplicated survey data
As the aforementioned datasets potentially included duplicated survey data, the extracted data were checked for duplicates before further analyses. Duplicates between datasets were identified and removed based on their location and associated metadata. Sample data from the Marine Recorder dataset was prioritised where duplication was identified in the other datasets.
Exclusion of data from transitional waters
Prior to analysis sample data were screened for locations inside transitional waterbodies. The BH2b indicator was not developed with samples from transitional waters, therefore any possible reduction in diversity within reduced salinity habitats might be misrepresented as decreased habitat condition. Transitional water body layers were sourced via government portals, accessible through the Open Government Licence (nationalarchives.gov.uk). Details of the transitional water body layers is provided as supporting information and is available on request from JNCC.
Data standardisation
The calculation of Relative Margalef Diversity (DM’) required estimation of Margalef reference values (Dref) from areas estimated to have low anthropogenic pressure. Pressure information from littoral and intertidal habitats was unavailable, therefore samples from those habitats were excluded from the assessment.
Sampling effort influences Margalef diversity, with a greater diversity (species accumulation) expected with increased sample size and / or smaller sieve mesh size (greater retention of biota). For comparable Margalef diversity, samples were stratified according to the sampling device, approximate sampled surface area, and sieve mesh size used. In accordance with the methodology used for the OSPAR QSR 2023, only the following gear types were initially considered:
-
Grab-Core: Sampled surface area approximately 0.1 m2 and mesh size of 1 mm
-
Dredge-Trawl: Sampled surface area >3 m2 and mesh sizes in range 0.5 to 2.2 cm
-
Small core: Sampled surface area approximately 0.0143 m2 and mesh size of 1 mm
Sample metadata were investigated, and any grab or core sample methods consistently recorded with sampled areas other than 0.1 m2 were removed. Dredge and trawl samples were investigated; however, sampled area, volume, and mesh sieve were not consistently recorded, and these samples were removed from the assessment. The ‘Small core’ category was used in the OSPAR QSR 2023 to account for monitoring methods used in Danish waters, the method is not present in the Celtic Seas sample data.
Following standardisation, the following sample methodologies were retained in the ‘Grab-Core’ group for the assessment:
-
0.1m2 Day grab
-
0.1m2 Hamon grab
-
0.1m2 Van Veen grab
-
0.1m2 Nioz Box Core (initially retained but not included in the final assessment results)
-
0.1m2 Grab unspecified
Sample collection metadata was screened for sieve mesh size used during sample processing to ensure comparability between records. Approximately 70% of the dataset had sieve mesh information, with approximately 54% of the dataset having been processed with a 1 mm mesh size. To maximise data coverage, survey data without analysis mesh size metadata were shared with the Benthic Sub-Group (BSG) to fill in data gaps. Additionally, survey details available on the MEDIN data portal were interrogated for evidence of the analysis methodology. Following screening only samples processed with 1 mm mesh were retained for the assessment.
To enable estimation of Margalef reference values for broad scale habitat all sample data were assigned EUNIS 2007 habitat classification codes where possible. Where EUNIS classification codes were present in sample metadata these were prioritised, these accounted for approximately half of the samples from Marine Recorder.
Any samples without EUNIS habitat information were assigned EUNIS codes with a spatial join to the composite habitat map (Figure 4; Castle and others, 2021). The composite habitat map integrated component habitat maps from both in-situ survey datasets and modelled data (in the absence of direct sample data). Habitats were mapped to the highest resolution of detail available, ranging from EUNIS Level 2 (physical habitats) to Level 6 (biological communities) via the following data sources and processes:
-
EUNIS habitat maps derived from surveys within the OSPAR Maritime Area extracted from EMODnet spatial data downloads portal [https://www.emodnet-seabedhabitats.eu/access-data/download-data].
-
Remaining gaps filled by EUSeaMap 2021 (Broad scale predictive habitat maps) comprising:
-
-
EUSeaMap 2021 obtained from EMODnet spatial data downloads portal [https://www.emodnet-seabedhabitats.eu/access-data/download-data] (Vasquez and others, 2021) which covered all European sea basins where the EMODnet Geology seabed substrate map is available.
-
-
-
UKSeaMap 2018 (Manca & Lillis, 2022) a version of EUSeaMap that incorporated greater spatial resolution data available in United Kingdom waters, as revised by the Joint Nature Conservation Committee (JNCC). UKSeaMap 2018 was incorporated to ensure the highest resolution of data was used where available.
-
To enhance the comparability of assessment results with those documented in the Greater North Sea for the OSPAR QSR 2023, EUNIS 2007 habitat codes were converted into broad scale habitat classifications using the North Atlantic definitions (hereafter referred to as broad scale habitat types). A translation table was created by habitat classification experts at JNCC and EMODnet to facilitate correlation between EUNIS habitats and broad scale habitat types (BHTs). In some instances, translations require combinations of EUNIS code, biological zone and / or substrate information to correctly assign BHT where EUNIS habitats contained or partially overlapped with multiple BHTs. Biological zone and substrate information were obtained from a spatial join with EUSeaMap 2021 (EMODNet, 2021). EUNIS habitat codes, biological zone, and substrate type information was then combined to provide the corresponding broad scale habitat type using North Atlantic definitions. The approach to use translations from EUNIS, rather than a direct spatial join with EUSeaMap 2021 BHTs, allowed the retention of any habitat information attributed to a sample to be retained (i.e., Marine Recorder EUNIS metadata).
Following the spatial join of sample locations with the composite habitat map and subsequent translation to broad scale habitat type, approximately 1% of samples were assigned to ‘rock and biogenic reef’ broad scale habitats. In accordance with the approach used for the assessment in the Greater North Sea (Wijnhoven and others, 2023), these habitat types were considered unlikely to be sampled with grabs or box cores. In most instances sample habitat information indicating rock or biogenic reef can be ascribed to possible misalignments or inaccuracies with the mapped habitat data. Following the OSPAR QSR 2023 rationale, any samples assigned to ‘rock and biogenic reef’ broad scale habitats were assigned to ‘mixed sediments’ broad scale habitats. Samples that could not be assigned broad scale habitat types, such as those lacking habitat information or the necessary data for translation into broad scale habitat types, were removed from the dataset.
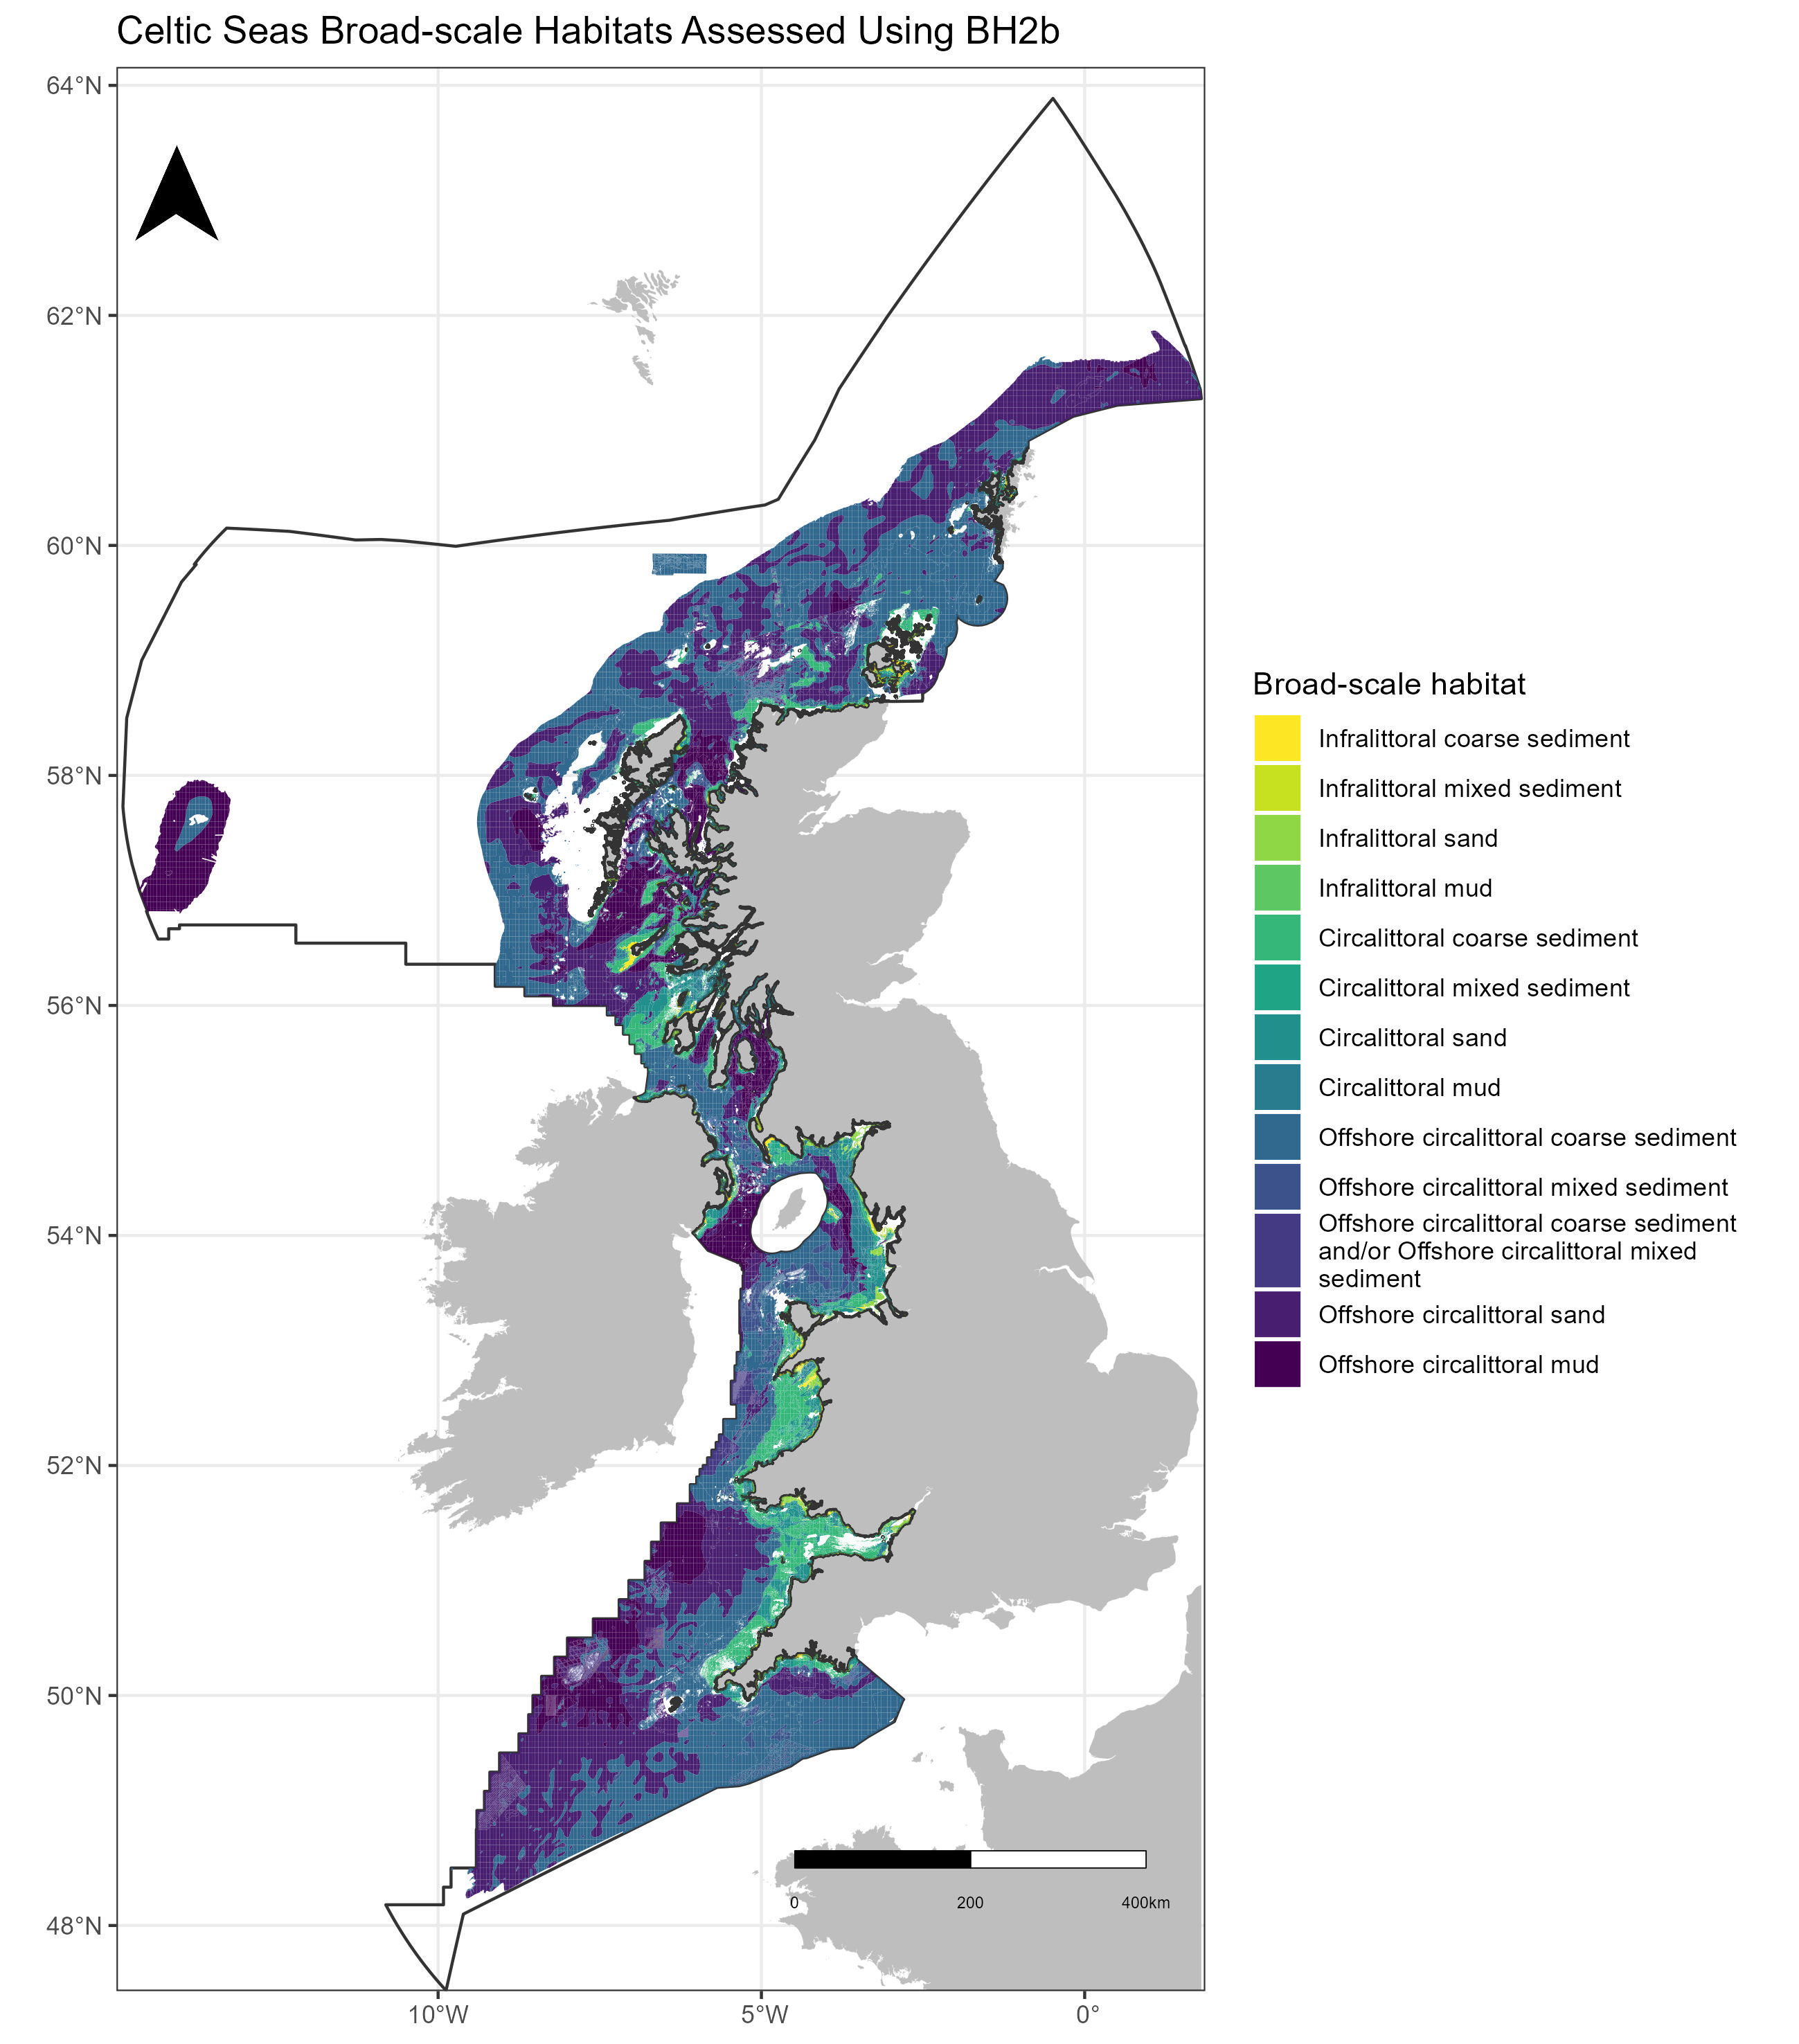
Figure 4: Composite map of broad scale habitats included in the BH2b assessment. The map displays only the habitats for which enough samples were available to produce an assessment with the current indicator method. Classifications based on the North Atlantic definitions following translation from EUNIS 2007.
Data were screened and converted where required to obtain taxa abundance values. One sample with taxa only recorded using the SACFOR scale was removed from the dataset, whilst taxa recorded as presence/absence were retained for conversion to abundance values of 1 following the BH2b CEMP guidelines. Qualifiers attached to taxa names were investigated and any records not suitable for determining diversity were removed, these included records of eggs, seeds, and tubes. There was no consistent taxonomic discrimination policy used to assign life stage qualifiers to taxa records, therefore records with juvenile life stages qualifiers were not removed (BH2b CEMP guidelines). Following the exclusion of records unrelated to the direct presence of the taxon (such as eggs), duplicate taxon names were merged, and the abundance values were combined. For example, Syllis ‘sp. A’ and Syllis ‘sp. B’ were amalgamated to the same taxon name (Syllis) and abundance values summed.
Exploratory analysis was undertaken to identify any outlier records of taxa abundance. Although many records of high abundance were identified in the datasets none were identified as erroneous. Following standardisation of the data, many instances of high abundance were removed or assigned presence/absence in later stages (e.g., Nematoda and Thecostraca).
The taxonomic standardisation protocol used for the Greater North Sea assessment and OSPAR CEMP guidelines were used to guide the taxonomic standardisation for the Celtic Seas assessment. The biological data were standardised and aggregated as follows:
-
Taxa names checked using the internationally standardised WoRMS list (WoRMS, 2023).
-
Duplicates records belonging to same taxon (e.g., due to adults and juveniles) aggregated by summation.
-
Aggregations to alternative genus level or genus/species complex names for taxa with problematic or uncertain identification protocols.
-
Taxa recorded as ‘Presence’ converted to a numerical abundance of ‘1’.
-
Records from taxonomic groups likely to be represented as ‘Presence/absence’ were assigned a numerical abundance of ‘1’ (e.g., barnacles and colonial taxa).
-
Removal of taxonomic groups not recorded consistently in grab samples (e.g., bacteria, algae, dinoflagellates, plants, foraminifera, protozoans).
-
Removal of low taxonomical resolution records (i.e., kingdom or ‘cnidaria’).
Details of the standardisation and aggregation protocol is provided as supporting information and available on request from JNCC.
Parameter/metric
The metric used by BH2b as a measure of benthic habitat quality is the Relative Margalef diversity index (DM’), which is defined as the Margalef diversity assessed at sample level (Dass) divided by the Margalef diversity expected in reference condition (Dref).
Margalef diversity is an estimation of the number of species corrected by sample abundance (see details in section ‘Index calculation’).
As reference values (Dref) are specific for a particular combination of assessment area, habitat type, and sampling methodology, the use of Relative Margalef diversity (DM’) allows comparison of results from data collected in different habitats, assessment areas, and potentially with different methods. Relative Margalef diversity (DM’) generally ranges from 0 to 1, with high values associated to high diversity in comparison with reference conditions. Values for DM’ can in practice be higher than 1 where the diversity observed for a sample is higher than the estimated reference diversity from low pressure areas. Given the natural variations of diversity expected at sample level and the percentile estimation method (see below) a small proportion of DM’ values greater than 1 is expected. However, large ratios of DM’ values greater than 1 can occur when Dref is estimated from a limited number of samples, or the ‘low pressure’ areas do not fully represent broad scale habitat diversity. In case DM’ transgresses a value of 1, this was considered equal to DM’ = 1.
Reference values estimation
To calculate the Relative Margalef diversity index, reference Margalef (Dref) were initially defined for assessment unit and habitat. Reference conditions are defined as areas exposed to low levels of fishing pressure. These areas were selected using Swept Area Ratio (SAR) values at c-square resolution (0.05 x 0.05) obtained by ICES for the period 2009-2021 (ICES, 2021). For each c-square, an aggregated SAR value for surface abrasion (abrasion caused by bottom contacting fishing gears with penetration <2cm) was calculated by averaging the annual SAR values observed within the c-cell during the assessment period (Figure 5). Mean annual SAR was calculated following the same process utilised in the Greater North Sea assessment, i.e., the mean of reported annual SAR with ‘Null’ year values removed.
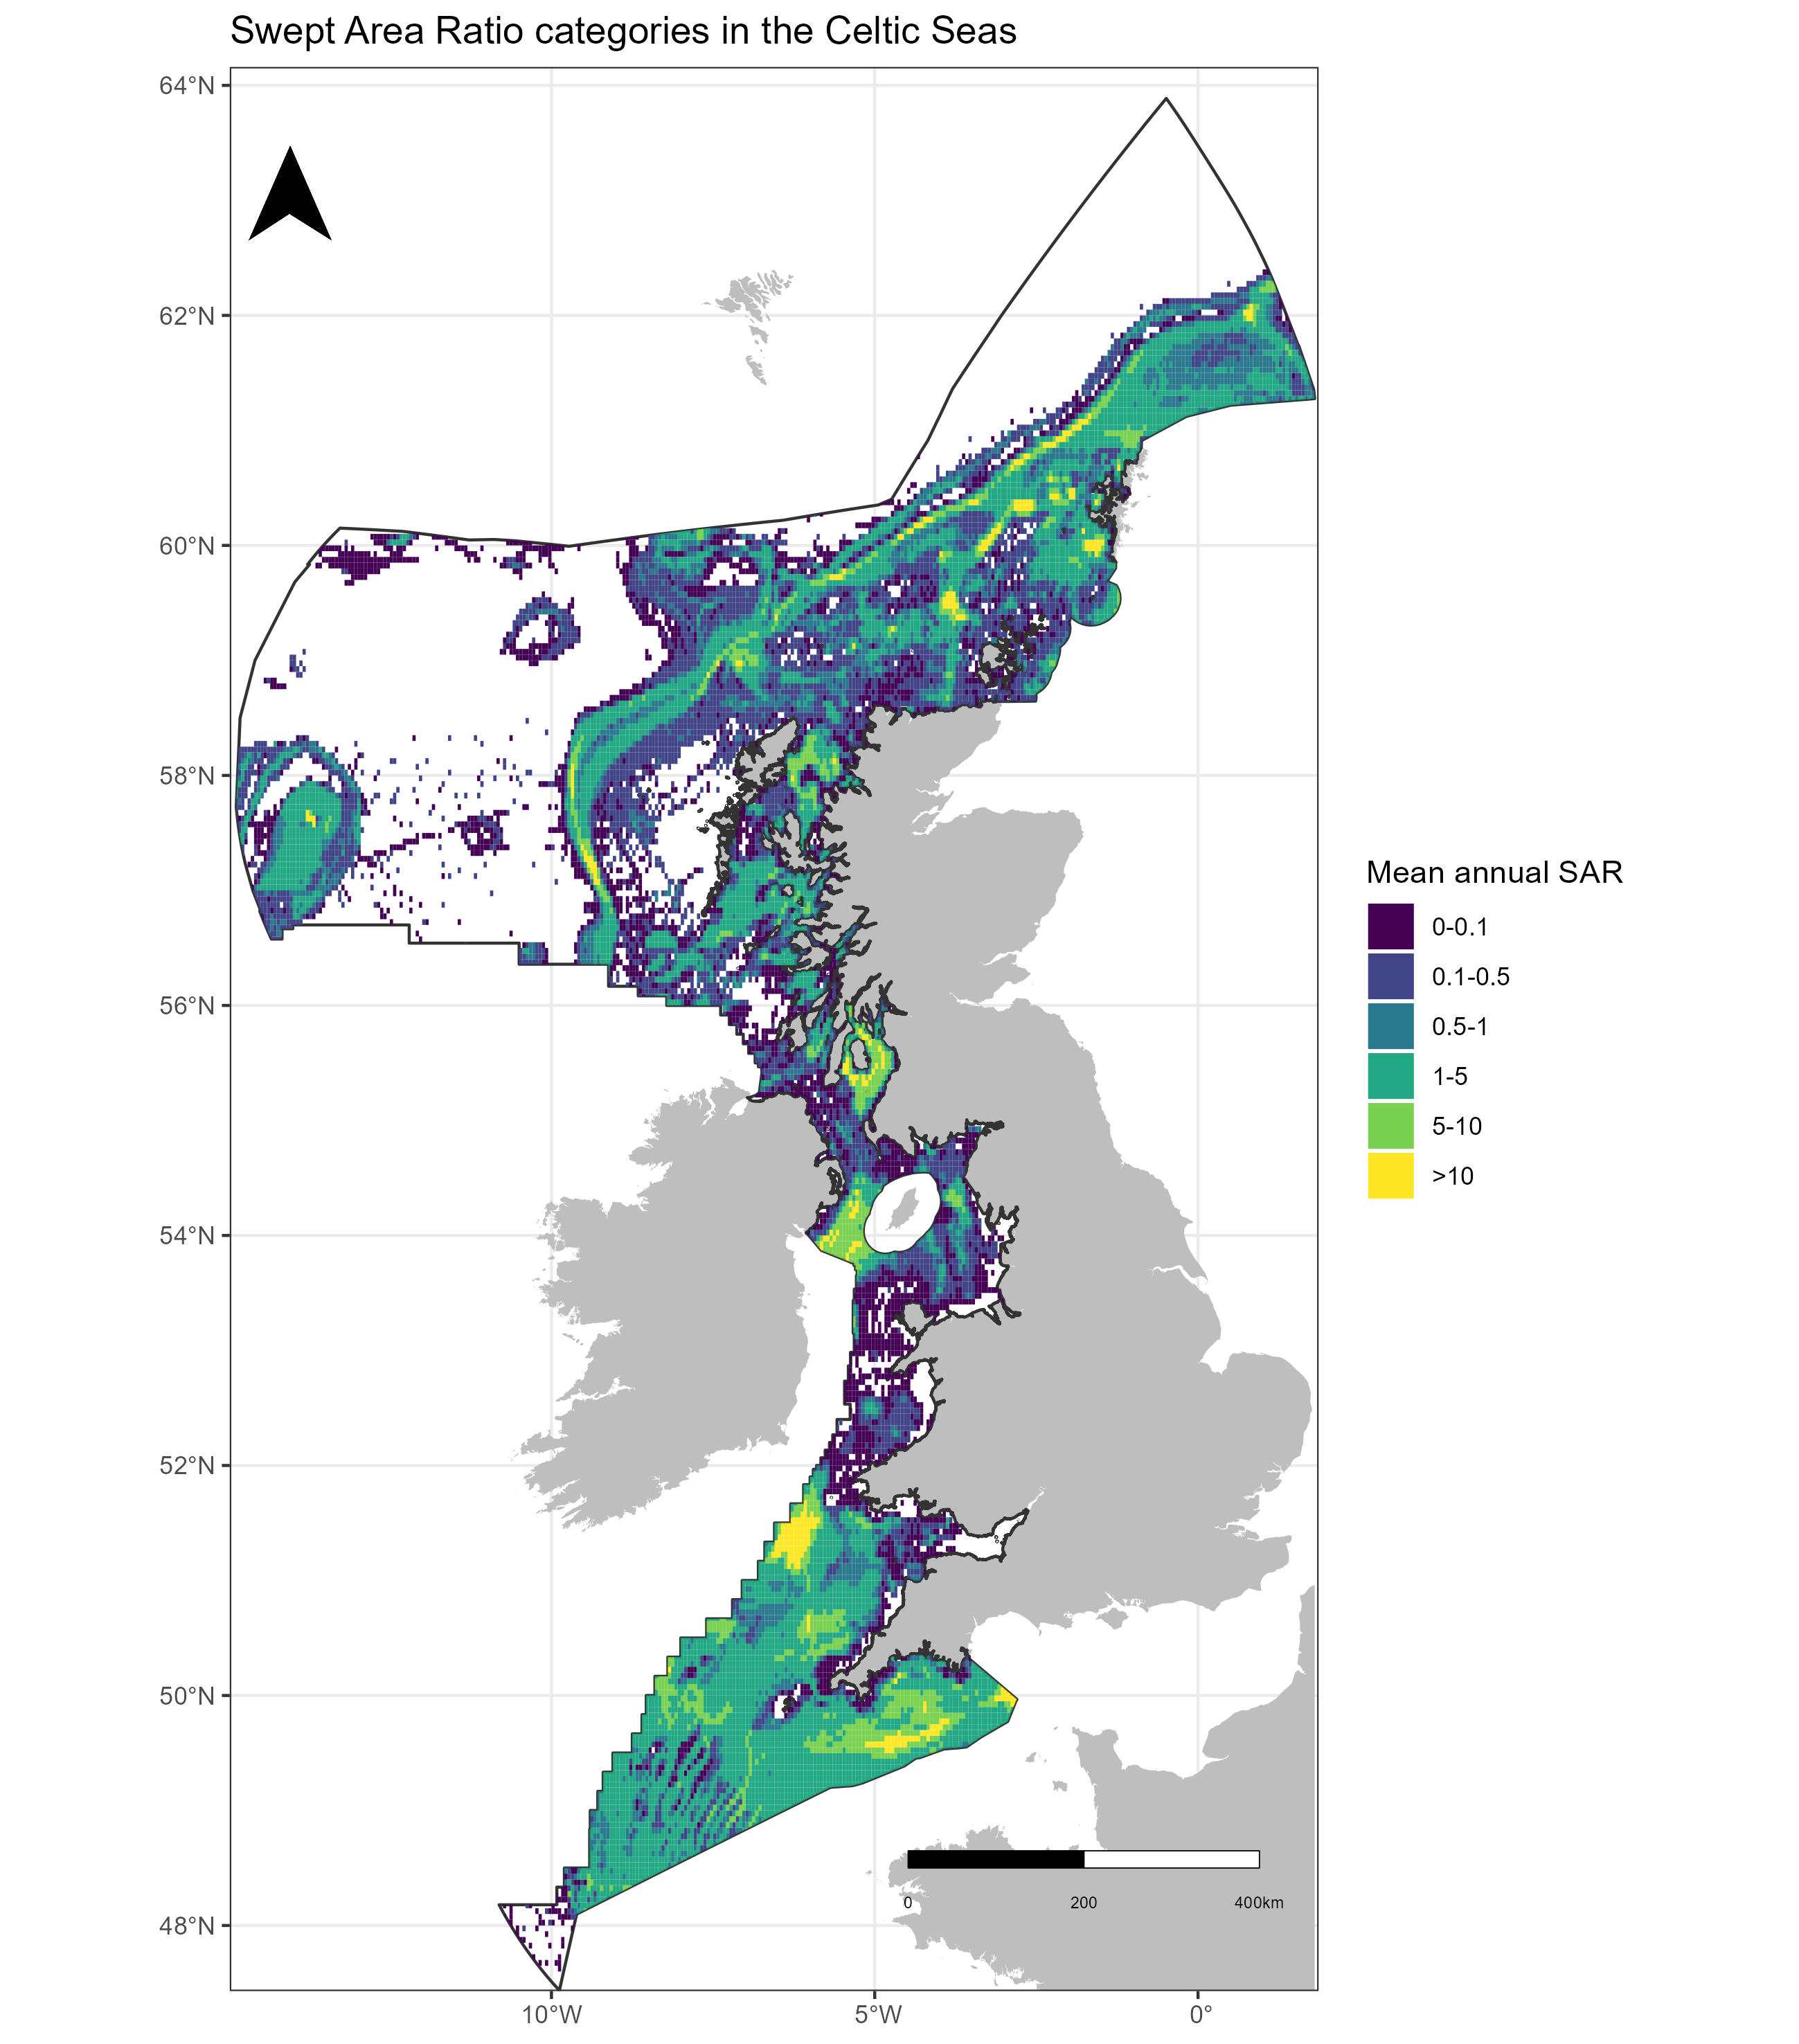
Figure 5. ICES c-square mean annual Swept Area Ratio (SAR) reported between 2009 to 2020. Source: ICES (2021).
Reference Margalef (Dref) was estimated for each combination of assessment unit and habitat type by taking percentile values from the set of observations (samples) available in low-pressure areas (SAR reported as ≤1). Van Loon and others (2018) demonstrated that the variable percentile method was effective in producing sufficiently reliable and useful estimates of reference values for broad scale habitats in the Southern North Sea assessment unit. The percentile value to be selected as the reference depends on the quality of the subset of samples in low-pressure area; in terms of number of samples, number of distinct years and intensity of fishing pressure, as detailed in Table 1.
Table 1. Quality coding used to select the percentile value to estimate reference Margalef diversity (Dref). Quality codes 1 to 3 are used to extract preliminary reference values.
|
Average SAR |
Samples (n) |
Years (n) |
Reference Percentile |
Quality Code |
|
0 - 0.1 |
≥50 |
≥3 |
75% |
1 |
|
≥30 |
≥2 |
95% |
2 |
|
|
≥20 |
1 |
99% |
3 |
|
|
≥10 & <20 |
- |
- |
4 |
|
|
<10 |
- |
- |
5 |
|
|
0.1 - 0.5 |
≥50 |
≥3 |
95% |
1 |
|
≥30 |
≥2 |
99% |
2 |
|
|
≥10 & <20 |
- |
- |
4 |
|
|
<10 |
- |
- |
5 |
|
|
0.5 - 1 |
≥50 |
≥3 |
99% |
1 |
|
>1 |
≥10 & <20 |
- |
- |
4 |
|
<10 |
- |
- |
5 |
The use of a percentile value for the estimation of Dref allows for the natural variability in benthic diversity, estimates of fishing pressure intensity, and the number of samples in the dataset. As a precautionary approach higher percentiles were used when there were less data available or for areas of higher estimated fishing pressure. Reference values are less precautionary when there were more data available from areas estimated to have low fishing pressure.
Depending on the data available, up to three Dref values can be obtained for a particular habitat type/ CP2 combination (one for each SAR category 0-0.1, SAR 0.1-0.5, SAR 0.5-1). In these instances, the highest value is taken as final Dref, as it better reflects the diversity levels that the habitat can reach in reference conditions.
In instances in which refence values could not be calculated for a habitat in a particular assessment unit, the average of reference values obtained for the same habitat type in other assessment units was used as Dref. This differs slightly to the approach taken in the OSPAR QSR 2023 for the Greater North Sea which had greater variation of Margalef diversity values between countries, OSPAR assessment units, and gear types (e.g., different monitoring protocols). For these reasons, instances where case specific Dref values were unavailable in the Greater North Sea, estimates were taken as the average of multiple sub-group averages, for example the average of gear specific averages for a country, OSPAR assessment unit, depth zone, and sediment type.
Not all habitats in the Celtic Seas had sufficient samples in areas of low fishing pressure: approximately 10% of the dataset represented habitats sampled which had no Dref in any assessment unit or when combing sampled habitats across all assessment unit. In these instances, Dref was estimated as the average of sub-group averages (assessment unit, depth zone, and sediment type).
Index Calculation
To calculate relative Margalef diversity (DM’), assessed sample Margalef diversity values (Dass) are normalised with reference diversity estimates (Dref):
The median of relative Margalef values for each assessment group (assessment unit, broad scale habitat, and assessment period) is calculated as the indicator of benthic habitat quality status. To avoid confusion with relative sample Margalef diversity (DM’), the term aggregated relative Margalef (DMagg) was used for median relative Margalef values.
Following the approach used for the QSR 2023 assessment of the Greater North Sea, the obtained median relative Margalef Diversity values were grouped into three broader categories as an initial indication of quality status:
-
relatively low diversity (DMagg <0.6)
-
relatively moderate diversity (DMagg ≥ 0.6 & <0.8)
-
relatively high diversity (DMagg ≥ 0.8)
Good Environmental Status
For reporting of the UK Marine Strategy Part 1 2024, the relative diversity categories applied in the QSR2023 were further grouped to identify Good Environmental Status (GES), using relative Margalef diversity = 0.6 as quality threshold between good/not good status
|
Relative Diversity Categories |
Environmental Status |
|
Relatively high diversity (DMagg ≥ 0.8) |
GOOD |
|
Relatively moderate diversity (DMagg ≥ 0.6 & < 0.8) |
|
|
Relatively low diversity (DMagg < 0.6) |
NOT GOOD |
Confidence
The confidence of the assessment results is limited to the available data within the assessment periods, defined as the number of samples for each assessment group and number of independent years sampled. The confidence in the estimation of ‘current status’ is lower if based on data from the earlier assessment period (Table 2).
Table 2: Confidence of current status of relative median Margalef diversity (DMagg). The confidence is reduced if the current status is based on data from the previous reporting cycle (2009-2015). Adapted from QSR 2023.
|
Assessment period |
Samples (n) |
Years (n) |
Confidence |
|
2016 to 2021 |
≥50 |
≥3 |
High |
|
≥30 |
≥2 |
Good |
|
|
≥20 |
1 |
Sufficient |
|
|
≥10 & <20 |
1 |
Low |
|
|
<10 |
1 |
Poor |
|
|
2009 to 2015 |
≥50 |
≥3 |
Good |
|
≥30 |
≥2 |
Sufficient |
|
|
≥20 |
1 |
Low |
|
|
<20 |
1 |
Poor |
Spatial Representativity
The BH2b CEMP guidelines suggest that confidence in the results should reflect also the spatial representativity of the data, defined by estimating the percentage of area covered by the benthic monitoring programme compared to the total area of the habitat assessed (considering a sample as representative for approximately the area of one c-square). Samples representative of between 25% and 75% of habitat area should have confidence reduced by one level (i.e., from ‘Good’ to ‘Sufficient’), samples representative of less than 25% area should have confidence reduced by two levels.
The method to calculate spatial representativity of the data was not fully developed at the time of the assessment (Wijnhoven and others, 2023). For this reason, spatial representativity of the data was not considered for the calculation of confidence in this pilot assessment. However, a rough estimation of the spatial coverage for each broad scale habitat was trialled.
The method proposed in the QSR 2023, based on the conversion of samples to a c-square areas, was tested but the obtained results were considered too inaccurate, therefore an alternative method was applied for this pilot.
For each broad scale habitat, the coverage of monitoring data available for the two assessment periods (2009-2015 and 2016-2021), was obtained by applying a 2 Km buffer around sample points. The resulting area was then converted to a percentage of the total broad scale habitat extent obtained from the habitat map.
There were some limitations associated to this approach to evaluate spatial representativity of monitoring data:
-
Sample habitat classification does not always spatially align with the habitat information given in the habitat map.
-
Some habitat types might be underrepresented in the habitat map, e.g., mixed sediments.
-
Habitat extent might be mosaiced or patchwork in extent.
The estimation of spatial representativity was not used to adjust the confidence in the assessment but used to provide additional information to interpret the assessment results.
Differences Between Assessment Periods
For an indication of temporal changes between the 2009-2015 and 2016-2021 periods the aggregated relative Margalef values (DMagg) were tested for significant differences. For the Celtic Seas assessment DM’ values did not meet the criteria for a two-sided independent t-test suggested by the CEMP guidelines, specifically normal distribution, and equal variances of the two groups. Alternatively, the medians were compared using the Mann-Whitney U test (also known as the Wilcoxon rank-sum test). This non-parametric test allows the comparison of two independent groups without assuming normality or equal observation sizes. Significant differences between the 2009-2015 and 2016-2021 period are indicated as either an increase or decrease of DMagg (p < 0.05). However, values of DMagg and their comparisons between periods, habitats, and assessment units should be considered within the limitations of the available data and their spatial distribution.
Results
UKMS assessment for the Relative Margalef diversity index in the Celtic Seas
The evaluation of the condition of benthic communities is based on assessments with a confidence level of ‘sufficient’ or higher. Where possible, habitat assessments are based on data collected in the last reporting period (2016-2021). However, data from 2009-2015 are used in the absence of more recent data or if there is poor/low confidence in the 2016-2021 results.
Assessments associated to poor/low confidence are presented in ‘Further information’ below. It should be noted that all results do not represent the condition of the individual habitats in their full extent, but only reflect the biodiversity observed in the habitat extent covered by available monitoring data.
The condition of benthic habitats in the Celtic Sea
“Condition of the benthic community (including biotic and abiotic structure and functions) at risk from physical disturbance is stable or recovering. There should be no adverse impacts through changes in species composition and their relative abundance by physical disturbance.” (adapted from UK Marine Strategy 2019)
When considering only the assessments associated to sufficient or higher confidence, Good Environmental Status (GES) was achieved in 32% of the cases and not achieved in 68% of the cases. 16 out of a total of 44 assessments were associated to poor or low confidence levels and not used to inform GES.
Most of the assessments for which there is sufficient or higher confidence are based on data from 2009-2015, highlighting a decrease in monitoring data suitable for this type of assessment in the last 2016-2023 period.
GES has been achieved for the following habitats:
-
Circalittoral coarse sediment (Minches & Western Scotland)
-
Infralittoral sand (Irish Sea)
-
Circalittoral mixed sediment (Irish Sea)
-
Circalittoral mud (Irish Sea)
-
Offshore circalittoral mixed sediment (Irish Sea)
-
Offshore circalittoral coarse sediment and/or Offshore circalittoral mixed sediment (Irish Sea)
-
Infralittoral sand (Western Channel & Celtic Sea)
-
Circalittoral mixed sediment (Western Channel & Celtic Sea)
-
Circalittoral mud (Western Channel & Celtic Sea)
The good environmental status observed on circalittoral mud should be considered with caution given the caveats associated with the reference values estimated for this habitat type. Results for this habitat might be affected by the fact that reference values had to be estimated from samples with fishing pressure information, which was limited in coastal areas, potentially underestimating reference diversity (see Further information for details).
Achievement of GES was based using a value of relative diversity of 0.6 as threshold. This value was proposed in the QSR2023 as a boundary between high and moderate diversity and was derived from the exponentially decreasing relationship between normalized Margalef diversity and fishing activity observed in van Loon and others (2018). It should be noted, however, that the 0.6 threshold might be revised in future assessments as further evidence and testing of pressure state relationships become available.
Table 3 BH2b results for Celtic Seas. Assessments based on 2016-2021 data are highlighted in bold. Results refer only to the habitat area covered by the monitoring data (not the full habitat extent). The proportion of habitat extent covered by monitoring data is reported in the column “monitored habitat extent”. For each broadscale habitat is reported the relative diversity category (in upper cases), the confidence level in the assessment and the differences in relative diversity between the two assessment periods (2009-2015 and 2016-2021). Relative diversity categories and differences are reported only for assessments that have ‘Sufficient’ or higher confidence using the most recent data available. Significant differences in the median relative Margalef diversity between assessment periods (2009-2015 and 2016-2021) indicated by arrows: ↗ (2016-2021 DMagg higher than 2009-2015), ↘ (2016-2021 DMagg lower than 2009-2015), ↔ = no significant difference between assessment periods, and arrows in parentheses indicate less than ‘Sufficient’ confidence in at least one assessment period. Confidence level is estimated using the method detailed in Table 2. Spatial representativity of the data was not considered for the confidence assessment as the method was not fully developed at the time of assessment.
|
Good Environmental Status achieved (DMagg ≥ 0.6) |
|
Good Environmental Status not achieved (DMagg <0.6) |
|
Poor/Low confidence in the assessment |
| Scottish Continental Shelf | Minches & Western Scotland | Irish Sea | Western Channel & Celtic Sea | |||||||||||||
| Broad-scale habitat | Monitored Habitat extent | Status | Confidence | Realtive Diversity Change | Monitored Habitat extent | Status | Confidence | Realtive Diversity Change | Monitored Habitat extent | Status | Confidence | Realtive Diversity Change | Monitored Habitat extent | Status | Confidence | Realtive Diversity Change |
| Infralittoral coarse sediment | n/a | n/a | n/a | n/a | 47.50% | NOT GOOD | high | ↔ | 20.40% | confidence low or poor | >100% | NOT GOOD | sufficient | n/a | ||
| Infralittoral mixed sediment | n/a | n/a | n/a | n/a | 74.80% | confidence low or poor | >100% | NOT GOOD | sufficient | n/a | >100% | NOT GOOD | sufficient | (↗) | ||
| Infralittoral sand | 24.40% | confidence low or poor | 34.20% | confidence low or poor | 26.00% | GOOD | good | ↗ | >100% | GOOD | good | n.a. | ||||
| Infralittoral mud | n/a | n/a | n/a | n/a | 52.40% | confidence low or poor | 13.20% | confidence low or poor | 16.50% | confidence low or poor | ||||||
| Circalittoral coarse sediment | 5.60% | confidence low or poor | 3.90% | GOOD | high | ↗ | 16.50% | NOT GOOD | good | (↗) | 3.50% | NOT GOOD | sufficient | ↘ | ||
| Circalittoral mixed sediment | n/a | n/a | n/a | n/a | 12.30% | confidence low or poor | 49.80% | GOOD | good | ↔ | >100% | GOOD | good | ↔ | ||
| Circalittoral sand | n/a | n/a | n/a | n/a | 4.60% | confidence low or poor | 11.70% | NOT GOOD | good | ↔ | 5.50% | NOT GOOD | good | ↘ | ||
| Circalittoral mud | n/a | n/a | n/a | n/a | 22.30% | NOT GOOD | good | n/a | 52.90% | GOOD | good | ↔ | >100% | GOOD | good | ↔ |
| Offshore circalittoral coarse sediment | 0.20% | confidence low or poor | 1.50% | confidence low or poor | 10.10% | NOT GOOD | good | (↗) | 4.40% | NOT GOOD | good | n/a | ||||
| Offshore circalittoral mixed sediment | 53.50% | confidence low or poor | 6.20% | confidence low or poor | 32.40% | GOOD | good | n/a | 46.20% | NOT GOOD | good | n/a | ||||
| Offshore circalittoral coarse sediment and/or Offshore circalittoral mixed sediment | n/a | n/a | n/a | n/a | n/a | n/a | n/a | 99.20% | GOOD | good | n/a | 74.40% | confidence low or poor | |||
| Offshore circalittoral sand | 0.90% | NOT GOOD | good | n/a | 6.50% | NOT GOOD | good | (↗) | 27.10% | NOT GOOD | good | ↔ | 6.50% | NOT GOOD | good | n/a |
| Offshore circalittoral mud | 0.70% | confidence low or poor | 16.80% | NOT GOOD | good | n/a | 22.20% | NOT GOOD | good | n/a | 8.20% | NOT GOOD | good | n/a | ||
Changes in condition since the previous assessment period
Where differences in median relative diversity (DMagg) could be tested, these mostly showed non-significant changes between the two reporting periods 2009-2015 and 20016-2021.
A significant increase in median Relative Margalef Diversity values between 2009-2015 and 2016-2021 was observed in the Minches & Western Scotland for circalittoral coarse sediment and offshore circalittoral sand. In the Irish Sea, significant increases were observed for infralittoral sand, circalittoral coarse and offshore circalittoral coarse sediments. In the Western Channel & Celtic Sea, an increase was observed only for infralittoral mixed sediments, whilst the diversity decreased for circalittoral coarse sediments and circalittoral sand (Table 3).
Further information
To calculate the Relative Margalef diversity index, reference Margalef (Dref) were initially defined for each assessment unit and habitat type combination. Reference Margalef values obtained are displayed in Table 4:
-
Values not in parentheses show reference estimates calculated using habitat data collected in the same assessment unit. A total of twenty-one reference estimates could be calculated using assessment unit specific habitat data, the majority of which were present in the Irish Sea. The Scottish Continental Shelf had the lowest proportion of assessment unit specific reference estimations, with only one value obtained using data from the same assessment unit.
-
Values in parentheses show reference estimates calculated using habitat data collected in different assessment units, as available data did not meet the minimum quality criteria defined in Table 1. A total of twenty-tree reference estimates had to be calculated using data from different assessment units.
For Offshore circalittoral mud, there were no assessment units in which available sample data met the minimum quality criteria for the calculation of reference estimates. In this instance, Dref estimates were calculated on the average of Dref subgroup diversity results (assessment unit, depth zone, and sediment type).
For example, reference values of Offshore circalittoral mud in the Irish Sea were estimated by averaging reference values of these groups:
-
Irish Sea CP2 region (13.2)
-
Offshore circalittoral (15.5)
-
Mud (8.9)
Obtaining a Dref value of 12.5 ((13.2 + 15.5 + 8.9)/3)
Table 4. Reference Margalef (Dref) for Broad Scale Habitats and assessment unit. Numbers between parenthesis identify cases in which Dref were calculated from averages, either from broad scale habitats in other assessment units or a combination of the subgroup averages (assessment unit, depth zone, and sediment type).
|
Broad scale habitat |
Scottish Continental Shelf |
Minches & Western Scotland |
Irish Sea |
Western Channel & Celtic Sea |
|
Infralittoral coarse sediment |
- |
14.2 |
(14.2) |
(14.2) |
|
Infralittoral mixed sediment |
- |
(19.6) |
19.6 |
(19.6) |
|
Infralittoral sand |
(6.2) |
(6.2) |
6.7 |
5.7 |
|
Infralittoral mud |
- |
(10.1) |
10.1 |
(10.1) |
|
Circalittoral coarse sediment |
(16) |
16.9 |
18.9 |
12.1 |
|
Circalittoral mixed sediment |
- |
(11.7) |
12.8 |
10.6 |
|
Circalittoral sand |
- |
(10.1) |
10.7 |
9.5 |
|
Circalittoral mud |
- |
(7.6) |
7.6 |
(7.6) |
|
Offshore circalittoral coarse sediment |
(18.7) |
(18.7) |
13.4 |
23.9 |
|
Offshore circalittoral mixed sediment |
18.1 |
(17) |
15.9 |
(17) |
|
Offshore circalittoral coarse sediment and/or Offshore circalittoral mixed sediment |
- |
- |
17.3 |
(17.3) |
|
Offshore circalittoral sand |
(11.9) |
14 |
11.9 |
9.7 |
|
Offshore circalittoral mud |
(14.2) |
(13.1) |
(12.5) |
(12.1) |
Sample Margalef diversity values (DM’) across the pressure categories were investigated alongside estimated reference Margalef values (Dref). The distribution of Margalef diversity values in each pressure category are summarised in box plots for each assessment period, broad scale habitat, and assessment unit.
A large proportion of relative Margalef diversity values (DM’) at sample level were below 0.6, which is the cut-off between the diversity categories ‘moderate’ and ‘low’ (Figure 6).
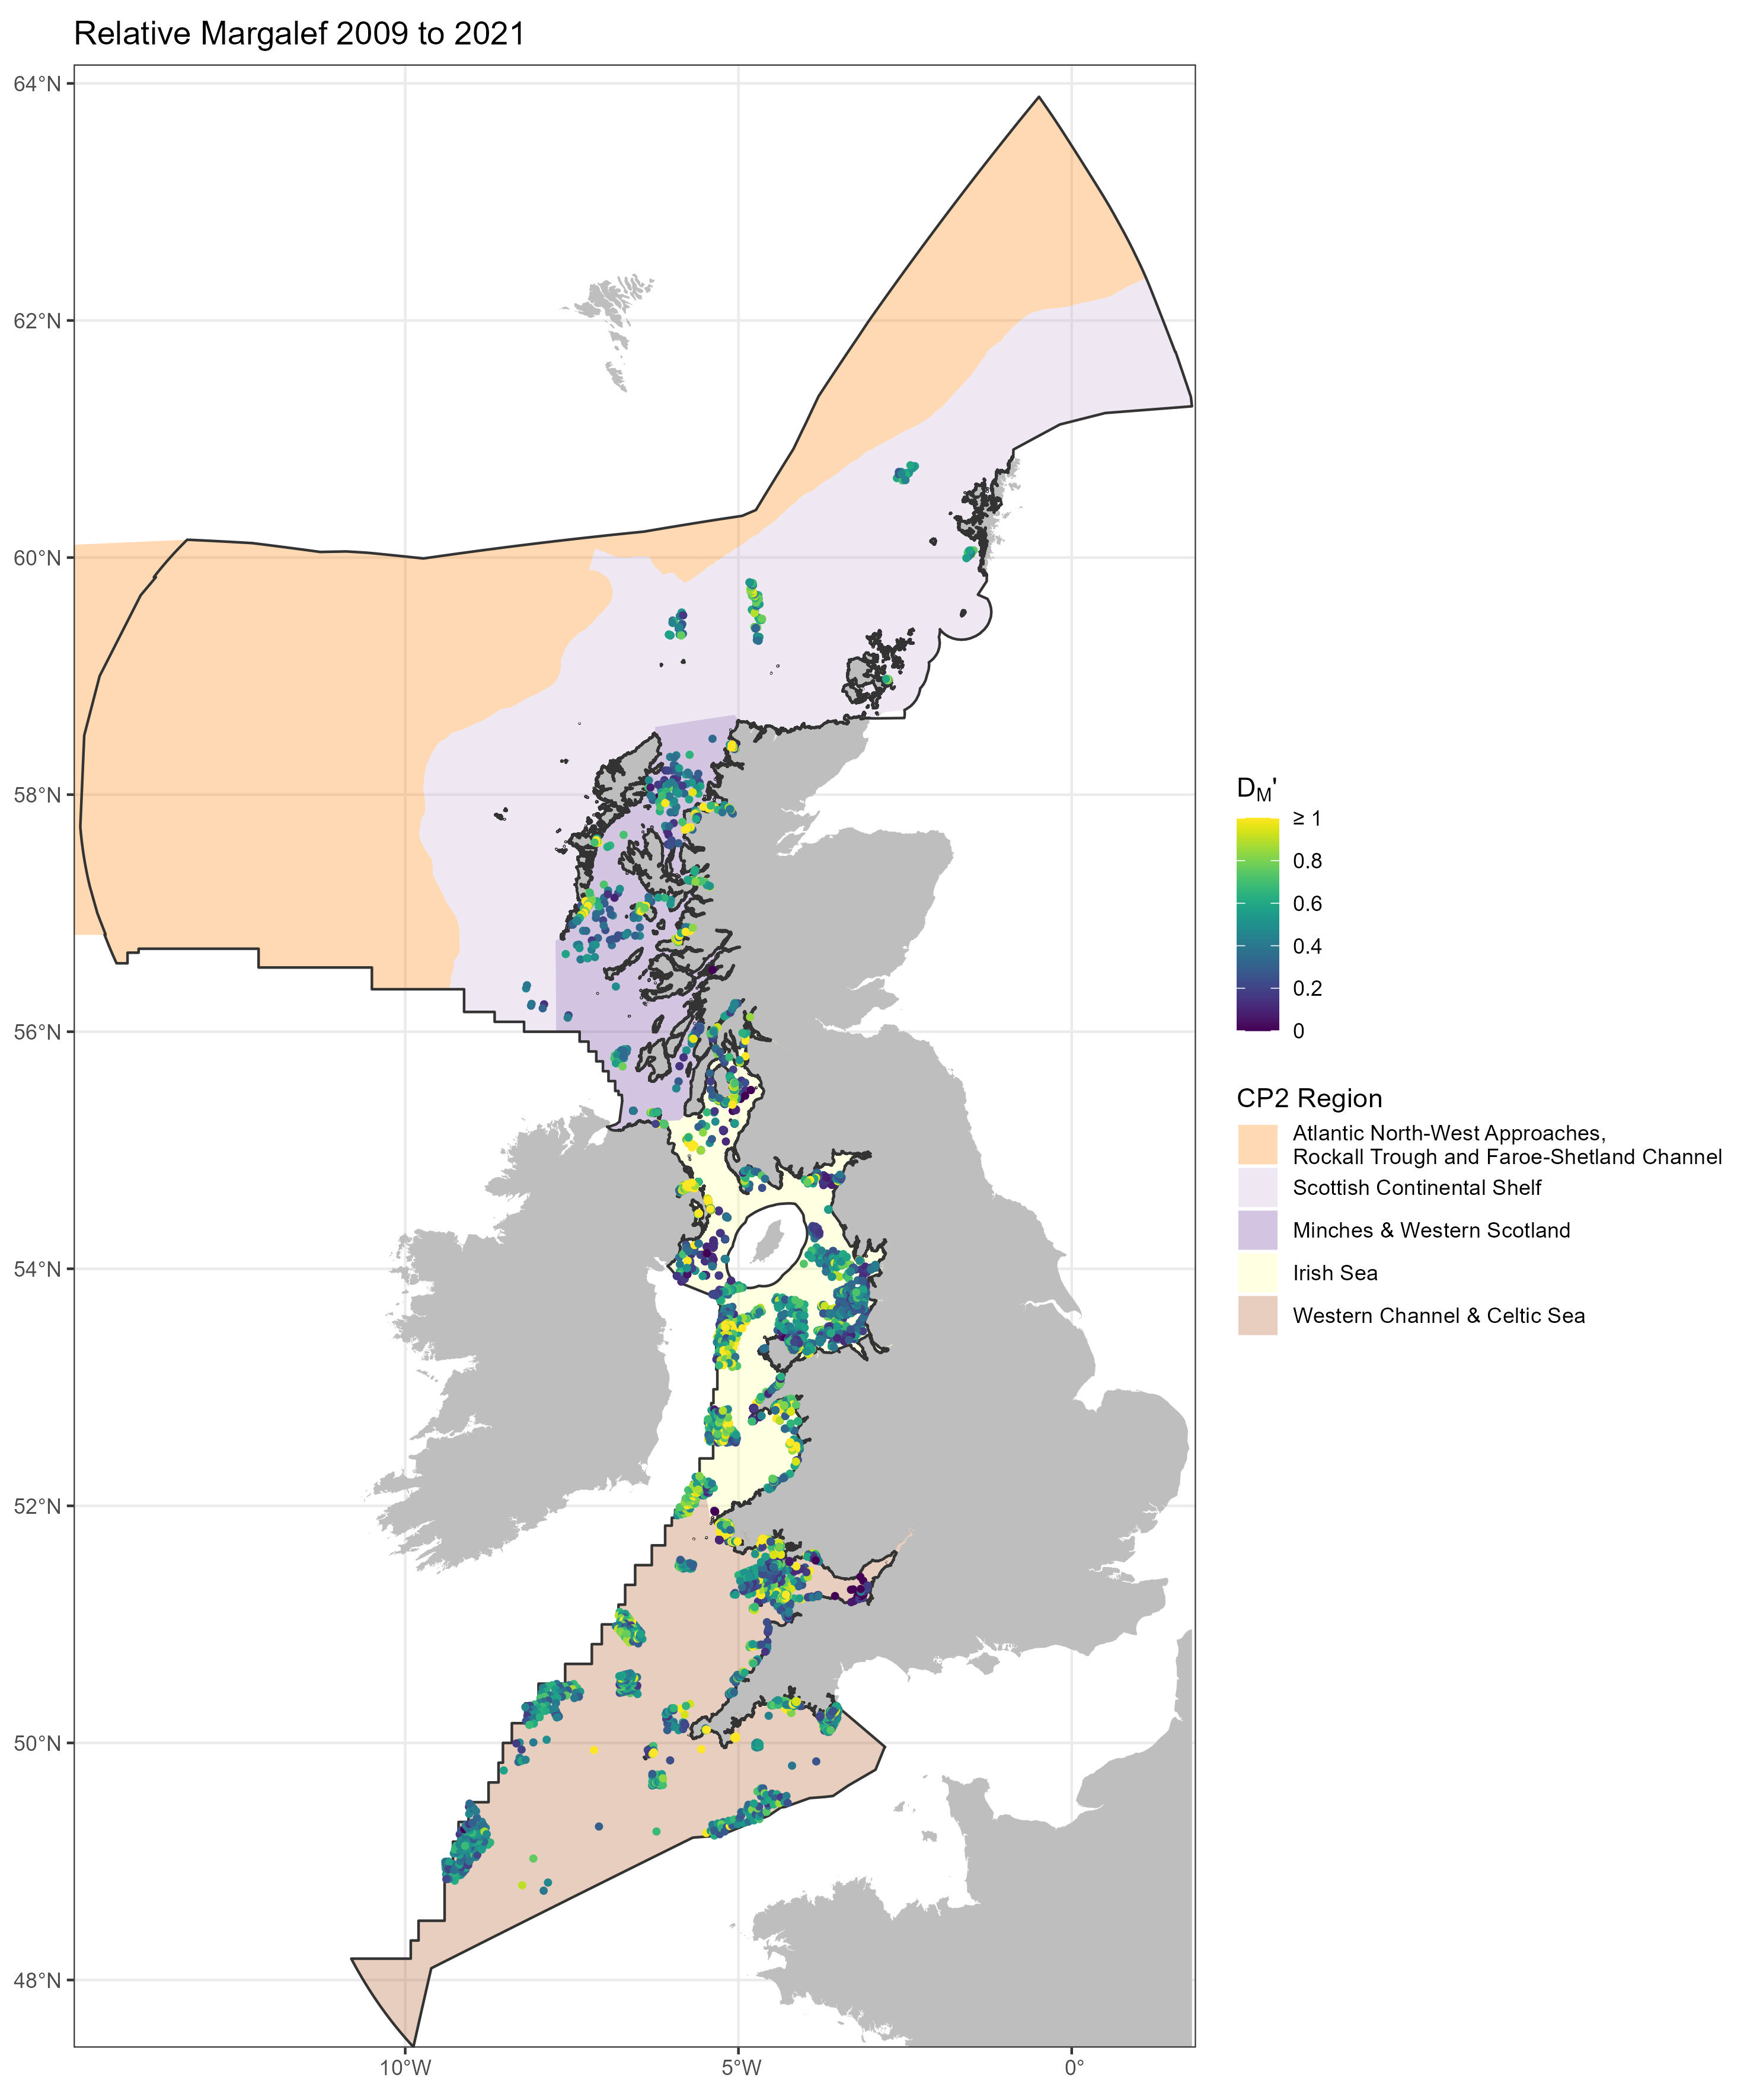
Figure 6. Relative Margalef Diversity (DM') of samples in the Celtic Seas UKMS sub-region.
Monitoring data collected between 2016 and 2021 were limited for most broad scale habitats, impairing the possibility to statistically calculate differences in relative diversity between assessment periods. Where differences in median relative diversity could be tested, these mostly showed non-significant changes between the two reporting periods, although some habitat types improved in the Minches & Western Scotland and in the Irish Sea (Table 5). Improvements in diversity should however be interpreted with caution, given that for most of the improving habitats there were limited data available for the period 2016-2021.
Table 5. Summary of observed changes in the habitat median relative diversity between the two reporting periods 9009-2015 and 2016-2021. Note that the number of habitat types assessed is not the same in all the assessment units. ↗ = significant increase, ↘ = significant decrease, ↔ = no significant difference, n/a = not assessed.
|
Change in Relative Diversity between 2009-2015 and 2016-2021 |
Scottish Continental Shelf |
Minches & Western Scotland |
Irish Sea |
Western Channel & Celtic Sea |
|
↔ |
0 |
3 |
7 |
2 |
|
↗ |
0 |
2 |
3 |
2 |
|
↘ |
0 |
0 |
0 |
2 |
|
n/a |
6 |
7 |
3 |
7 |
|
Number of habitat types assessed |
6 |
12 |
13 |
13 |
Confidence:
Sixteen out of 44 assessments (36%) were associated to low or poor confidence. In the Scottish Continental Shelf only one habitat could be assessed with good confidence, whilst all the other assessments had either low or poor confidence. This assessment unit also had the lower number of habitats assessed. The Irish Sea and the Western Channel & Celtic Sea had the highest proportions of assessments with sufficient or higher confidence (Table 3).
It should be stressed that most of the assessments were based on data collected during the 2009-2015 period due to the lack of available sample data from 2016 onwards.
Only two habitats could be assessed with high confidence with data collected during 2016-2021: infralittoral coarse sediment and circalittoral coarse sediment, both within the Minches & Western Scotland assessment unit (Table 3).
Spatial Representation
Spatial representativity of monitoring data was estimated as a proportion of habitat extent covered by sample points applying a buffer distance of 2km around data point. Estimates of the spatial coverage of sample data varied widely between broad scale habitat types and assessment units. In some cases, the method employed could be seen to overestimate sample coverage of some broad scale habitats, particularly infralittoral habitats. Due to the inherent limitations in the methodology applied, the percentage values obtained should not be considered as exact representation of the habitat area covered by monitoring data, but rather a way to highlight and compare differences in the spatial representativity of available data among habitat types and reporting periods.
The estimated spatial representativity of available data is generally higher for 2009-2015 than 2016-2021, highlighting a reduction in data available for the 2016-2021 assessment.
Scottish Continental Shelf
Assessment results of relative Margalef diversity for the Scottish Continental Shelf assessment unit were only available prior to 2016 with less than 50 samples available in the majority of the habitat assessed (Table 6).
The only assessment associated to good confidence was for the offshore circalittoral sand, that resulted having low diversity. GES was therefore not achieved for this habitat type.
The assessments of all the other habitat types were associated to low or poor confidence.
The spatial representativity of monitoring data in this region is very limited, with various habitat types covered by less than 1% of their estimated extent. Offshore circalittoral mixed sediments were the habitats with better spatial representation, with roughly 50% of their estimated extent covered by monitoring data (Table 6).
All sample data available in the Scottish Continental Shelf assessment unit were collected between 2010 and 2012, with few samples representing the relatively large assessment unit.
Table 6: Median relative broad scale habitat diversity values (DMagg) with associated Relative diversity category in the Scottish Continental Shelf assessment unit for the two reporting periods 2009-2015 and 2016-2021. Diversity categories are reported as high(green), moderate (orange), low (red). Confidence level and number of samples available is also provided for each assessment. Assessments associated to “poor” or “low” confidence levels are greyed out. n/a = not assessed. Results refer only to the habitat area covered by the monitoring data (not the full habitat extent). The proportion of habitat extent covered by monitoring data is reported in the column “monitored habitat extent”. Habitat Status as GES (using the quality threshold DMagg = 0.6) is reported based on the most recent assessment associated to sufficient or higher confidence.
|
Scottish Continental Shelf |
||||||||
|
Broad scale habitat |
2009-2015 |
2016-2021 |
Relative Diversity Difference |
Habitat Status (GES) |
||||
|
Monitored Habitat extent |
DMagg (Relative Diversity category) |
Confidence level (sample No.) |
Monitored Habitat extent |
DMagg (Relative Diversity category) |
Confidence level (sample No.) |
|||
|
Infralittoral sand |
24.40% |
1.15 (HIGH) |
Poor (1) |
n/a |
No data |
No data |
n/a |
n/a |
|
Circalittoral coarse sediment |
5.60% |
0.55 (LOW) |
Low (31) |
n/a |
No data |
No data |
n/a |
n/a |
|
Offshore circalittoral coarse sediment |
0.20% |
0.3 (LOW) |
Poor (7) |
n/a |
No data |
No data |
n/a |
n/a |
|
Offshore circalittoral mixed sediment |
53.50% |
0.57 (LOW) |
Low (102) |
n/a |
No data |
No data |
n/a |
n/a |
|
Offshore circalittoral sand |
0.90% |
0.57 (LOW) |
Good (59) |
n/a |
No data |
No data |
n/a |
NOT GOOD |
|
Offshore circalittoral mud |
0.70% |
0.45 (LOW) |
Poor (1) |
n/a |
No data |
No data |
n/a |
n/a |
Minches & Western Scotland
In the Minches & Western Scotland assessment unit, 10 out of 17 assessments have poor or low confidence. GES was achieved for circalittoral coarse sediment and not achieved for all the other habitats.
Assessments with confidence level “sufficient” or higher for the period 2016-2021 were available for two habitat types:
-
Infralittoral coarse sediment diversity decreased from moderate to low between the two reporting periods (2009-2015 and 2016-2021), although such decrease was not significant.
-
Circalittoral coarse sediments diversity increased from low to moderate between the two reporting periods.
Circalittoral mud, offshore circalittoral sand and offshore circalittoral mud were assessed with good confidence using data collected during 2009-2015 and all resulted with low diversity.
More recent data collected during 2016-2021 were available for offshore circalittoral sand and suggest an increase in diversity from low to moderate, although the assessment for the 2016-2021 has low confidence.
Samples collected in the 2009-2015 assessment period are distributed reasonably well across the assessment unit. However, samples collected between 2016 and 2021 are almost entirely restricted to the coastal regions of Skye and South Uist. Spatial representativity of monitoring data varies greatly across habitat types, with many circalittoral sediment types sampled in less than 10% of their extent (Table 7).
Table 7: Median relative broad scale habitat diversity values (DMagg) with associated Relative diversity category in the Minches & Western Scotland assessment unit assessment unit for the two reporting periods 2009-2015 and 2016-2021. Diversity categories are reported as high(green), moderate (orange), low (red). Confidence level and number of samples available is also provided for each assessment. Assessments associated to ‘poor’ or ‘low’ confidence levels are greyed out. Difference in the DMagg values between the two assessment periods are indicated by arrows: ↗ = significant increase, ↘ = significant decrease, ↔ = no significant difference, n/a = not assessed. Arrows in parentheses indicate less than ‘Sufficient’ confidence in at least one assessment period. Results refer only to the habitat area covered by the monitoring data (not the full habitat extent). The proportion of habitat extent covered by monitoring data is reported in the column ‘monitored habitat extent’. Habitat Status as GES (using the quality threshold DMagg = 0.6) is reported based on the most recent assessment associated to sufficient or higher confidence.
|
Minches & Western Scotland |
||||||||
|
Broad scale habitat |
2009-2015 |
2016-2021 |
Relative Diversity Difference |
Habitat Status (GES) |
||||
|
Monitored Habitat extent |
DMagg (Relative Diversity category) |
Confidence level (sample No.) |
Monitored Habitat extent |
DMagg (Relative Diversity category) |
Confidence level (sample No.) |
|||
|
Infralittoral coarse sediment |
49.70% |
0.61 (MODERATE) |
Sufficient (34) |
47.50% |
0.48 (LOW) |
High (50) |
↔ |
NOT GOOD |
|
Infralittoral mixed sediment |
74.80% |
0.5 (LOW) |
Poor (12) |
54.40% |
0.53 (LOW) |
Low (17) |
↔ |
n/a |
|
Infralittoral sand |
34.20% |
1.35 (HIGH) |
Poor (12) |
|
No data |
No data |
n/a |
n/a |
|
Infralittoral mud |
52.40% |
0.44 (LOW) |
Low (26) |
|
No data |
No data |
n/a |
n/a |
|
Circalittoral coarse sediment |
8.20% |
0.48 (LOW) |
Good (74) |
3.90% |
0.66 (MODERATE) |
High (66) |
↗ |
GOOD |
|
Circalittoral mixed sediment |
36.20% |
0.88 (HIGH) |
Poor (15) |
12.30% |
0.63 (MODERATE) |
Low (10) |
↔ |
n/a |
|
Circalittoral sand |
4.60% |
0.79 (MODERATE) |
Poor (11) |
|
No data |
No data |
n/a |
n/a |
|
Circalittoral mud |
22.30% |
0.59 (LOW) |
Good (94) |
|
No data |
No data |
n/a |
NOT GOOD |
|
Offshore circalittoral coarse sediment |
1.50% |
0.63 (MODERATE) |
Poor (11) |
|
No data |
No data |
n/a |
n/a |
|
Offshore circalittoral mixed sediment |
6.20% |
0.69 (MODERATE) |
Poor (12) |
|
No data |
No data |
n/a |
n/a |
|
Offshore circalittoral sand |
6.50% |
0.48 (LOW) |
Good (50) |
0.30% |
0.74 (MODERATE) |
Low (15) |
(↗) |
NOT GOOD |
|
Offshore circalittoral mud |
16.80% |
0.36 (LOW) |
Good (119) |
|
No data |
No data |
n/a |
NOT GOOD |
Irish Sea
GES was achieved for infralittoral sand, circalittoral mixed sediment, circalittoral mud, offshore circalittoral mixed sediment and for the habitat mosaic ‘Offshore circalittoral coarse sediment and/or Offshore circalittoral mixed sediment’.
In the Irish Sea most of the assessments conducted on data collected in 2016-2021 were associated with poor or low confidence.
Only two assessments were associated to good confidence level:
-
Infralittoral sand: this habitat showed high diversity in 2016-2021, with a significant improvement from the previous reporting cycle.
-
Circalittoral sand: the habitat showed low diversity in 2016-2021 with no significant changes observed from the previous reporting cycle.
Habitat condition was therefore mainly assessed using data from 2009-2015. In this reporting period the number of samples available for the different habitat types are generally high and consequently the confidence in the assessment is considered good.
-
Moderate diversity was observed for: Circalittoral mixed sediment, circalittoral mud, offshore circalittoral mixed sediment and the mosaic “Offshore circalittoral coarse sediment and/or Offshore circalittoral mixed sediment”.
-
Low diversity was observed for: infralittoral mixed sediments, circalittoral coarse sediment, circalittoral sand, offshore circalittoral coarse sediment, offshore circalittoral sand and mud.
The diversity in the habitat types assessed in the Irish Sea did not significantly change from 2009-2015 to 2016-2021 although in some significant increases have been observed.
Samples collected in the 2009-2015 assessment period were distributed reasonably well across the Irish Sea for most habitats. The Irish Sea in the 2009-2015 assessment period was considered to have the most comprehensive distribution of sample locations across different broad scale habitats of all assessment regions and periods.
Samples collected between 2016 and 2021 were restricted to coastal areas and have more limited spatial representativity, generally covering less than 20% of estimated habitat extent (Table 8). Consequently, results from this assessment period are not likely to represent the broad scale habitats distributed across the entire assessment unit.
Table 8: Median relative broad scale habitat diversity values (DMagg) with associated Relative diversity category in the Irish Sea assessment unit assessment unit for the two reporting periods 2009-2015 and 2016-2021. Diversity categories are reported as high(green), moderate (orange), low (red). Confidence level and number of samples available is also provided for each assessment. Assessments associated to ‘poor’ or ‘low’ confidence levels are greyed out. Difference in the DMagg values between the two assessment periods are indicated by arrows: ↗ = significant increase, ↘ = significant decrease, ↔ = no significant difference, n/a = not assessed. Arrows in parentheses indicate less than ‘Sufficient’ confidence in at least one assessment period. Results refer only to the habitat area covered by the monitoring data (not the full habitat extent). The proportion of habitat extent covered by monitoring data is reported in the column ‘monitored habitat extent’. Habitat Status as GES (using the quality threshold DMagg = 0.6) is reported based on the most recent assessment associated to sufficient or higher confidence.
|
Irish Sea |
||||||||
|
Broad scale habitat |
2009-2015 |
2016-2021 |
Relative Diversity Difference |
Habitat Status (GES) |
||||
|
Monitored Habitat extent |
DMagg (Relative Diversity category) |
Confidence level (sample No.) |
Monitored Habitat extent |
DMagg (Relative Diversity category) |
Confidence level (sample No.) |
|||
|
Infralittoral coarse sediment |
43.90% |
0.31 (LOW) |
Low (20) |
20.40% |
0.33 (LOW) |
Poor (9) |
↔ |
n/a |
|
Infralittoral mixed sediment |
>100% |
0.49 (LOW) |
Sufficient (45) |
31.90% |
0.29 (LOW) |
Poor (3) |
↔ |
NOT GOOD |
|
Infralittoral sand |
71.40% |
0.76 (MODERATE) |
Good (207) |
26.00% |
1.03 (HIGH) |
Good (43) |
↗ |
GOOD |
|
Infralittoral mud |
>100% |
0.55 (LOW) |
Low (29) |
13.20% |
0.39 (LOW) |
Poor (2) |
↔ |
n/a |
|
Circalittoral coarse sediment |
16.50% |
0.33 (LOW) |
Good (193) |
3.50% |
0.58 (LOW) |
Low (18) |
(↗) |
NOT GOOD |
|
Circalittoral mixed sediment |
49.80% |
0.61 (MODERATE) |
Good (107) |
6.90% |
0.55 (LOW) |
Low (10) |
↔ |
GOOD |
|
Circalittoral sand |
50.50% |
0.44 (LOW) |
Good (279) |
11.70% |
0.36 (LOW) |
Good (43) |
↔ |
NOT GOOD |
|
Circalittoral mud |
52.90% |
0.61 (MODERATE) |
Good (402) |
2.40% |
0.61 (MODERATE) |
Low (13) |
↔ |
GOOD |
|
Offshore circalittoral coarse sediment |
10.10% |
0.58 (LOW) |
Good (161) |
0.90% |
0.99 (HIGH) |
Low (13) |
(↗) |
NOT GOOD |
|
Offshore circalittoral mixed sediment |
32.40% |
0.63 (MODERATE) |
Good (134) |
n/a |
No data |
No data |
n/a |
GOOD |
|
Offshore circalittoral coarse sediment and/or Offshore circalittoral mixed sediment |
99.20% |
0.62 (MODERATE) |
Good (138) |
n/a |
No data |
No data |
n/a |
GOOD |
|
Offshore circalittoral sand |
27.10% |
0.58 (LOW) |
Good (189) |
1.00% |
0.45 (LOW) |
Poor (7) |
↔ |
NOT GOOD |
|
Offshore circalittoral mud |
22.20% |
0.26 (LOW) |
Good (326) |
n/a |
No data |
No data |
n/a |
NOT GOOD |
Western Channel & Celtic Sea
GES was achieved for infralittoral sand, circalittoral coarse sediment, circalittoral mixed sediment and circalittoral mud.
In this region limited data were available from 2016-2021 therefore the confidence is poor in most of the assessments for this reporting period. Only two assessments were associated with sufficient or good confidence:
-
Circalittoral coarse sediment: the diversity in this habitat type was low, with a significant decrease since the previous reporting period.
-
Circalittoral sand: the diversity in this habitat type was low, with a significant decrease since the previous reporting period.
For the remaining habitat types assessed in the Western Channel & Celtic Sea, condition was therefore assessed using data from 2009-2015. In this reporting period the number of samples available for the different habitat types are generally high and consequently the confidence in the assessments is considered good in most cases.
-
High diversity was observed for: circalittoral mixed sediment and circalittoral mud. It should be noted that DMagg values for these habitats were just above the cutoff for high diversity and underwent a slight decrease in 2016-2021 that, although not statistically significant, downgraded the diversity category to “moderate”.
-
Moderate diversity was observed for: infralittoral sand.
-
Low diversity was observed for: infralittoral coarse sediments, infralittoral mixed sediments, offshore circalittoral coarse sediment, offshore circalittoral mixed sediment, offshore circalittoral sand and mud.
Further considerations on assessment results for Circalittoral mud:
Circalittoral mud are generally considered highly disturbed habitats (see Extent of Physical Disturbance (BH3a); Matear and others, 2023), which seems to contradict the assessment results that highlighted a relative high diversity of circalittoral mud habitat in the Western Channel & Celtic Sea. When interpreting the results for this habitat type, the following considerations must be considered:
-
The assessment is based on old data collected during 2009-2015 as only 9 samples were available for the period 2016-2021, resulting in an assessment with poor confidence for this reporting period.
-
The reference condition of circalittoral mud in this region were estimated from data collected in the Irish Sea (Table 4), this introduces natural variability in the estimation of the reference condition.
-
Available samples for this habitat type are mostly distributed in coastal areas where the information on occurring pressure is limited, due to the lack of VMS data for vessels <12m length that mostly operate on coastal waters. This means that even in the Irish Sea, a large proportion of samples are lacking pressure information and could not be used for the estimation of reference values (Figure 7). This might result in an underestimation of reference values for this habitat type.
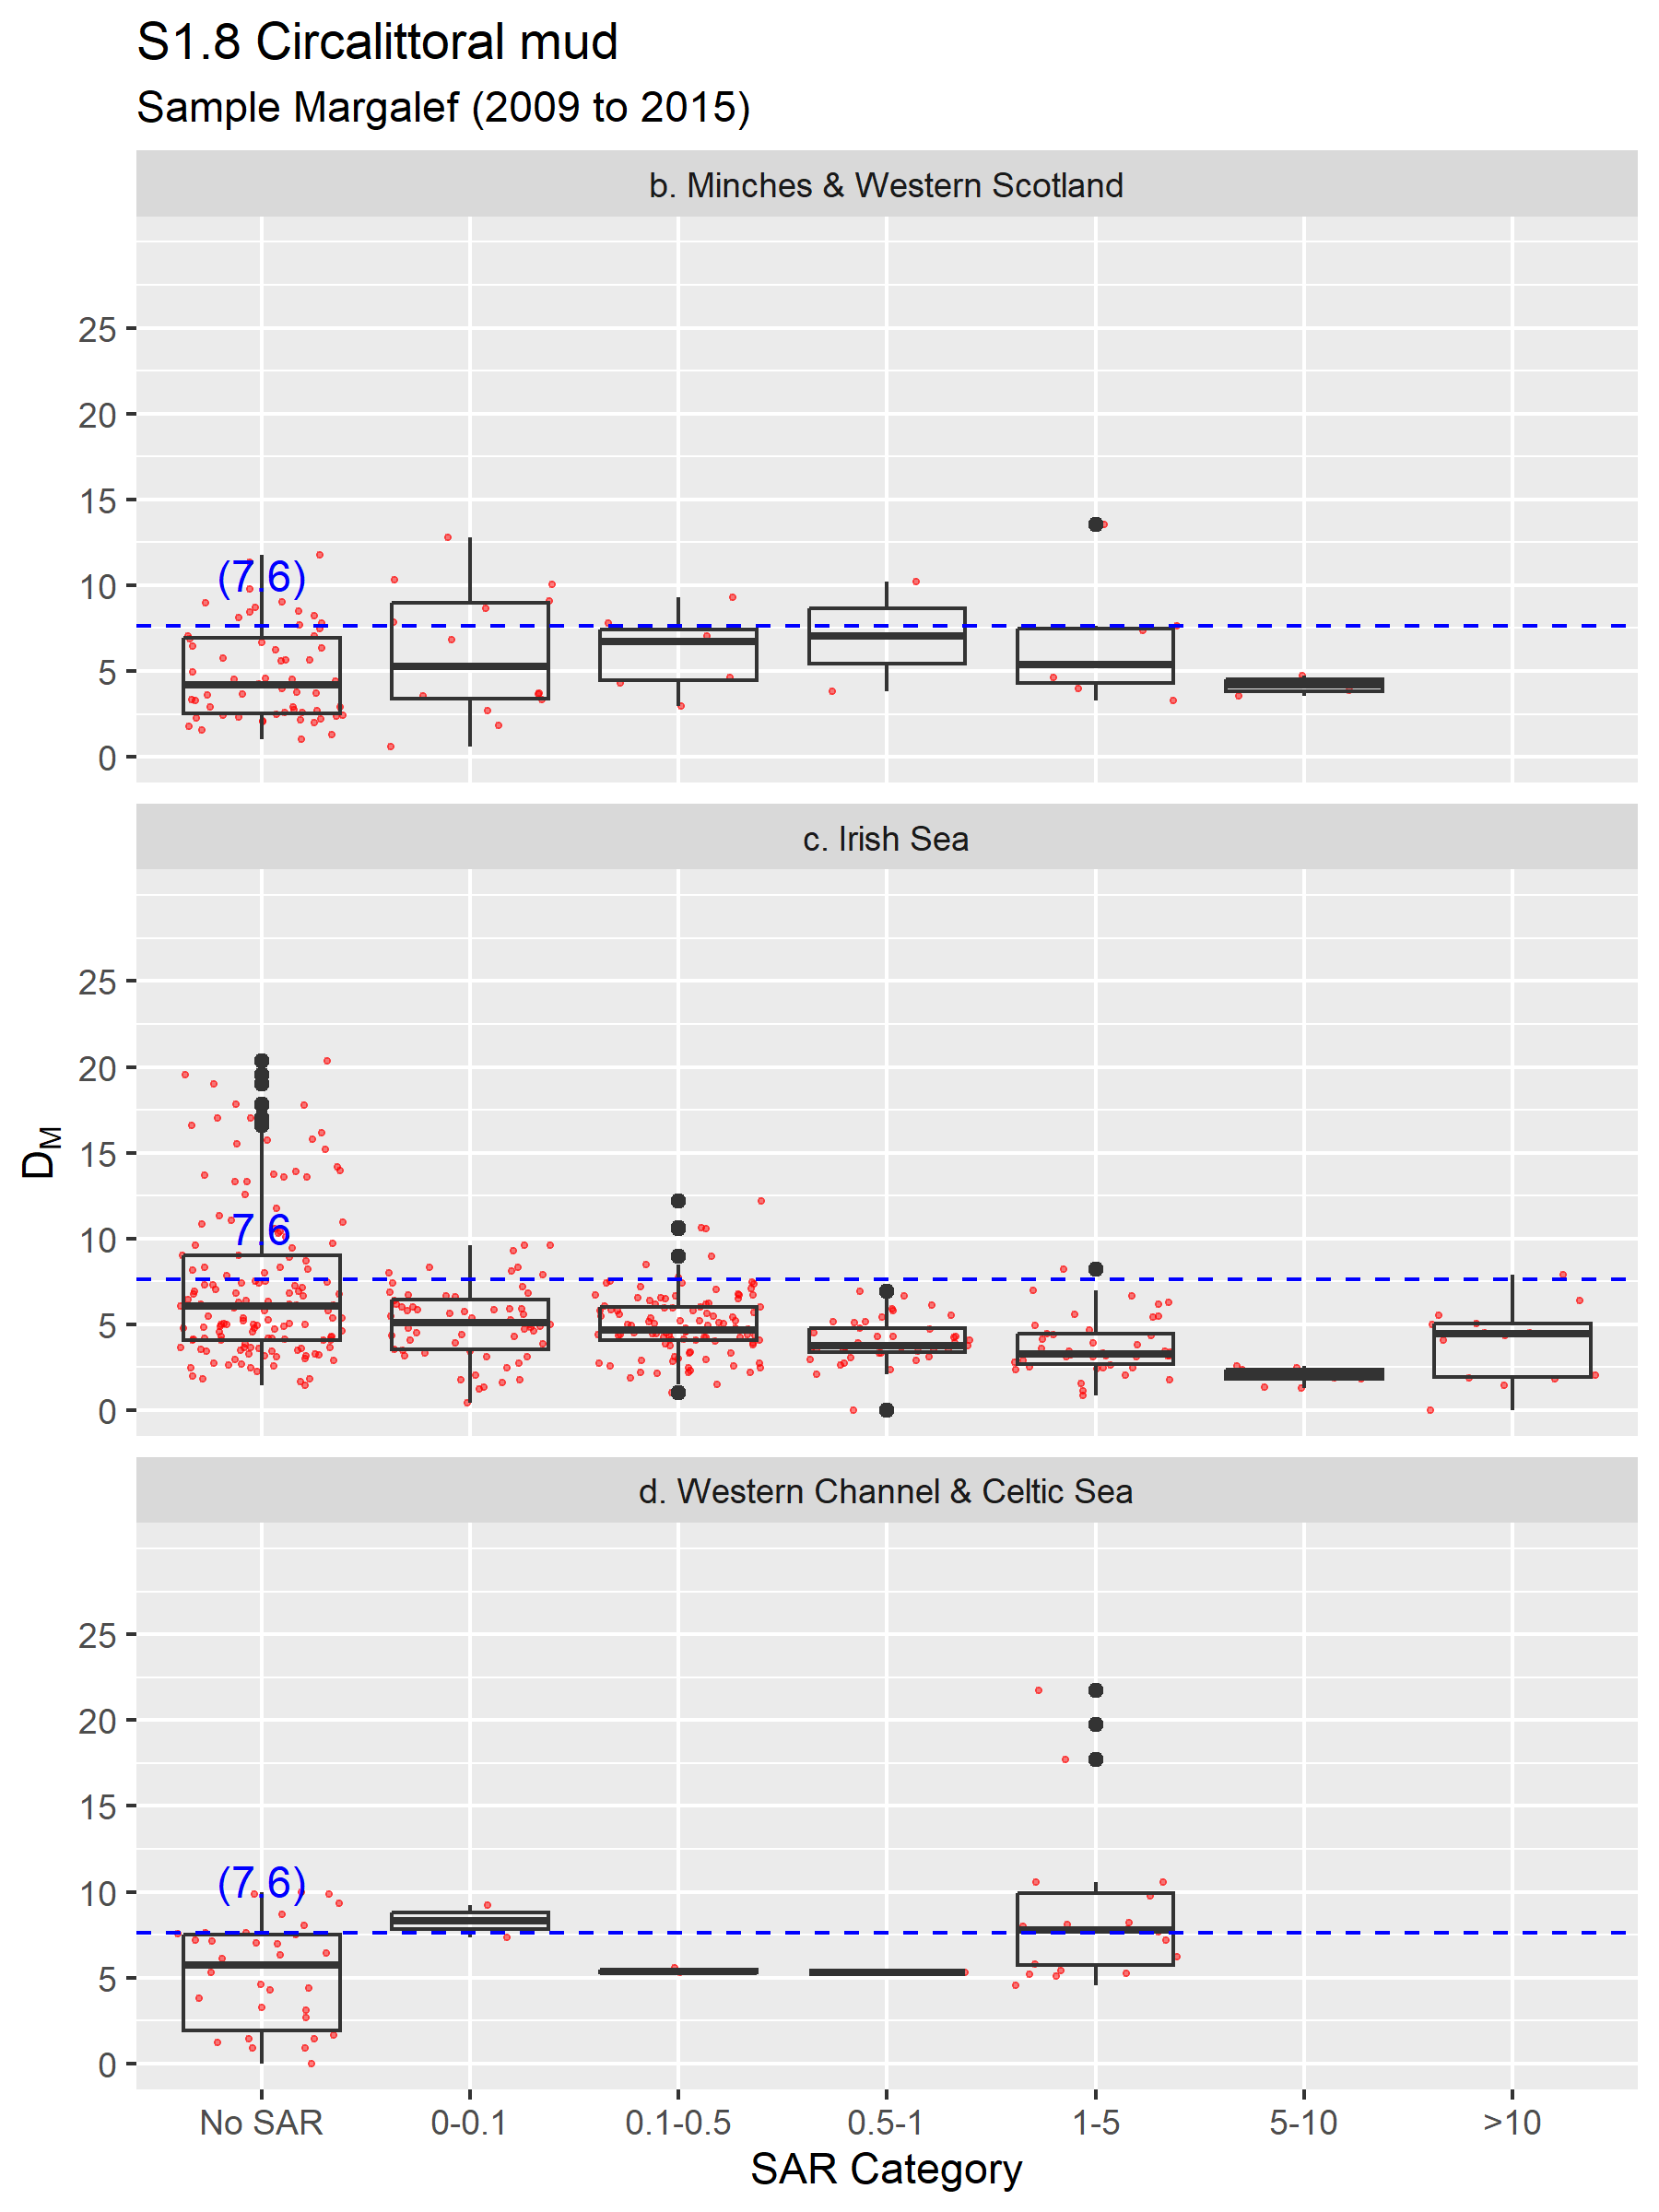
Figure 7. Sample Margalef diversity (DM) and estimated reference Margalef values (Dref) in relation to the reported SAR values. Note, ‘No SAR’ values are not included in Margalef reference estimation. Estimated reference Margalef values (blue) that are not case specific (calculated for the habitat and CP2 region) are given in parentheses. Sample point values (red) are displayed to emphasise the number of observations. For circalittoral mud, Dref values in all regions are derived from samples collected in the Irish sea.
For the assessment period 2009-2015 samples were reasonably well distributed throughout the Western Channel & Celtic Sea assessment unit. Spatial representativity of monitoring data in this region varies greatly among habitat types. The habitat extent covered by monitoring data appears to be overestimated in infralittoral habitats, with various cases exceeding 100% of monitored extent during 2009-2015 (Table 9). Offshore sample locations were mainly clustered inside Marine Protected Areas (MPAs) and the previously proposed Atlantic Array wind farm in the Bristol Channel (Figure 6).
Samples collected between 2016-2021 were limited to areas in the Bristol Channel mostly associated with the Regional Seabed Monitoring Plan (RSMP). As such, the interpretation of the recent diversity values and differences from the previous assessment period require consideration of the limited area of the Western Channel & Celtic Sea assessment unit they represent.
Table 9. Median relative broad scale habitat diversity values (DMagg) with associated Relative diversity category in the Western Channel & Celtic Sea assessment unit assessment unit for the two reporting periods 2009-2015 and 2016-2021. Diversity categories are reported as high (green), moderate (orange), low (red). Confidence level and number of samples available is also provided for each assessment. Assessments associated with ‘poor’ or ‘low’ confidence levels are greyed out. Difference in the DMagg values between the two assessment periods are indicated by arrows: ↗ = significant increase, ↘ = significant decrease, ↔ = no significant difference, n/a = not assessed. Arrows in parentheses indicate less than ‘Sufficient’ confidence in at least one assessment period. Results refer only to the habitat area covered by the monitoring data (not the full habitat extent). The proportion of habitat extent covered by monitoring data is reported in the column ‘monitored habitat extent’. Habitat Status as GES (using the quality threshold DMagg = 0.6) is reported based on the most recent assessment associated to sufficient or higher confidence.
|
Western Channel & Celtic Sea |
||||||||
|
Broad scale habitat |
2009-2015 |
2016-2021 |
Relative Diversity Difference |
Habitat Status (GES) |
||||
|
Monitored Habitat extent |
DMagg (Relative Diversity category) |
Confidence level (sample No.) |
Monitored Habitat extent |
DMagg (Relative Diversity category) |
Confidence level (sample No.) |
|||
|
Infralittoral coarse sediment |
>100% |
0.29 (LOW) |
Sufficient (30) |
|
No data |
No data |
n/a |
NOT GOOD |
|
Infralittoral mixed sediment |
>100% |
0.3 (LOW) |
Sufficient (31) |
55.50% |
0.48 (LOW) |
Poor (2) |
(↗) |
NOT GOOD |
|
Infralittoral sand |
>100% |
0.74 (MODERATE) |
Good (214) |
|
No data |
No data |
n/a |
GOOD |
|
Infralittoral mud |
>100% |
0.36 (LOW) |
Poor (17) |
16.50% |
1.24 (HIGH) |
Poor (2) |
(↗) |
n/a |
|
Circalittoral coarse sediment |
31.40% |
0.63 (MODERATE) |
Good (226) |
3.50% |
0.25 (LOW) |
Sufficient (20) |
↘ |
GOOD |
|
Circalittoral mixed sediment |
>100% |
0.81 (HIGH) |
Good (130) |
25.10% |
0.65 (MODERATE) |
Poor (9) |
↔ |
GOOD |
|
Circalittoral sand |
41.50% |
0.47 (LOW) |
Good (207) |
5.50% |
0.28 (LOW) |
Good (35) |
↘ |
NOT GOOD |
|
Circalittoral mud |
>100% |
0.84 (HIGH) |
Good (60) |
26.40% |
0.8 (MODERATE) |
Poor (9) |
↔ |
GOOD |
|
Offshore circalittoral coarse sediment |
4.40% |
0.43 (LOW) |
Good (160) |
|
No data |
No data |
n/a |
NOT GOOD |
|
Offshore circalittoral mixed sediment |
46.20% |
0.56 (LOW) |
Good (84) |
|
No data |
No data |
n/a |
NOT GOOD |
|
Offshore circalittoral coarse sediment and/or Offshore circalittoral mixed sediment |
74.40% |
0.47 (LOW) |
Low (64) |
|
No data |
No data |
n/a |
n/a |
|
Offshore circalittoral sand |
6.50% |
0.53 (LOW) |
Good (233) |
|
No data |
No data |
n/a |
NOT GOOD |
|
Offshore circalittoral mud |
8.20% |
0.51 (LOW) |
Good (61) |
|
No data |
No data |
n/a |
NOT GOOD |
Conclusions
Conclusions of the UKMS assessment for the Relative Margalef diversity index in the Celtic Seas
The results of the BH2b assessment indicate benthic habitats in the Celtic Seas generally represent relatively low diversity in comparison with estimated reference condition. Among the assessments associated with sufficient or higher confidence, GES was achieved in 32% of cases and not achieved in 68% of cases.
Due to data gaps, a full evaluation of trends was not possible; however, data available indicate that circalittoral coarse sediment and circalittoral sand habitats in the Western Channel & Celtic Sea have decreased in diversity. In the Minches & Western Scotland, the diversity in infralittoral mixed sediment diversity had increased between the two assessment periods.
The confidence in the assessment is limited by the widespread lack of recent data collected in the latest assessment period (2016-2021) and less data available from monitoring programmes. Available data also tend to be clustered, with samples typically concentrating around specific areas such as MPAs. The estimated spatial representativity of monitoring data varies greatly among regions and habitat types, with various assessment based on data estimated to cover less than 10% of habitat extent. Spatial representativity is lower for data collected during 2016-2021 in comparison with the previous assessment period. As a result, the confidence in the assessment of the wider marine environment is limited. However, it is important to mention that in the current pilot, the assessment of confidence did not consider the spatial representativeness of the data, as the method for applying this was not fully developed. In future assessments, it is recommended to incorporate a quantified estimation of the spatial representativeness of the monitoring data.
Relative diversity is not solely the result of the dominant pressure of physical disturbance from fisheries but can be influenced by various other pressures not included as part of the analysis. Additionally, those habitats with naturally low diversity might be misrepresented in the results. Future assessments should preferably be combined with additional pressures and / or alternative estimations of reference conditions; developments should be tested and calibrated with alternative indicators (e.g., Sentinels of the Seabed (BH1), Extent of Physical Damage to benthic habitats (BH3) and proposed future indicator Benthic Indicator Species Index (BH6)).
Further information
The results of this pilot assessment show that benthic diversity in the Celtic Seas is predominantly low (DMagg < 0.6). Relative high diversity was observed during the period 2016-2021 only in infralittoral sand habitat in the Irish sea. Assessments based on older data collected during 2009-2015 showed that high diversity was observed in the Western Channel & Celtic Sea region for circalittoral mixed sediment and circalittoral mud. Diversity of circalittoral mud, however, might be overestimated by the fact that reference values had to be obtained from a different area and by the limited pressure information available in coastal areas, where most of the samples are distributed.
Where differences in the median relative Margalef diversity were identified between assessment periods, these mostly indicated little changes, although in some instances an increase in relative diversity was observed for the most recent data. However, evaluation of temporal differences is tentative given the limited number of observations between 2016 and 2021, and spatially aggregated nature of the data.
When compared with the assessments for the Greater North Sea (Central North Sea, Southern North Sea, and Channel), assessed for the OSPAR QSR 2023 (Wijnhoven and others, 2023), the condition of benthic habitats in the Celtic Seas typically displayed lower relative diversity values. However, whilst the methods used for the assessment in the Celtic Seas sub-region closely followed the method used in the Greater North Sea (Wijnhoven and others, 2023), there were fundamental differences. Most notably, the Greater North Sea method required data to be further subdivided between countries, whilst also combing countries data to make assessments at the scale OSPAR benthic assessment units. The need to standardise data between all countries also resulted in a more severe reduction in taxa removed from sample data. Subsequently, this could potentially reduce estimates of reference diversity if those taxa excluded were likely to be more prevalent in areas of low fishing pressure (e.g., fragile epifauna).
Before relative diversity could be calculated, first estimates of each broad scale habitats expected reference diversity needed to be determined. In many instances there were not sufficient samples meeting the quality criteria to make area specific reference estimates. In most instances estimates of reference values could be taken as averages from other assessment units; however, in some cases a broad scale habitat reference value was derived from only one area or had to be estimated from other broad scale habitats. This was notable for Infralittoral coarse sediment, infralittoral mixed sediment, Infralittoral mud, and circalittoral mud reference values, each being derived from only one assessment unit. Additionally, offshore circalittoral mud, and upper bathyal sediment had no direct estimates of reference diversity.
The fundamental challenge to assessments of benthic habitat condition was the limited number of samples and their often, aggregated distribution. Without enough observations from consistently monitored areas, any assessment across the entire Celtic Seas sub-region with high confidence remains difficult.
Knowledge gaps
-
Further investigation required to understand the variability introduced when standardising and aggregating data from multiple sources to better identify appropriate assessment units.
-
Refine threshold value to assess quality status.
-
Explore the improvement of monitoring programmes over habitat areas within and outside MPAs so the minimum quality criteria for the calculation of reference estimates could be met as well as increase the confidence of future assessments to inform management decisions.
-
Explore the use of higher resolution fisheries data in the indicator to understand the effects of individual gears on the Margalef index and inform FMPs.
-
Identify other pressure impacts, including environmental variables and how these might influence results.
Further information
Optimisation of standardisation to achieve comparability.
The use of relative Margalef diversity as an indicator metric allowed increased comparability of results based on data that differ in the sampling methodology used, habitat type, and biogeography. However, splitting up methodologies, habitats, and areas into many categories to increase standardisation can reduce availability of data for each category. Reduced availability of data can subsequently reduce the confidence of both reference values and the assessment of relative diversity.
In the absence of a large-scale monitoring programme data, it will always be challenging to balance between the need of increasing data standardisation whilst maintaining sufficient observations to make benthic habitat assessments. Future work would benefit from a better understanding of how much variability is acceptable when combining data for large scale assessments. Also, additional effects of environmental gradients or additional pressures on benthic diversity should be further incorporated for a better estimation of reference values.
Threshold values
It is known that benthic community diversity to a certain extent is indicative for the benthic quality status. However, the Relative Margalef Diversity value of 0.6 used as threshold between good and not good environmental status would need to be revised in future iterations of the assessment.
Further work is required to define what values of relative Margalef diversity would represent a ‘good’ quality status. Additionally, further understanding is needed surrounding the confidence of assessments and how to avoid any spatial bias introduced when samples are not from repeated monitoring locations.
Role of additional pressures and environmental variables
The current assessment is entirely focused on physical disturbance by fisheries as the dominant pressure. Estimating the reference is entirely based on physical pressure mapping from fisheries, largely neglecting any other type of pressure and/or ‘natural’ variability that might occur within the broad scale habitat. It is expected that many other variables and pressures can have a substantial impact on benthic diversity.
For BH2b, but also for other benthic habitats indicators, there should be more efforts in pressure mapping or integrating potential impacts of other pressures in assessment results. Further work should be done to investigate to what extent the relative Margalef diversity responds to different pressures and whether one pressure impact might have a greater effect than another. Some first indications of the response and sensitivity of the relative Margalef diversity to different pressures is given by the ICES WKBENTH3 report (ICES, 2022) testing several indicators (amongst others the DM’) in pressure gradient. Although DM’ appeared to be sufficiently sensitive to fishing pressure gradients, it was not the most sensitive indicator.
Previous work conducted by Van Loon and others (2018) on this indicator showed that the Relative Margalef diversity index was also sensitive to pollution and eutrophication gradients. This might indicate that the response to such gradients might be more consistent and/or have a greater influence than physical disturbance gradients in case of combi-pressure situations. The inclusion of the spatial distribution of other pressures in the future would help improve assessments. Additionally, the inclusion of specific management measures that might influence the representativity of benthic communities might aid the determination of reference conditions.
Broad scale habitat data
Different cut-off levels in mud content are used to distinguish the sandy from muddy habitat within EUNIS classification and EU MSFD Broad Habitat Types (BHTs). The EU MSFD broad habitat type classification uses a cut-off level at 10% mud. However, the EUNIS classification uses a cut-off level at 20% mud at the various levels to distinguish between sandy sediments. EUNIS habitat information was used for the assessment of BH2b in the Celtic Seas, translated to broad scale habitats classifications based on the North Atlantic definitions. Whilst these habitat definitions match the EU MSFD broad habitat types there remains differences when comparing sandy or muddy habitats between assessments. Additionally, there is further need for ground-truthing of modelled habitat classifications in certain areas.
Further investigations of the variability of relative diversity within broad scale habitats could also advance the indicator method. Potentially diversity for some habitats within a broad scale definition are much greater than other habitats contained in the broad scale definitions. Additionally, some habitats that experience naturally high levels of physical disturbance might not be suitable for assessment based on diversity. For example, well-sorted sands subject to wave action or strong tidal streams.
Monitoring data
The confidence in the assessment has largely been impacted by the lack of recent monitoring data. New monitoring data would therefore be needed to improve confidence in future assessments. Currently monitoring data are generally collected around Marine Protected Areas, resulting in a clustered distribution of available data. Despite an analysis of spatial representativity of the dataset, this was not included in the confidence of the present pilot. It is likely there would be further reduction in the confidence of results from the clustered distribution of available data. Future assessments would benefit from datasets that contain higher number of samples collected in recent years that are more representative of the known spatial extent of individual habitats.
Data gathering
The national biodiversity Data Archive Centre, DASSH, and Marine Data Exchange portals were queried for data suitable for the indicator. Whilst these data portals made available benthic sample data, they were of a very granular nature in diverse formats making the extraction of useful information challenging. The amount of work required to gather, format, and screen the data from these sources at the spatial scaled need for the assessment was considered unfeasible. Additionally, with the inclusion of further datasets there was increased time required to ensure duplication was not present between sources. For these reasons data from DASSH and Marine Data Exchange were not considered. Improvements in harmonising data portals and facilitating data extraction at greater spatial scales would benefit future assessments.
Marine Recorder was the main source of data for the assessment. Given that this database is currently being redeveloped, a backlog of survey data might exist so latest snapshots not necessarily contains all available survey information. Data submitted to the database is not required to include key metadata, most notably sample area, sample volume, and mesh size used for the analysis. For some data, this information could be obtained from alternative sources (e.g., in MEDIN, MERMAN, by looking at individual survey reports, or following consultation with Benthic Subgroup). The lack of key metadata however excluded many samples from the assessment, subsequently a large proportion of benthic samples could not be included in the analysis (approximately 1800).
Additional information on data preparation, data cleaning, data truncation and data analysis, along with mapped and supplementary results are available from JNCC on request.
References
Allaire, J., Xie, Y., McPherson, J., Luraschi, J., Ushey, K., Atkins, A., Wickham, H., Cheng, J.,
Chang, W., Iannone, R., 2022. rmarkdown: Dynamic Documents for R. R package version 2.18. URL: https://rmarkdown.rstudio.com.
Castle L., Lillis H., Duncan G. & Manca E., 2021. Method for creating a EUNIS level 3 seabed habitat map integrating fine and broad scale maps for the North-East Atlantic. JNCC report in Prep.
EMODnet, 2021. Seabed Habitats. [Online] Available at: https://emodnet.ec.europa.eu/en/seabed-habitats (Accessed: 01/12/2021).
JNCC, 2022. Charting Progress 2 Reporting Regions. Available at: https://hub.jncc.gov.uk/assets/86a761a7-8564-4c22-9ddb-ee1d0aa50003
ICES, 2021. OSPAR request on the production of spatial data layers of fishing intensity / pressure. ICES Technical service.
ICES, 2022. Workshop to evaluate proposed assessment methods and how to set thresholds for assessing adverse effects on seabed habitats (WKBENTH3). Copenhagen, Denmark, ICES, 102pp. ICES Scientific Reports, 4:93. DOI: https://doi.org/10.17895/ices.pub.21666260
Manca, E. and Lillis H., 2022. 2019 Update to UKSeaMap – a broad scale seabed habitat map for the UK. unpublished.
Matear, L., Vina-Herbon, C., Woodcock, K.A., Duncombe-Smith, S.W., Smith, A.P., Schmitt, P., Kreutle, A., Marra, S., Curtis, E.J., and Baigent, H.N. 2023. Extent of Physical Disturbance to Benthic Habitats: Fisheries. In: OSPAR, 2023: The 2023 Quality Status Report for the Northeast Atlantic. OSPAR Commission, London. Available at: https://oap.ospar.org/en/ospar-assessments/quality-status-reports/qsr-2023/indicator-assessments/phys-dist-habs-fisheries/
OneBenthic database, 2020. Available from https://rconnect.cefas.co.uk/onebenthic_portal/. Accessed: 09/12/2022.
OSPAR Commission, 2017. OSPAR Intermediate Assessment 2017. OSPAR Commission. London.
Pebesma, E., 2018. Simple Features for R: Standardized Support for Spatial Vector Data. The R Journal 10 (1), 439-446, https://doi.org/10.32614/RJ-2018-009
Phillips, G., McGruer, K., Crook, D., Doria, L., Herbon, C., Khan, J., Mackie, T., O’Reilly, M., Singleton, G. & Young, C. 2018. Condition of soft sediment invertebrate communities in coastal waters determined using Water Framework Directive methods. Marine Online Assessment Tool, available at: https://moat.cefas.co.uk/previous-assessments/2018-assessment/biodiversity-food-webs-and-marine-protected-areas/benthic-habitats/subtidal-habitats/
R Core Team, 2019. R: A language and environment for statistical computing. R Foundation for Statistical Computing, Vienna, Austria. https://www.R-project.org/
Van Loon, W.M.G.M., Walvoort, D.J.J, Van Hoey, G., Vina-Herbon, C., Blandon, A., Pesch, R., Schmidt, P., Scholle, J., Heyer, K., Lavaleye, M., Philips, G., Duineveld, G.C.A., Blomqvist, M., 2018. A regional benthic fauna assessment method for the Southern North Sea using Margalef diversity and reference value modelling. Ecological Indicators 89, 667-679.
Vasquez, M., Allen, H., Manca, E., Castle, L., Lillis, H., Agnesi, S., Al Hamdani, Z., Annunziatellis, A., Askew, N., Bekkby, T., Bentes, L., Doncheva, V., Drakopoulou, V., Duncan, G., Gonçalves, J., Inghilesi, R., Laamanen, L., Loukaidi, V., Martin, S., McGrath, F., Mo, G., Monteiro, P., Muresan, M., Nikilova, C., O'Keeffe, E., Pesch, R., Pinder, J., Populus, J., Ridgeway, A., Sakellariou, D., Teaca, A., Tempera, F., Todorova, V., Tunesi, L. & Virtanen, E., 2021. EUSeaMap 2021, A European broad scale seabed habitat map, Technical Report.
Wijnhoven, S., Walvoort, D. and Schilder, J. 2023. Condition of Benthic Habitat Communities: Margalef diversity in region II (Greater North Sea) In: OSPAR, 2023: The 2023 Quality Status Report for the North-East Atlantic. OSPAR Commission, London. Available at: https://oap.ospar.org/en/ospar-assessments/quality-status-reports/qsr-2023/indicator-assessments/condition-benthic-hab-margalef/
Wickham and others, 2019. Welcome to the tidyverse. Journal of Open Source Software, 4(43), 1686, https://doi.org/10.21105/joss.01686
WoRMS Editorial Board, 2023. World Register of Marine Species. Available from https://www.marinespecies.org at VLIZ. Accessed 2023-05-03. doi:10.14284/170
Authors
Stephen Duncombe-Smith1, Stefano Marra1, Laura Pettit1 and Cristina Vina-Herbon1
1Joint Nature Conservation Committe
Supporting contributions and acknowledgements:
Matt Service (AFBI),
Tim Mackie (DAERA),
Andrew Scarsbrook, Edward Wright (Defra),
Graham Phillips (Environment Agency),
Adam Britton, Adam Smith, Jenny Booth, Joe Kenworthy, Kirsty Woodcock, Lauren Molloy, Liam Matear, Marco Fusi (JNCC),
Phil Boulcott (Marine Directorate of the Scottish Government)
James Highfield (Natural England)
Eunice Pinn, James Dargie, Roddy MacMinn, Peter Webster (NatureScot)
Jenny Oates, Karen Robinson, Matthew Green, Mike Camplin (NRW)
The Benthic Sub-Group of the Healthy and Biologically Diverse Seas Evidence Group.
Assessment metadata
| Assessment Type | |
|---|---|
| Point of contact email | marinestrategy@defra.gov.uk |
| Metadata date | Monday, January 1, 0001 |
| Title | |
| Resource abstract | |
| Linkage | |
| Conditions applying to access and use | |
| Assessment Lineage | |
| Dataset metadata | |
| Dataset DOI | please contact marinestrategy@defra.gov.uk |
The Metadata are “data about the content, quality, condition, and other characteristics of data” (FGDC Content Standard for Digital Geospatial Metadata Workbook, Ver 2.0, May 1, 2000).
Metadata definitions
Assessment Lineage - description of data sets and method used to obtain the results of the assessment
Dataset – The datasets included in the assessment should be accessible, and reflect the exact copies or versions of the data used in the assessment. This means that if extracts from existing data were modified, filtered, or otherwise altered, then the modified data should be separately accessible, and described by metadata (acknowledging the originators of the raw data).
Dataset metadata – information on the data sources and characteristics of data sets used in the assessment (MEDIN and INSPIRE compliance).
Digital Object Identifier (DOI) – a persistent identifier to provide a link to a dataset (or other resource) on digital networks. Please note that persistent identifiers can be created/minted, even if a dataset is not directly available online.
Indicator assessment metadata – data and information about the content, quality, condition, and other characteristics of an indicator assessment.
MEDIN discovery metadata - a list of standardized information that accompanies a marine dataset and allows other people to find out what the dataset contains, where it was collected and how they can get hold of it.