
Sea surface suspended sediments and turbidity
In the previous assessment (HM Government, 2012), no significant trend in suspended particulate matter was identifiable for any of the Charting Progress 2 regions. New analysis using satellite observations for suspended particulate matter over 1998-2015 show significant increases in 5 out of 10 Charting Progress 2 regions that is consistent with a background longer term increase since the beginning of the 20th Century.
Background
Suspended particulate matter in shelf seas determines turbidity in the water column, material transfers to the seabed, and the flux and fate of associated pollutants and contaminants. These in turn constrain primary production; influence air-sea heat transfer; determine sedimentation rates and biogeochemical transfers from the water column to seabed; affect the productivity of the benthos; and determine oxygen levels in bottom waters. Shifts in the fate of suspended particulate matter between export to the pelagic food web or deposition to the benthos are also critical processes for eutrophication.
Different physical and biological processes control suspended particulate matter and turbidity in UK waters. Suspended Sediment Concentration (known as SSC) is the result of the balance between resuspension and deposition. Resuspension is largely due to bed shear stress caused by tidal currents and waves. Deposition depends on settling of suspended particulate matter, mainly governed by the size and density of the particles which is further modulated the aggregation of particles.
Monitoring Turbidity
Monitoring suspended particulate matter in-situ across the scale of the UK seas can be difficult, partly due to their inhomogeneity. Remote ocean colour satellite images are a useful tool to measure the temporal and spatial scales of variability.
In the previous assessment (HM Government, 2012), for which satellite and in situ observations were analysed, no significant trend was observed in any of the Charting Progress 2 regions. For this assessment, only remote sensing observations were considered using daily products generated by Ifremer from multiple sensors (SeaWifs, MODISv, MERIS and VIIRS) and interpolated to a 1.1km grid.
Long-term change
Recent studies have identified a trend of increasing turbidity in UK seas since the beginning of the 20th century (Dupont and Asknes, 2013, Capuzzo and others, 2015), thought to be linked to a combination of increased winds in the second half of the 20th century, changes to land use and river management, draining of wetlands, and increased marine activities such as trawling.
Results
The spatial pattern of suspended particulate matter concentrations for the period 1998-2015 (Figure 1) clearly show the Anglian plume as the largest feature on the NW European shelf, extending from the Thames Estuary across the Southern North Sea (Southern Bight) northeast towards the Danish coast (Jutland Bank). The mouths of the large European rivers, Elbe, Rhine and Meuse, show mean suspended particulate matter values greater than 10mg/l. Around the UK coast the Thames estuary, Humber, the Wash, Severn and Liverpool Bay also show mean values of suspended particulate matter above 10 mg/l. The average surface suspended particulate matter across each of the Charting Progress 2 regions is presented in Table 1. The Southern North Sea generally experiences the highest observed suspended particulate matter concentrations, followed by the Eastern English Channel and the Irish Sea. The off-shelf Atlantic waters of the South-West Approaches are the clearest.
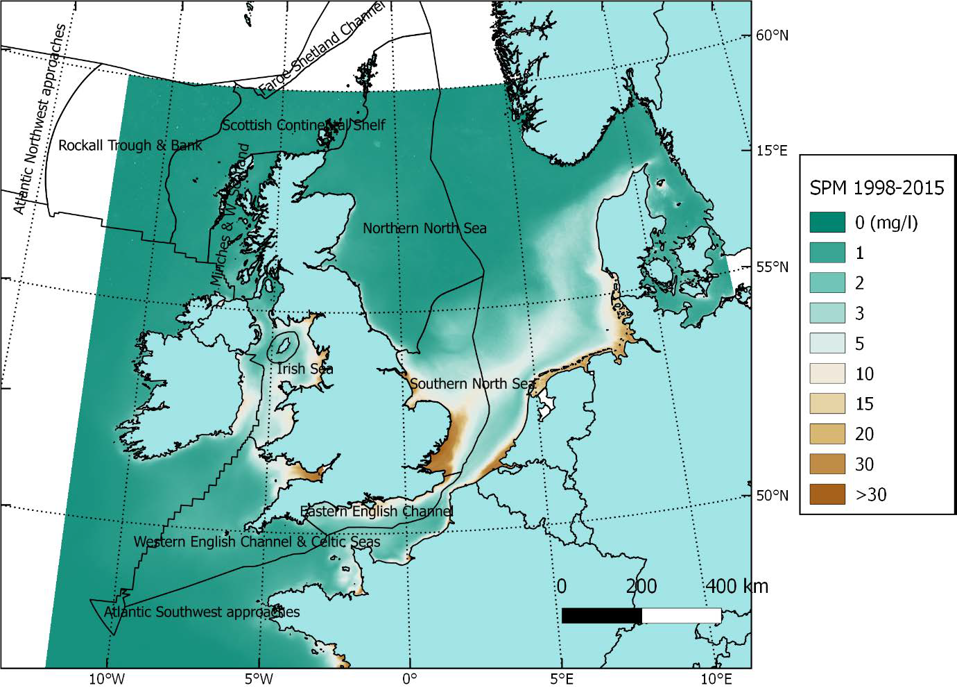
Figure 1: Satellite derived annual mean surface suspended particulate matter (SPM) concentration (mg/l) for the period 1998-2015 and Charting Progress 2 regions.
Time series of suspended particulate matter (Figure 2) were obtained by calculating the mean monthly fields over the period 1/1/1998-31/12/2015 (18 years) averaged for each of the Charting Progress 2 areas. The time-series have a clear seasonal cycle, with peak values typically occurring in winter, and a high degree of inter-annual variability.
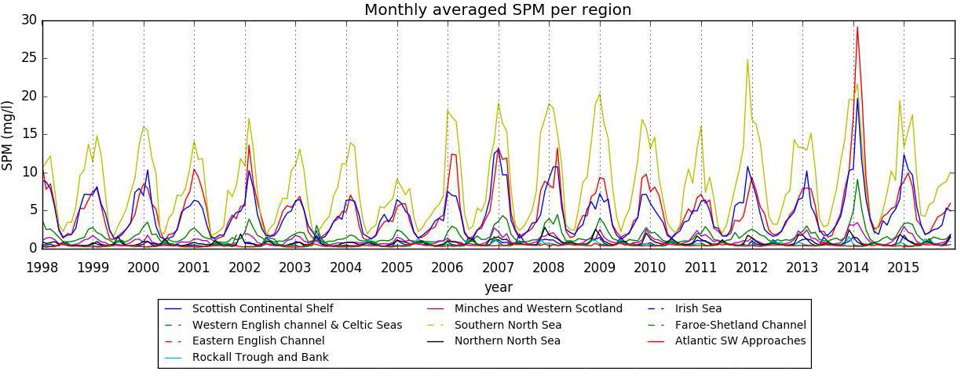
Figure 2. Monthly suspended particulate matter (mg/l) for each Charting Progress 2 region for the period 1998-2015.
The annual average surface suspended particulate matter in each region was examined for evidence of a trend over the 18-year period. On-the-shelf, the Scottish Continental shelf, the Northern North Sea and Minches and Western Scotland show significant increases (Table 1). Off-shelf the Rockall Trough and South West Approaches also show significant increases (Table 1). In no area was evidence of decreasing suspended particulate matter over the period found.
Table 1. Satellite derived seasonal and annual average surface Suspended Particulate Matter (mg/l) for the period 1998-2015 by Charting Progress 2 Region. Values followed by an upward (↑) indicate with significant increases in suspended particulate matter (Mann-Kendall test, p<0.05).
|
Average surface suspended particulate matter (mg/l) for the period 1998-2015 |
|||||
|
Charting Progress 2 Region |
Spring |
Summer |
Autumn |
Winter |
Annual |
|
On shelf |
|||||
|
Scottish Continental Shelf |
0.7 |
0.6 |
0.6 ↑ |
0.8 |
0.7 ↑ |
|
Northern North Sea |
0.7 |
0.6 ↑ |
0.9 ↑ |
1.0 |
0.8 ↑ |
|
Southern North Sea |
4.6 ↑ |
4.7 ↑ |
10.9 |
14.1 |
8.6 |
|
Eastern English Channel |
2.9 ↑ |
2.5 |
5.5 |
9.0 |
5.0 |
|
Western English Channel & Celtic Seas |
1.2 |
1.1↑ |
1.6 |
2.8 |
1.7 |
|
Irish Sea |
2.7 ↑ |
2.3 |
5.4 |
7.8 |
4.6 |
|
Minches and Western Scotland |
0.8 ↑ |
0.6 ↑ |
1.2 ↑ |
1.6 |
1.0 ↑ |
|
Off shelf |
|||||
|
Rockall Trough and Bank |
0.6 |
0.6 |
0.5 ↑ |
0.4 ↑ |
0.5 ↑ |
|
Faroe-Shetland Channel |
0.6 |
0.6 |
0.5 |
0.4 ↑ |
0.5 |
|
Atlantic SW Approaches |
0.5 |
0.4 ↑ |
0.4 ↑ |
0.3 ↑ |
0.4 ↑ |
Applying the same analysis to each season it was also possible to identify whether trends were evident for particular times of the year (Table 1). On-the-shelf, the Scottish Continental Shelf had a significant trend in autumn (October-December), as did the Northern North Sea in summer and autumn, and Western Scotland in spring, summer and autumn. The more turbid waters of the Southern North Sea, Irish Sea and Eastern English Channel experienced increases in spring suspended particulate matter, no trend was found on-shelf in winter. Conversely, winter increases were significant in all 3 off-shelf regions while spring showed no trends, in the Atlantic SW Approaches the increases were significant in summer and autumn too.
The observed increases in suspended particulate matter since the 1990s during autumn of the more exposed on-shelf regions might be attributable to early storms and to increases in winds (Bakker and van der Hurk, 2012). Surprisingly, no trend is observed in winter on the shelf, which is when suspended particulate matter peaks (precipitation is generally stronger, and the resulting river discharge is greater).
Conclusions
Analysis of time series averaged for the Charting Progress 2 regions identified positive trends in the annual average concentration of suspended particulate matter on the Scottish continental shelf, the Northern North Sea, Minches and Western Scotland, Rockall Trough and South West Approaches. Seasonal trends are evident in winter for the off-shelf regions and for spring to autumn periods on the shelf. The longer-term context for these 18-year trends is the increasing turbidity of UK waters since the beginning of the 20th VCentury (Dupont and Asknes, 2013, Capuzzo and others, 2015).
Knowledge gaps
Further research is needed to confidently attribute the causes of the trends in suspended particulate matter concentration that can now be identified over a wide spatial area from satellites.
There is a need to improve in situ validation for remote sensing estimates, particularly matching the observations to the location and timing of satellite overpasses. Better coverage of sub-surface suspended particulate matter and turbidity would add information that is beyond the reach of satellite sensors.
A latitudinal bias in the satellite estimates due to winter sun-angle limits useful data from December and January north of 57°N when sea condition is normally worse and leads to a local underestimate in mean annual suspended particulate matter values.
Satellite estimates can be biased towards periods of clear skies, which are generally associated with better sea conditions and lower suspended particulate matter values. In coastal areas there can be less data available in winter due to greater cloud cover.
References
The information, figures and all the results presented in this assessment has been extracted from the following reports:
Strategic Environmental Assessment programme Suspended Sediments report:
Silva T, Biermann L, Rees J (2016) ‘Suspended Sediment Climatologies around the UK’ Report for the UK Department of Energy and Climate Change’s offshore energy Strategic Environmental Assessment programme (viewed on 14 January 2019)
Dataset of monthly averaged non-algal Suspended Particulate Matter concentrations on the UK shelf waters from satellite observations:
Silva T (2016) ‘Monthly averages of non-algal Suspended Particulate Matter concentrations’ doi:10.14466/CefasDataHub.31 (viewed on 14 January 2019)
Charting Progress 2 report for Suspended Particulate Matter and Turbidity:
UKMMAS (2010). ‘Suspended Particulate Matter and Turbidity’ Charting Progress 2 Feeder Report: Ocean Processes, Huthnance J (editor). Department for Environment Food and Rural Affairs on behalf of the UK Marine Science Co-ordination Committee (viewed on 14 January 2019)
Other Cited literature
Bakker AM, van den Hurk BJ (2012) ‘Estimation of persistence and trends in geostrophic wind speed for the assessment of wind energy yields in Northwest Europe’ Climate dynamics, 39(3-4): 767-782 (viewed on 30 January 2019)
Capuzzo E, Stephens D, Silva T, Barry J, and Forster RM (2015) ‘Decrease in water clarity of the southern and central North Sea during the 20th century’ Global Change Biology, 21: 2206–2214. doi:10.1111/gcb.12854 (viewed on 14 January 2019)
Dupont N, and Aksnes DL.(2013) ‘Centennial changes in water clarity of the Baltic Sea and the North Sea’ Estuarine, Coastal and Shelf Science, 131:282-289 (viewed on 14 January 2019)
Acknowledgements
Assessment Metadata
Please contact marinestrategy@defra.gov.uk for metadata information