
Sea surface and water column temperature in 2011-2015
In the UK Initial Assessment (HM Government, 2012), a warming trend over the previous 3 decades was found in the averaged sea surface temperatures across UK waters. This updated assessment finds that sea surface temperature continues to rise because of global warming, but notes that the succession of cooler years between 2010 and 2013 led to a slightly weaker trend when evaluated over the period 1984-2014.
Background
Sea temperature is a major driver of marine ecosystems and one of the key factors affecting the physiology, ecology and distribution of marine species. Changes in sea temperature produce changes in water density and hence affect the circulation and spatial distribution and timing of stratification. For most of the north-west European shelf seas, the main factors controlling sea temperature are weather, seasonal variation in solar heating and heat exchange with the open ocean. In the previous assessment (HM Government, 2012), a warming trend was observed in UK surface and deep waters as a consequence of global warming. Superimposed to this positive trend are periods of interannual and decadal variability that are part of the atmosphere-ocean climate system and are reflected in the records as periods of cooling or warming (Figure 1).
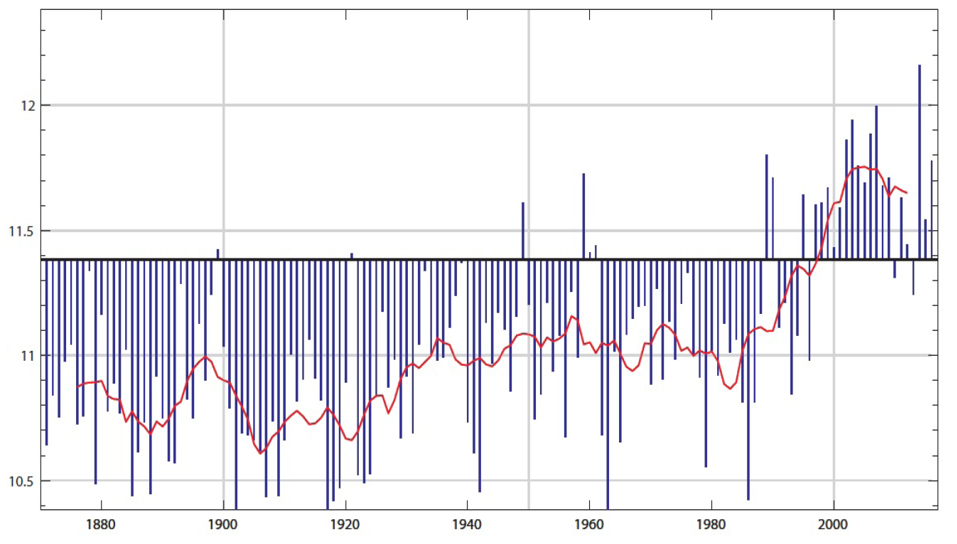
Figure 1. Time series of average sea surface temperature (in degrees Celsius) in UK shelf waters for the period 1870-2016. The blue bars show the annual values relative to the 1981-2010 average and the smoothed red line shows the 10-year running average. Data are from the HadISST1.1 data set (Rayner and others, 2003).
Monitoring Sea Temperature
There are more temperature observations at the sea surface than at the bottom or ocean interior. At the surface, extensive data products exist that integrate observations measured from a wide range of platforms (e.g. research vessels, satellites, ships of opportunity, moored platforms and drifting instruments) as well as independent sustained local time-series. Together these provide long-term information on the temporal and spatial variability of sea surface temperature in UK waters. On the other hand, sustained sub-surface temperature measurements are scarce, and this makes it difficult to observe long-term changes in the deep ocean.
Climate Projections
The UK Climate Projections for shelf seas project that rising sea temperatures will continue through the 21st Century. Increases in temperature of over 3°C for most of the North Sea, the English Channel, Irish and Celtic Seas are projected. For the deeper areas to the north and west of Scotland towards Rockall and the Faroe Shetland Channel the increase in temperature is projected to be closer to 2°C.
Results
The average sea surface temperature for UK waters in 2011-2015 continued to reflect the sustained warming trend observed for the previous assessment. However, the succession of cooler years (2010 - 2013) resulted in a slight decrease of this trend, which is estimated to be 0.28°C/decade over the period 1984-2014. The last years of the assessment (2011 - 2015) were warmer, with 2014 showing the largest positive anomaly (relative to 1981-2010) in the record (see Figure 1). The sea surface temperature anomalies for 2010 - 2016 are well correlated with the large-scale atmospheric variability over the North Atlantic measured by the NAO index, which was strongly negative in 2010 and 2013, and strongly positive in 2014, 2015 and 2016.
Trends in annual average sea surface temperature differ spatially (Figure 2), with the strongest trend occurring in the southern North Sea with 30-year warming rates of 0.45°C/decade. In the northern North Sea and Atlantic Northwest Approaches, sea surface temperatures have been warming at a rate of 0.3-0.4°C/decade. The slowest observed warming of 0.17°C/decade has been in the Celtic Sea.
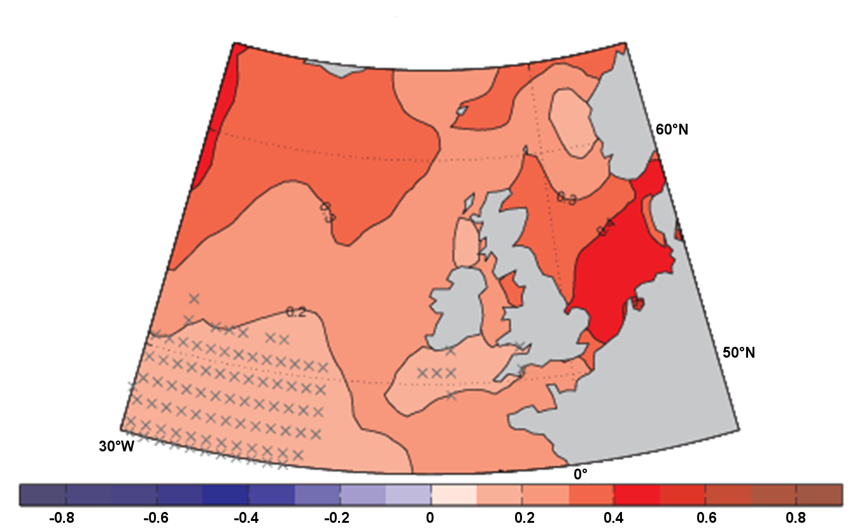
Figure 2. Trend in annual average sea surface temperature (°C/decade) from 1984 to 2014. Data are from the HadISST1.1 data set (Rayner and others, 2003). Hatched areas have a slope which is not significant at the 95% confidence level (alpha=0.05) using Mann-Kendall non-parametric test for a trend.
A detailed analysis of in-situ datasets (Figure 3) shows that the last 2 decades have been exceptionally warm. The recent cooling in 2010 and 2013 is clearly observed in the shallower stations in the Western Channel and those in the North Sea further from the influence of the North Atlantic. In many of the time series, 2014 was one of the warmest years on record, especially at the North Sea stations, but also in Malin Head and the Western Channel Observatory. In contrast to most of the time series, the in-situ observations affected by North Atlantic waters (Rockall Trough and the Faroe Shetland Channel) are experiencing a temperature decrease in the recent years, which seems to be related to the changing balance of the inflow of subtropical (warm and salty) versus subpolar (cool and fresh) water into the area (Holliday, 2003, Holliday and others, 2015).
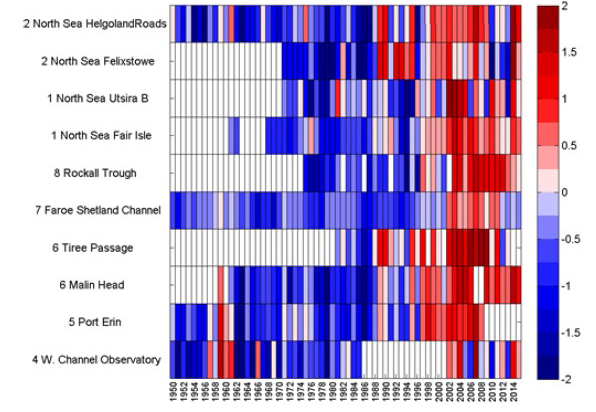
Figure 3. Normalised anomaly series for sea surface temperature calculated from selected in-situ timeseries, as published in Hughes and others. (2017). Anomalies are calculated relative to the period 1981-2010 and are normalised with respect to the standard deviation (for example: a value of +2 indicates 2 standard deviations above normal). Colour intervals 0.25; reds=positive/warm; blues=negative/cool.
Wintertime North Sea bottom water temperatures have generally risen over the last 2 decades, measurements between 1983 and 2012 show a typical warming of 0.2–0.5 °C/ per decade superimposed on considerable interannual variability.
Deep waters at 1700-2000m in Rockall Trough that originate in the Labrador Sea exhibit a general cooling between the 1970s and 2015. In the Faroe Shetland Channel, at about 800m depth, where water from the deep Norwegian Sea water is flowing south, there has been some warming since 1995, but the water is still cooler in 2015 than it had been in the 1950s, 1960s, and early 1980s.
Conclusions
The observed trend in surface temperature in UK waters continues to reflect the warming that was observed in the previous assessment (HM Government, 2012), although a series of cold winters resulted in much variability and slight decrease to this trend. Since 2014 seas have been warmer again.
Temperature has not risen equally across all UK waters. In general, warming was more intense in the shallower North Sea than in the western waters, the most rapid rise being observed in the Southern North Sea.
Knowledge gaps
Sea surface temperature is well covered by in-situ and remote-sensing observations, whereas sub-surface temperature observations are relatively sparse.
Our understanding of the interannual, decadal and long-term variability is based on long-time-series data which are missing for some places or broken in others. Gaps in assessments may be improved by combining models with historical observations to provide ‘reanalyses’ for future assessments.
Century-long projections of plausible future climate have become available for the shelf seas, but estimation of their uncertainty should be improved. Progress has been made towards seasonal and decadal forecasts, but this has not yet been translated into real predictions of the shelf sea climate.
References
The information, figures and all the results presented in this assessment has been extracted from the following reports:
Marine Climate Change Impacts Partnership Science Review 2017 for temperature:
Hughes SL, Tinker J, Dye DR and others (2017) ‘Temperature’ MCCIP Science Review 2017, 22-41, doi:10.14465/2017.arc10.003-tem (viewed on 15 January 2019)
Marine Climate Change Impacts Partnership Science Review 2013 for temperature:
Dye SR, Hughes SL, Tinker J, Berry DI, Holliday NP, Kent EC, Kennington K, Inall M, Smyth T, Nolan G, Lyons K, Andres O, Beszczynska-Möller A (2013) ‘Impacts of climate change on temperature (air and sea)’ MCCIP Science Review 2013, 1-12. doi:10.14465/2013.arc01.001-012 (viewed on 15 January 2019)
ICES Report on Ocean Climate 2015:
Larsen KMH, Gonzalez-Pola C, Fratantoni P, Beszczynska-Möller A, Hughes SL. (Editors) (2016). ‘ICES Report on Ocean Climate 2015’ ICES Cooperative Research Report Number 331, 79 pages (viewed on 15 January 2019)
Charting Progress 2 report for temperature and salinity:
UKMMAS (2010). ‘Temperature and Salinity’ Charting Progress 2 Feeder Report: Ocean Processes, Huthnance J (editor) Department for Environment Food and Rural Affairs on behalf of the UK Marine Science Co-ordination Committee (viewed on 15 January 2019)
North Sea Region Climate Change Assessment (NOSCCA):
Huthnance J and others (2016) ‘Recent Change—North Sea’. In: Quante M, Colijn F (editors) ‘North Sea Region Climate Change Assessment. Regional Climate Studies.’ Springer (viewed on 15 January 2019)
Other Cited literature
HM Government (2012) ‘Marine Strategy Part One: UK Initial Assessment and Good Environmental Status’ (viewed on 5 July 2018)
Holliday NP, Cunningham SA, Johnson C, Gary SF, Griffiths C, Read JF, Sherwin T (2015) ‘Multidecadal variability of potential temperature, salinity, and transport in the eastern subpolar North Atlantic’ Journal of Geophysical Research: Oceans, 120(9), pages 5945-5967. doi:10.1002/2015JC010762 (viewed on 15 January 2019)
Holliday NP (2003) ‘Air-sea interaction and circulation changes in the northeast Atlantic’, Journal of Geophysical Research: Oceans, 108, 3259. doi:10.1029/2002JC001344 (viewed on 15 January 2019)
Rayner NA, Parker DE, Horton EB, Folland CK, Alexander LV, Rowell DP, Kent EC, Kaplan A. (2003) ‘Global analyses of sea surface temperature, sea ice, and night marine air temperature since the late Nineteenth Century’ Journal of Geophysical Research: Oceans, 108(D14), 4407. doi:10.1029/2002JD002670 (viewed on 15 January 2019)
Acknowledgements
Assessment Metadata
Please contact marinestrategy@defra.gov.uk for metadata information