
Abundance and distribution of cetaceans other than coastal bottlenose dolphins
In the Greater North Sea, the UK abundance target of ‘no significant decline’ was met for minke whale. The abundance of harbour porpoise and white-beaked dolphin appeared to be stable, but uncertainty in the data meant a decline could not be ruled out. The range of harbour porpoise and minke whale has remained the same, but the centre of their distribution has shifted southwards. There was insufficient evidence to assess any other species in the North Sea or any species in the Celtic Seas.
Background
UK Target on changes in the abundance and distribution of cetaceans
Cetaceans found in UK waters are part of much larger populations whose range extends beyond UK waters. This indicator is used to assess progress against the following targets for population size and species distribution (combined for brevity below), which are set in the UK Marine Strategy Part One (HM Government, 2012):
“At the scale of the Marine Strategy Framework Directive Sub-Regions, the abundance of cetaceans is not decreasing and the distribution of cetaceans is not contracting as a result of human activity. In all of the indicators monitored, there should be no statistically significant decrease in abundance and no statistically significant contraction in the distribution of marine mammals caused by human activities.”
Key pressures and impacts
Historically, direct removal of individuals by hunting had severe effects on cetacean populations. Today, being caught in fishing nets (bycatch) is a major cause of death for small cetaceans. Other pressures such as chemical pollution and noise disturbance are known to affect individual animals, but the effects of these pressures on populations are not yet well understood.
Measures taken to address the impacts
Cetaceans are protected by many national, European and international conventions, agreements and regulations that aim to manage the impacts of human activities on their populations.
Monitoring, assessment, and regional co-operation
Areas that have been assessed
Cetaceans have huge geographic ranges and to understand their abundance and distribution properly it is important to include data from waters beyond those of the UK. This assessment is currently restricted to the Greater North Sea. Unfortunately, data for Irish waters was not available for the Celtic Seas assessment. An assessment of only the UK portion of the Celtic Seas Sub-Region would be misleading because cetaceans are very mobile and wide-ranging.
Monitoring and assessment methods
At least three abundance estimates are required to determine a trend and to assess the UK target with some degree of confidence. This was possible for white-beaked dolphins, minke whale, and harbour porpoise in the Greater North Sea only. The assessment used data collected during systematic large-scale surveys in 1994, 2005 and 2016, as well as some Norwegian data for minke whale. Two abundance estimates were available for a further six species (common dolphin, striped dolphin, bottlenose dolphin, fin whale, and long-finned pilot whale) and beaked whales as a group. These enabled only a low-confidence indicative assessment of these species.
Assessment thresholds
The target of ‘no statistically significant decrease in abundance’ was met if, over a ten-year period, the abundance of a species increased, or remained stable, or did not decline by 5% or more.
Regional cooperation
The UK assessment of this indicator is taken from the OSPAR Intermediate Assessment 2017 (OSPAR Commission, 2017) and uses data from the UK and other European countries.
Further information
Cetaceans make up an important component of marine biodiversity in the North-East Atlantic Ocean, as is clearly shown by their distribution and density. Data from the systematic large-scale surveys in 2005 the Small Cetaceans in the European Atlantic and North Sea II (known as SCANS II) and in 2007 the Cetacean Offshore Distribution and Abundance in the European Atlantic (known as CODA) and the Trans North Atlantic Sightings Survey (known as T-NASS) have been analysed using models that relate the density of species to features of their habitat to produce maps of predicted density distribution in the North-East Atlantic Ocean (Hammond and others ,2009; 2013). These maps indicate that cetaceans are distributed widely across this area and the relatively small amount of overlap in predicted high-use areas highlight how the different species use the marine area in different ways, at least in the summer when the surveys were conducted (Hammond and others ,2009; 2013). These and other similar data have been analysed to provide abundance estimates.
Results of these analysis show that whales, dolphins, and porpoises are abundant throughout the North-East Atlantic Ocean. Although 36 species of cetaceans have been recorded within the Greater North Sea, Celtic Seas and the Bay of Biscay and Iberian Coast (Waring and others, 2009), 29 of which occur in UK waters, many are widely dispersed oceanic species rarely seen in these waters and thus are very difficult to monitor systematically, regularly or frequently. Accordingly, this indicator assessment focuses on those species for which consistently robust information on abundance and distribution is available.
At least three separate abundance estimates are required over time to determine a trend and to assess the UK target with some degree of confidence. There were sufficient monitoring data to make a trend assessment for only three of these species: white-beaked dolphins (Lagenorhynchus albirostris), minke whale (Balaenoptera acutorostrata) and harbour porpoise (Phocoena phocoena). There were only two data points for the abundance of a further six species: the offshore population of bottlenose dolphin (Tursiops truncatus) (inshore populations of bottlenose dolphins are considered separately in the OSPAR Intermediate Assessment; OSPAR Commission, 2017), short-beaked common dolphin (Delphinus delphis), striped dolphin (Stenella coeruleoalba), fin whale (Balaenoptera physalus), long-finned pilot whale (Globicephala melas) and sperm whale (Physeter macrocephalus), and for several species of beaked whale (Ziphiidae) grouped together. An indicative assessment of these species was possible, but with very low confidence.
Anthropogenic pressures
Cetaceans are subject to a range of anthropogenic pressures, some of which have been shown to have negative impacts on individual animals, ranging from sub-lethal effects on reproduction and immune function to death. When pressures are widespread, the impacts on individuals may be seen at a population level (Hammond and others, 2008; MAGRAMA, 2012; JNCC 2013). Anthropogenic pressures on cetaceans include incidental bycatch in fishing gear (Silva and others, 2011; Arbelo and others, 2013; ICES, 2014a), collisions with ships (for example Laist and others, 2001; Panigada and others, 2006; Evans and others, 2011; Arbelo and others, 2013), underwater noise such as that generated by shipping or seismic activities (for example: Evans and Nice, 1996; Gordon and others, 2003; David, 2006; Arbelo and others , 2013; Jepson and others, 2013), prey depletion caused by overfishing, habitat loss or degradation, pollution (for example Berggren and others, 1999; Bennett and others , 2001; Beineke and others, 2005; Davison and others, 2011; Law and others, 2012; Méndez-Fernández and others , 2014a,2014b; Murphy and others , 2015; Jepson and others , 2016), marine debris (for example Laist, 1987; 1997; WDCS, 2011; ASCOBANS, 2013; Baulch and Perry, 2014; Lusher and others, 2015), pressures related to offshore development of oil, gas and renewable energy, including underwater noise as well as potential habitat loss or collision risk associated with installations (for example, Wilson and others, 2007; Bailey and others, 2014), and climate change (Evans and Bjørge, 2013).
The threats and pressures listed in Table 1 represent those thought to bear most relevance to marine mammals (ICES, 2015; OSPAR, 2012) in UK waters. Pressure and threat levels are classified as high, medium, or low and are assessed at the level of individual cetaceans and populations basis using the following criteria:
- High: strong evidence or likelihood of impact at the individual level on survival, health, or reproduction leading to population-level effects;
- Medium: strong evidence or likelihood of impact at individual level on survival, health, or reproduction but effect at the population-level is not clear;
- Low: possible negative impact on individuals but the evidence is weak and/or occurrences are infrequent.
- Other: little or no information on the impact on marine mammals or threat absent or irrelevant for a particular species.
Results reflect both regional differences in pressures and differences in species ecology or habitat. For example: species feeding on cephalopods are more likely to ingest plastic bags, beaked whales are particularly susceptible to mid-frequency long-signal sonar sound, and coastal species are generally exposed to higher levels of pollutants.
Table 1. Threat matrix for wide-ranging cetaceans in the OSPAR Maritime Area. The risk is defined as the likelihood of negative population effects as a result of effects on individual mortality, health or reproduction. H = high risk; M = medium risk; L = low risk.
|
|
Harbour porpoise |
Common dolphin |
White-beaked dolphin |
Atlantic white-sided dolphin |
Fin whale |
Minke whale |
Long-finned pilot whale |
Offshore bottlenose dolphin |
|
|
Pollution and other chemical changes |
|||||||||
|
Contaminants |
H |
M |
M |
M |
L |
L |
M |
M |
|
|
Nutrient enrichment |
L |
L |
L |
L |
L |
L |
L |
L |
|
|
Physical loss |
|||||||||
|
Habitat loss |
L |
L |
L |
L |
L |
L |
L |
L |
|
|
Physical damage |
|||||||||
|
Habitat degradation |
L |
L |
L |
L |
L |
L |
L |
L |
|
|
Other physical pressures |
|||||||||
|
Litter (including microplastics and discarded fishing gear) |
L |
L |
L |
L |
L |
M |
L |
L |
|
|
Underwater noise changes |
Military Sonar |
M |
M |
M |
M |
M |
M |
M |
M |
|
Seismic surveys |
M |
M |
M |
M |
M |
M |
M |
M |
|
|
Pile-driving |
M |
M |
M |
M |
M |
M |
M |
M |
|
|
Shipping |
M |
M |
M |
M |
M |
M |
M |
M |
|
|
Barrier to species movement (offshore wind farm, wave or tidal device arrays) |
L |
L |
L |
L |
L |
L |
L |
L |
|
|
Death or injury by collision |
with ships |
L |
L |
L |
L |
M |
M |
L |
L |
|
with tidal devices |
Risk of collision leading to death or injury is considered possible, but no evidence of such an occurrence to date for these species. |
||||||||
|
Biological pressures |
|||||||||
|
Introduction of microbial pathogens |
L |
L |
L |
L |
L |
L |
L |
L |
|
|
Removal of target and non-target species (prey depletion) |
M |
L |
L |
L |
L |
L |
L |
L |
|
|
Removal of non-target species (bycatch) |
H |
H |
L |
L |
L |
M |
L |
L |
|
|
Disturbance (e.g. wildlife watching) |
L |
L |
L |
L |
L |
L |
L |
L |
|
|
Deliberate killing + hunting |
Does not occur (white sided dolphins were hunted in the Faroe Islands at least until 2010) |
||||||||
Historical data on abundance and distribution
Before 1980, there is very little information on the distribution of any species of cetacean in the North East Atlantic and no information on their abundance. Data on strandings have been recorded for more than 100 years, but these can provide only limited information on the presence of offshore species. It is not possible to use stranding data to infer population trends without additional information on causes of death, search effort and drifting of dead animals. In some cases, stranding data can provide some information about distribution, such as with harbour porpoises, for which the stranding numbers increased in the southern North Sea due to a shift in distribution between 1995 and 2005.
Assessment method
Data
The data used to infer species distribution and to estimate abundance are mostly derived from large-scale aerial and shipboard surveys:
- SCANS (Small Cetacean Abundance in the North Sea; Hammond and others, 2002),
- SCANS-II (Small Cetacean Abundance in the European Atlantic and the North Sea; Hammond and others, 2013),
- CODA (Cetacean Offshore Distribution and Abundance in the European Atlantic; Hammond and others, 2009) and
- SCANS-III (Hammond and others, 2017).
The results of other large-scale surveys using similar survey methods have also been used:
- North Atlantic Sightings Surveys (NASS);
- Norwegian Independent Line Transect Surveys (NILS) for minke whales, for example Solvang and others, 2015 (unpublished).
Smaller-scale (mostly national) surveys have been conducted using identical or similar methods for example in Belgium, Denmark, France, Germany, the Netherlands, Sweden; Gilles and others, 2016; Laran and others, 2017; Scheidat and others, 2008; Viquerat and others, 2014). While large-scale surveys provide information on distribution and abundance over a large area, they are not undertaken very often, and only in summer months. The smaller-scale surveys are undertaken more often, and sometimes reveal seasonal patterns at the local scale.
UK thresholds
Abundance
The UK target for cetacean abundance and distribution (HM Government, 2012) was met if the abundance of a species was increasing, or stable, or did not decline; where
- ‘increasing’ means an increasing trend of greater than or equal to 5% over ten-years (significance levels, p value of 0.05)
- ‘stable’ means population changes of less than 5% over ten-years, and
- ‘decline’ means a decreasing trend of greater than or equal to 5% over ten-years (significance levels, p value of 0.05).
The above thresholds were derived from the International Union for the Conservation of Nature criterion to detect a 30% decline over three generations for a species, which equates to slightly less than 0.5% per year for odontocetes (IUCN, 2012). For most species, only two abundance estimates were available, so a robust assessment of a trend involving a change from a baseline was not possible. For harbour porpoise and white-beaked dolphin in the Greater North Sea, three estimates were available (Small Cetaceans in European Atlantic Waters and the North Sea I, II and III) so that an indicative assessment was possible. For minke whale, there was a more robust time series with eight abundance estimates available in the Greater North Sea from Small Cetaceans in European Atlantic Waters and the North Sea and Norwegian surveys from 1989 to 2016.
Species Distribution
The survey data were analysed using models that relate the density of species to features of their habitat to produce maps of predicted density distribution in the North-East Atlantic Ocean. For recent data for which results from density surface models are not yet available, maps of observed sightings provide information on distribution.
Baselines
Although the baseline should ideally be derived from historical data prior to human influence, these are not available for any cetacean species. Even where numbers are suspected to have declined (for example, due to commercial whaling through the 19th and 20th centuries), it is unlikely that they could be restored in today’s different marine environment. Consequently, a recent baseline must be used, which should then be assessed as a normal situation, or one that is already known to be degraded. The most useful baselines for wide-ranging cetacean species derive from the results of large-scale surveys, which started in 1994 (Hammond and others, 2002; 2009; 2013).
Power analysis
Regular surveillance of abundance and distribution are the main requirements to assess conservation status. Power analysis can be used to determine whether a survey has a good chance of producing a statistically significant result if a biologically significant difference existed in a population. The statistical power of a survey programme is the probability that the monitoring will detect a trend in the data despite the ‘noise’ associated with seasonal cycles and other fluctuations (Nichols and Williams, 2006). Power analyses were performed for species for which there are three or more comparable estimates of regional abundance from Small Cetaceans in European Atlantic Waters and the North Sea and other surveys, using previously estimated coefficients of variation. Where surveys are less frequent, it is possible to detect trends, but only over much longer time frames. Detection of trends ≥ 5% of the abundance within a ten-year period would require annual monitoring. This has consequences for the magnitude of the change that must occur in order to be detected and the period that must elapse before the detection occurs (Table 2).
Table 2. Effect of survey interval on power to detect a trend of ≥ 5% decline per year.
|
Species |
Survey interval (years) |
Number of surveys required |
Number of years to detection |
Effective percentage change in population per survey interval |
|
Harbour porpoise |
1 |
5 |
4 |
5.0 |
|
3 |
3 |
6 |
15.7 |
|
|
6 |
3 |
12 |
34.0 |
|
|
10 |
2 |
10 |
62.9 |
|
|
White-beaked dolphin |
1 |
6 |
5 |
5.0 |
|
3 |
4 |
9 |
15.7 |
|
|
6 |
4 |
18 |
34.1 |
|
|
10 |
3 |
20 |
62.9 |
The datasets consisted of abundance estimates from three surveys over 22 years for harbour porpoise, three surveys over 22 years for white-beaked dolphin, and eight surveys over 27 years for minke whale. These data have 80% power (the conventional acceptable level) to detect an annual rate of change, at a significance level (p value) of 0.05, of 1.5% for harbour porpoise, 2.5% for white-beaked dolphin, and 0.5% for minke whale. Therefore, the data on minke whale were sufficient to detect a decline of > 5% over ten-years and assess against the UK target in the Greater North Sea. The three abundance estimates for harbour porpoise and white-beaked dolphins in the Greater North Sea were only able to detect declines of over 33% and 68% respectively over the 22-year time frame. Therefore, the UK target could not be assessed with confidence for harbour porpoise and white-beaked dolphin.
Reanalysis of all Cetaceans in European Atlantic Waters data
The following is a technical explanation for the reanalysis of Small Cetaceans in European Atlantic Waters and the North Sea (SCANS, 1994) and Small Cetaceans in European Atlantic Waters and the North Sea (SCANS-II; 2005) data.
SCANS-III surveyed the entire European continental shelf by aerial survey, except for the Kattegat and Belt Seas area, which were surveyed by ship. Most of these waters were surveyed by ship in SCANS and SCANS-II while SCANS-III was largely conducted using aerial surveys. Methodologies employed for large-scale ships (the two-team “tracker” method) and aerial survey the circle-back method should generate unbiased estimates of abundance for most species including the harbour porpoise, dolphin species, and minke whale so estimates for these species from ship and aerial surveys are, therefore, comparable. However, there is a choice of two models to estimate the probability of detection of animals on the transect line when the two-team ‘tracker’ method has been employed on a ship survey:
- The first method, called the ‘point (or track line) independence model,’ provides estimates of abundance incorporating estimates of the probability of detection of animals on the transect line, known as g(0), which is assumed to be 1 in conventional line transect analysis. In this method, a detection function is fitted to the primary team data to estimate average detection probability assuming g(0) = 1, and a second detection function is fitted to primary detections conditional on those detections being first seen by the tracker team to estimate g(0). This is the preferred and more robust model for two-team ‘tracker’ data analysis.
- The other method, called ‘the full independence model’, fits the second conditional detection function but does not fit the first. This model should be used to correct for bias introduced when there is a movement of animals in response to the approaching survey ship (termed responsive movement). However, it is not a robust model and tends to underestimate abundance because of non-independence in tracker and primary sightings.
The full independence model was used to estimate abundance of all species from the ship surveys in SCANS in 1994 and SCANS-II in 2005. The point independence model had not yet been developed in 1994. In 2005, there was weak evidence of responsive movement for some species, so a cautious approach was adopted at the time, leading to estimates that were likely negatively biased (lower). However, this creates a problem of comparison with estimates between SCANS, SCANS-II and SCANS-III in any assessment of trend. Aerial surveys are not subject to responsive movement and the circle-back methods used should be unbiased. In SCANS-III, there was no evidence of movement of animals in response to the survey ships so the more robust point independence detection function model was used for all species.
The solution implemented for this assessment has been to reanalyse the SCANS and SCANS-II data using the more robust point independence model so that estimates are comparable between 1994, 2005, and 2016. The result is that estimates for 1994 and 2005 for most species published in Hammond and others, 2002 and 2013 have been revised (see Hammond and others , 2017).
Results
Findings from the 2012 UK Initial Assessment
In 2012, using expert judgement, cetaceans were assessed to be in good condition in the Greater North Sea and in moderate condition in the Celtic Seas (HM Government, 2012).
Latest Findings
The Small Cetaceans in European Atlantic Waters and the North Sea SCANS III survey in 2016 yielded the most recent population abundance estimates for nine cetacean species that regularly occur in UK waters and for beaked whales as a group. To assess changes in abundance, however, at least three estimates are required through time. Before 2016, two or more comparable estimates of abundance were available only for harbour porpoise, white-beaked dolphin, and minke whale in the Greater North Sea. Numbers of all three species appear to have remained stable since the early 1990s (Figure 1). But the data on minke whale only were sufficient to detect the equivalent of the decline of > 5% over ten-years, to determine that the UK target for minke whale was met in the Greater North Sea. The three abundance estimates for harbour porpoise and white-beaked dolphins in the Greater North Sea were only able to detect declines of over 33% and 68% respectively over the 22-year time frame. Therefore, a decline in numbers of harbour porpoise and white-beaked dolphin could not be ruled out and the UK target could not be assessed with confidence for these two species.
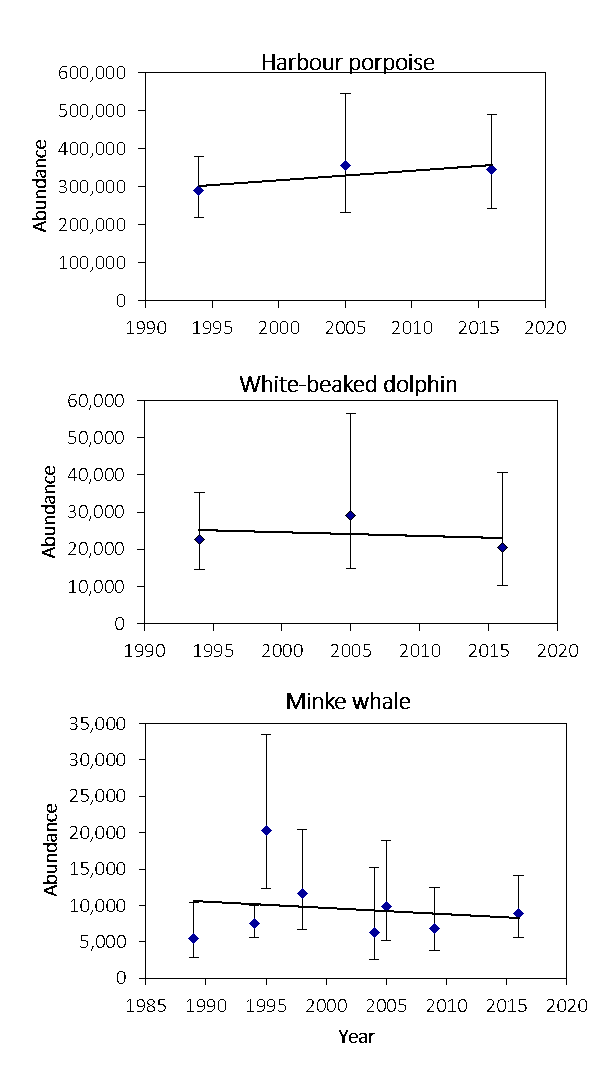
Figure 1. Linear trendlines fit to harbour porpoise, white-beaked dolphin, and minke whale abundance estimates in the North Sea. Vertical bars show 95% confidence intervals. The abundance of all three species has been stable with no evidence of any decline over the last 30 years, demonstrating that the UK target has been met for these species.
For the other six species, it was not possible to assess with any confidence whether populations were decreasing, stable or increasing. Despite this, the most recent estimates of abundance in 2016 were similar to or larger than previous estimates made in comparable areas.
Comparisons of distribution in harbour porpoises between the SCANS and SCANS–II data sets show a marked difference in summer distribution, with a southern shift in the main concentrations of animals between 1994 and 2005 (Figure 2). This shift in distribution is supported by data from smaller scale surveys, which show increasing numbers of porpoises occurring in French, Belgian, Dutch, and German waters and decreasing numbers in the northern North Sea. The shift in distribution is believed to be related to changes in prey distribution or abundance.
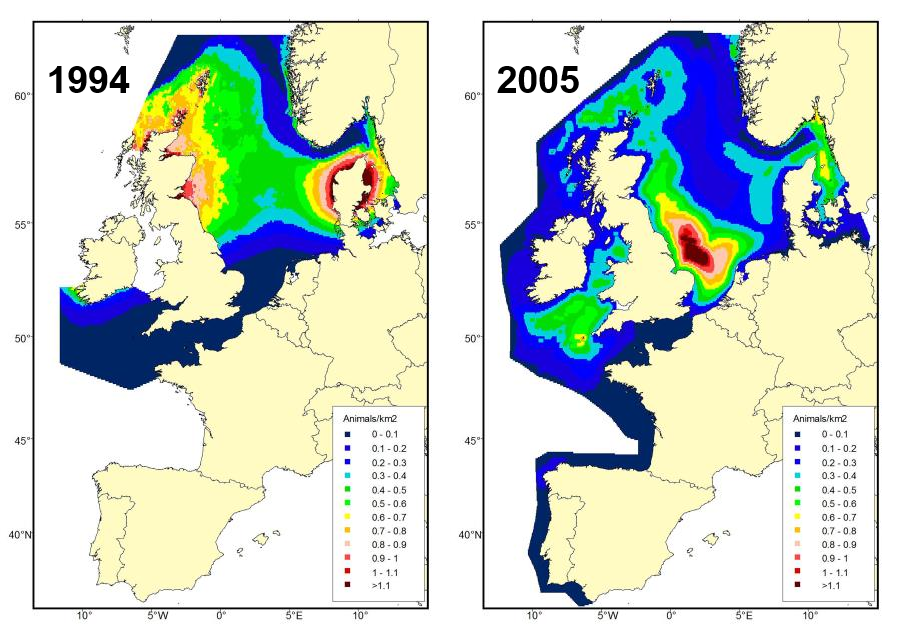
Figure 2. Predicted density surfaces for harbour porpoise produced using the Small Cetaceans in European Atlantic Waters and the North Sea SCANS data in 1994 (left) and using the Small Cetaceans in European Atlantic Waters and the North Sea (SCANS-II data in 2005 (right) (Hammond and others, 2013).
Data from the Small Cetaceans in European Atlantic Waters and the North Sea (SCANS-III) survey in 2016 have not yet been analysed to generate density surfaces, but the pattern of estimated density in survey blocks (Hammond and others, 2017) show that this shift has been maintained (Figure 3). More sightings were made throughout the Channel in 2016 than in previous surveys.
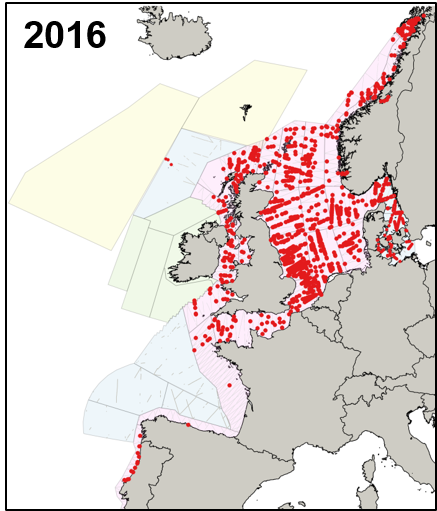
Figure 3. Sightings of harbour porpoise in 2016 from the Small Cetaceans in European Atlantic Waters and the North Sea survey (SCANS-III; Hammond and others, 2017). The area in green to the west of Ireland was surveyed in the summer of 2016 by the Irish ObSERVE project but data were not yet available at the time of this assessment. The area in yellow was surveyed in the summer of 2015 by the North Atlantic Sightings Surveys project.
There is moderate confidence in the methodology and low confidence in the data availability.
Further information
The SCANS III survey in 2016 yielded the most recent population abundance estimates for ten cetacean species that regularly occur in UK waters (Hammond and others, 2017). These estimates of abundance are similar to or larger than previous estimates made in comparable areas (Table 3).
Table 3. European Atlantic abundance estimates from the SCANS III survey in 2016 (excluding Irish waters) and SCANS II and CODA surveys in 2005 and 2007. Coefficient of variation (CV) values are given in brackets. For beaked whales all species were combined to obtain a population estimate due to the paucity of sightings. Values marked 1 are animals that could not be identified specifically as common or striped dolphins which occur in the same general area and often in mixed schools. Values marked 2 are revised from Hammond and others, 2013; in Hammond and others, 2017.
|
Species |
2016 Estimate (CV) (from Hammond and others, 2017), excluding Irish waters. |
2005/2007 Estimate (CV) (from Hammond and others 2009 or 2013) |
|
Harbour porpoise |
442,000 (0.15). |
519,900 (0.21)2 |
|
Common dolphin |
467,673 (0.26) |
54,955 (0.21)2 |
|
Common + striped dolphins1 |
998,180 (0.18) |
306,000 (0.29) |
|
Striped dolphin |
372,340 (0.33) |
61,400 (0.93) |
|
White-beaked dolphin |
36,287 (0.29) |
37,689 (0.36)2 |
|
Bottlenose dolphin |
27,697 (0.23) |
16,641 (0.42)2 |
|
Fin whale |
18,142 (0.38) |
- |
|
Minke whale |
13,101 (0.35) |
15,249 (0.31)2 |
|
Long-finned pilot whale |
20,656 (0.40). This excludes a substantial area of high-density west of Ireland identified in 2005/07. |
124,000 (0.35) |
|
Sperm whale |
9,599 (0.41) |
5,600 (0.32) |
|
Beaked whales (all species) |
11,618 (0.61) |
12,900 (0.31) |
Harbour porpoise
Harbour porpoises are distributed throughout the shelf waters of the Greater North Sea, Celtic Seas, and the Bay of Biscay and Iberian Coast. The Iberian Peninsula constitutes a separate population (Fontaine and others, 2007), while all other areas except for the Kattegat/Belt Seas are sub-areas of the North-East Atlantic/Greater North Sea population. The area around the northern border of the Kattegat/Belt Seas most likely contains a mix of two different populations (Sveegaard and others, 2015).
The presence of harbour porpoises has been found to be influenced by both oceanographic and anthropogenic pressure variables. Water depth, surface salinity, temperature differences in the water column, eddy activity, current speed, coarseness of surface sediments, seabed slope and the density of shipping have been identified as relevant influencing factors, although these relationships vary by regional sea (Booth and others, 2013; Embling and others, 2010; Pierpoint, 2008; Marubini and others, 2009; Isojunno and others , 2012; Heinänen and Skov, 2015).
The abundance of harbour porpoise from the 2005 SCANS-II survey for the European Atlantic region was estimated to be 519,900 (confidence value: 0.21) animals (revised from Hammond and others, 2013). Animals were least common in the more offshore survey blocks to the west of Scotland and Ireland. A few sightings of harbour porpoises were made in offshore waters over the Rockall Bank in the 2007 Cetacean Offshore Cetacean Offshore Distribution and Abundance in the European Atlantic survey (CODA) and SCANS-III in 2016 (Hammond and others, 2017). Estimated abundance in 1994 for the North Sea, the Skagerrak, Kattegat and Belt Seas, and the Celtic Seas was 407,200 (confidence value: 0.18) animals (revised from Hammond and others, 2002). In 2016, there were an estimated 442,000 (confidence value: 0.15) harbour porpoise in the same area surveyed in 2005, except waters to the west of Ireland. Ireland conducted aerial surveys of cetaceans in 2015 to 2017 (as part of the ObSERVE Programme), data from which were not available for use in this assessment.
In the Greater North Sea Assessment Unit, the estimate in 2016 (345,000, confidence value: 0.18) is very similar to the estimate in 2005 (355,000, confidence value: 0.22; revised from Hammond and others, 2013), and slightly larger than the estimate for 1994 (289,000, confidence value: 0.12; revised from Hammond and others, 2002). It is also similar to the model-based estimate using data from 2005 to 2013 of 361,000 (confidence value 0.20; Gilles and others, 2016). A trend line fit to the 1994, 2005 and 2016 estimates gives an estimated increase of 0.8% (95% confidence interval: -6.8% to 9.3%) per year, p = 0.42 (Figure 1). But the power to detect trends from these data was relatively low: over the 22-year time frame, approximately 33% of the harbour porpoise population would need to disappear before we could detect a decline from these three surveys. While the abundance of harbour porpoise appeared to be stable or increasing slightly, uncertainty in the data meant a decline could not be ruled out. Therefore, the UK target could not be assessed with confidence for harbour porpoise in the Greater North Sea.
In the West Scotland Assessment Unit, the estimates of 24,400 (confidence value 0.23) for 2016 and 26,300 (confidence value: 0.37) for 2005 (revised from Hammond and others, 2013) are very similar, but the southern part of the Assessment Unit was covered in 2016 by the Irish ObSERVE project and information for this area is not yet available.
White-beaked dolphin
White-beaked dolphins have been shown to prefer water temperatures of 13°C or less (Macleod and others, 2008). They prefer waters of 50 to 100 m depth (Reid and others, 2003). They are found predominantly in the northern part of the Greater North Sea, and Celtic Seas and have only been recorded as vagrants in the Bay of Biscay and Iberian Coast (Figure 4). Since the early 1990s, a small resident group has been observed utilising Lyme Bay (Channel) (Brereton and others, 2016). From the pattern of sightings from the SCANS, SCANS-II and SCANS-III surveys, the distribution of white-beaked dolphins does not appear to have changed since 1994 (Hammond and others, 2002; 2013; 2017).
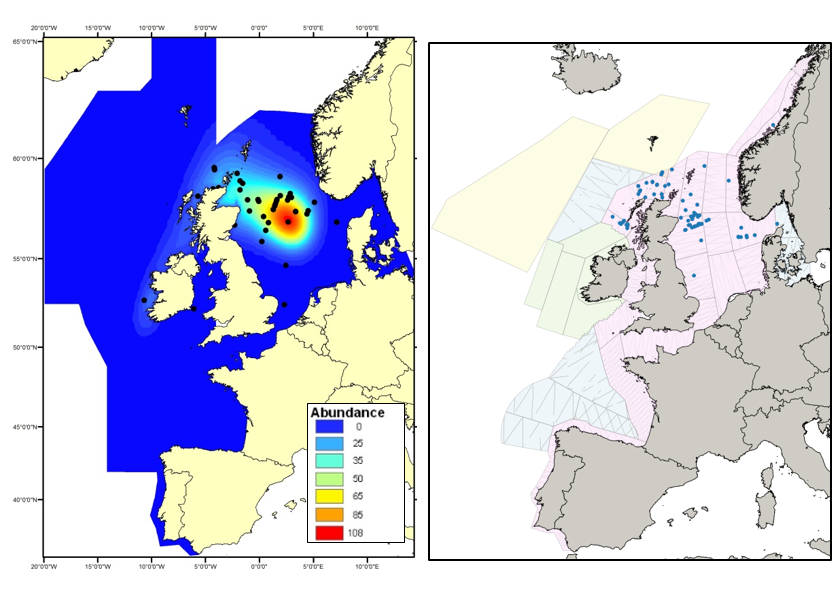
Figure 4. Left: predicted density surface for white-beaked dolphin from CODA (Cetacean Offshore Distribution and Abundance in the European Atlantic), Small Cetaceans in European Atlantic Waters and the North Sea II (SCANS-II) and North Atlantic Sighting Surveys (T-NASS) data. Right: sightings of white-beaked dolphins in 2016 from the Small Cetaceans in European Atlantic Waters and the North Sea III (SCANS-III) survey (Hammond and Others 2017). The area in green to the west of Ireland was surveyed in summer 2016 by the Irish ObSERVE project but data were not yet available at the time of this assessment. The area in yellow was surveyed in the summer of 2015 by the North Atlantic Sightings Surveys project.
Estimates of abundance for the single Assessment Unit for white-beaked dolphin are available for 1994, 2005, and 2016. Estimated abundance in 1994 was 23,700 (confidence value: 0.30) animals (revised from Hammond and others, 2002) but this estimate did not include waters to the west of Scotland. Estimated abundance in 2005 was 37,700 (confidence value: 0.36) animals (revised from Hammond and others, 2013). Estimated abundance in 2016 was 36,300 (confidence value: 0.29) (Hammond and others, 2017). The highest estimated densities in 2005 and 2016 were found around western Scotland and in the northern North Sea. Estimates of abundance in the North Sea for 1994, 2005 and 2016 show an increase from 22,600 (confidence value: 0.23) in 1994, to 29,000 (confidence value: 0.35) in 2005, to 20,500 (confidence value: 0.36) in 2016. A trend line fit to these three estimates gives an estimated decrease of 0.5% (95% confidence interval: -18 % to 22 %) per year, p = 0.82 (Figure 1). But the power to detect trends from these data was relatively low: over the 22-year time frame, approximately 68 % of the white-beaked dolphin population would need to disappear before we could detect a decline from these three surveys. While the abundance of white-beaked dolphin appeared to be stable, uncertainty in the data meant a substantial decline could not be ruled out. Therefore, the UK target could not be assessed with confidence for white-beaked dolphin in the Greater North Sea.
Minke whale
Minke whales occur both on and off the shelf of the North-East Atlantic (Reid and others, 2003; Evans and others, 2003). There is some evidence that minke whale distribution shifted south between 1994 and 2005 (Hammond and others, 2013); the pattern of sightings from the SCANS-III survey shows that this has been maintained (Hammond and others, 2017). Minke whales have rarely been recorded in the Bay of Biscay and Iberian Coast (Figure 5).
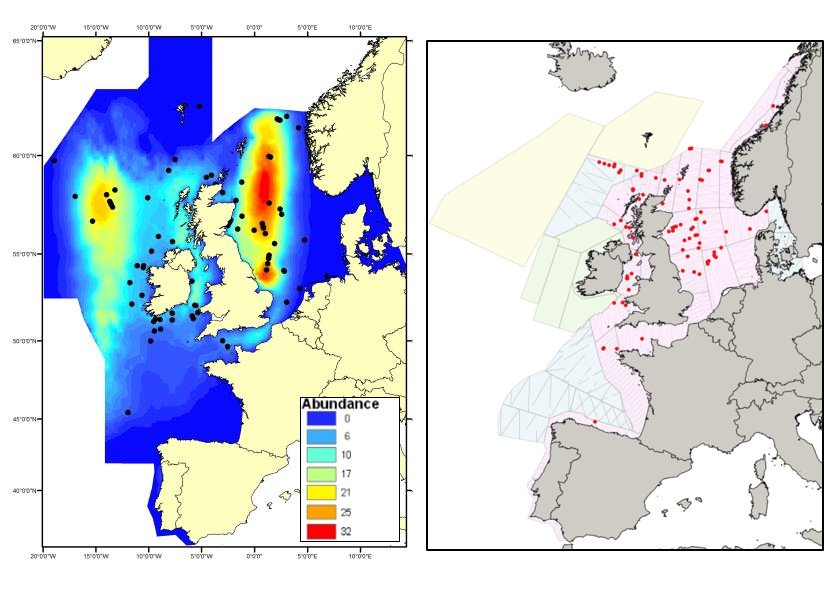
Figure 5. Left: predicted density surface for minke whale from CODA (Cetacean Offshore Distribution and Abundance in the European Atlantic), Small Cetaceans in European Atlantic Waters and the North Sea II (SCANS-II) and, North Atlantic Sighting Surveys (T-NASS) data. Right: sightings of minke whale in 2016 from the Small Cetaceans in European Atlantic Waters and the North Sea III (SCANS-III) survey (Hammond and others, 2017). The area in green to the west of Ireland was surveyed in summer 2016 by the Irish ObSERVE project but data were not yet available at the time of this assessment. The area in yellow was surveyed in the summer of 2015 by the North Atlantic Sightings Surveys project.
A single Assessment Unit has been described for minke whale in the region. Abundance has been estimated in parts of this area from the Small Cetaceans in European Atlantic Waters and the North Sea surveys (SCANS, SCANS-II, SCANS III) and Cetacean Offshore Distribution and Abundance in the European Atlantic (CODA) survey, and also from Norwegian Independent Line Transect Surveys (NILS) in the North Sea, and Aerial Monitoring of Marine Megafauna (Suivi Aérien de la Mégafaune Marine: SAMM) surveys in the Channel and Bay of Biscay. Despite the more recent Small Cetaceans in European Atlantic Waters and the North Sea III (SCANS-III) survey, the most comprehensive estimate for the whole Assessment Unit remains that from 2005 to 2007 from the Small Cetaceans in European Atlantic Waters and the North Sea II (SCANS-II) and Cetacean Offshore Distribution and Abundance in the European Atlantic (CODA) surveys combined of 26,800 (confidence value: 0.35) animals (revised from Hammond and others, 2011) as a substantial area of high density west of Ireland surveyed in 2005 to 2007 is not included in the 2016 estimate of 13,100 (confidence value: 0.35).
In the North Sea, there is now a series of eight estimates of abundance from 1989 to 2016. These all relate to the area south of 62°N in Norwegian waters, although earlier estimates only relate to waters between 56°N and 61°N. The most recent Norwegian estimate for 2009 does include waters south of 56°N, but there was little effort in the southern/central North Sea, where around 20-30% of the abundance was estimated from the Small Cetaceans in European Atlantic Waters and the North Sea surveys II and III (SCANS-II and SCANS-III) in 2005 and 2016. A trend line fit to these eight estimates gives an estimated trend of -0.025% (95 % confidence interval: -4.8% to 4.6%) per year, p = 0.90 (Figure 1). These data were sufficient, over a 27-year period, to detect the equivalent of a decline of > 5% over ten-years (in other words, an 80% power to detect a trend of 0.5% per year) and assess against the UK target. Therefore, we can conclude with confidence that there is no evidence of a change in abundance over the period 1994 to 2016 and that the UK target was met for minke whale in the Greater North Sea. This assessment was made with only medium confidence because an assessment of this species should ideally be based on data from across their range in the European Atlantic.
Aerial Monitoring of Marine Megafauna (Suivi Aérien de la Mégafaune Marine: SAMM) estimates in 2011 to 2012 for the Channel and Biscay area were 5,200 (confidence value: 0.33) animals in summer and 363 (confidence value: 1.02) in winter.
Common dolphin
Common dolphins in the North-East North Atlantic are distributed widely in Celtic Seas, the Bay of Biscay and Iberian Coast and the Wider Atlantic (Reid and others, 2003; Murphy and others, 2013). Sightings in the Greater North Sea are thought to be associated with the North Atlantic Oscillation and incursion of warmer water into the northern North Sea (Murphy and others, 2013). On the Small Cetaceans in European Atlantic Waters and the North Sea surveys II and III (SCANS-II and SCANS-III), there were no sightings in the Greater North Sea, but there were many sightings throughout the southern part of the Celtic Seas and the Bay of Biscay and Iberian Coast (Figures 6 and 7). There appears to have been a substantial increase in the number of common dolphins between 2005 to 2007 and 2016. One potential explanation could be large-scale inter-annual variation in distribution in the species, whose range extends beyond the surveyed areas.
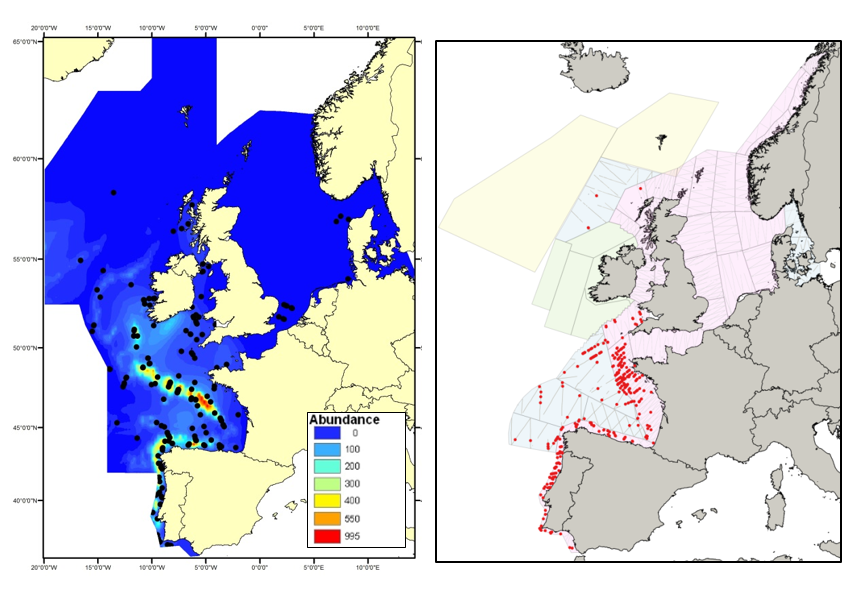
Figure 6: Left: predicted density surface for common dolphin from CODA (Cetacean Offshore Distribution and Abundance in the European Atlantic), Small Cetaceans in European Atlantic Waters and the North Sea II (SCANS-II) and, North Atlantic Sighting Surveys (T-NASS) data. Right: sightings of common dolphin in 2016 from the Small Cetaceans in European Atlantic Waters and the North Sea III (SCANS-III) survey (Hammond and others, 2017). The area in green to the west of Ireland was surveyed in summer 2016 by the Irish ObSERVE project but data were not yet available at the time of this assessment. The area in yellow was surveyed in the summer of 2015 by the North Atlantic Sightings Surveys project.
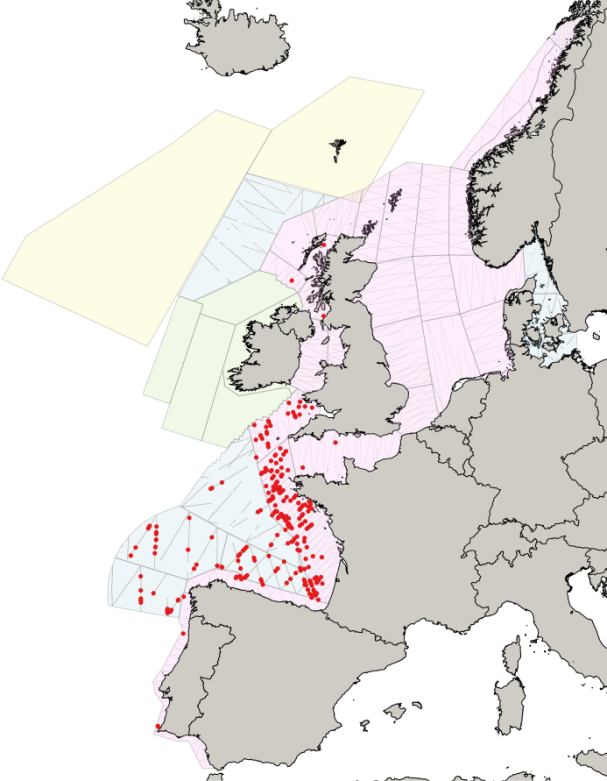
Figure 7. Sightings of unidentified common or striped dolphins in 2016 from the Small Cetaceans in European Atlantic Waters and the North Sea III (SCANS-III) survey (Hammond and others, 2017). The area in green to the west of Ireland was surveyed in summer 2016 by the Irish ObSERVE project but data were not yet available at the time of this assessment. The area in yellow was surveyed in the summer of 2015 by the North Atlantic Sightings Surveys project.
Striped dolphin
Striped dolphins have been found to prefer specific water temperatures of 21 to 24°C within the Mediterranean Sea (Panigada and others, 2008). Within the area considered, they are generally found only within the southern part of the Celtic Seas and in the Bay of Biscay, and Iberian Coast, primarily in waters off the shelf (Hammond and others, 2009; Hammond and others, 2017; Figure 8). There appears to have been a substantial increase in the number of striped dolphins between 2005 to 2007, and 2016. The range of striped dolphins extends well beyond the area surveyed. One potential explanation could be large-scale inter-annual variation in the distribution of the species, whose range extends beyond the surveyed areas.
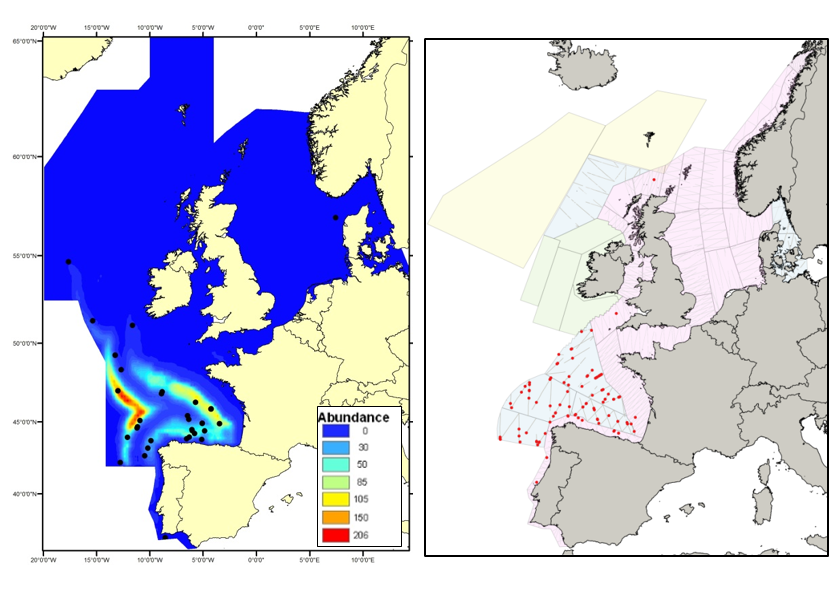
Figure 8: Left: predicted density surface for striped dolphin from CODA (Cetacean Offshore Distribution and Abundance in the European Atlantic), Small Cetaceans in European Atlantic Waters and the North Sea II (SCANS-II) and, North Atlantic Sighting Surveys (T-NASS) data. Right: sightings of striped dolphins in 2016 from the Small Cetaceans in European Atlantic Waters and the North Sea III (SCANS-III) survey (Hammond and others, 2017). The area in green to the west of Ireland was surveyed in summer 2016 by the Irish ObSERVE project but data were not yet available at the time of this assessment. The area in yellow was surveyed in the summer of 2015 by the North Atlantic Sightings Surveys project.
Common dolphin and striped dolphin abundance
It is pertinent to consider both dolphin species together because they mostly occur in the same general areas, sometimes in mixed schools and because they are difficult to distinguish in the field, which leads to a high proportion of sightings unidentified to species. The most comprehensive abundance estimates of these two species in the region are from Small Cetaceans in European Atlantic Waters and the North Sea II (SCANS-II) in 2005, Cetacean Offshore Distribution and Abundance in the European Atlantic (CODA) in 2007 and from Small Cetaceans in European Atlantic Waters and the North Sea III (SCANS-III) in 2016.
For the Assessment Unit that covers the Greater North Sea, Celtic Seas and the Bay of Biscay and Iberian Coast, an abundance of common dolphins was estimated as 174,000 (confidence value: 0.27) in 2005/2007 and 468,000 (confidence value: 0.26) in 2016 (Table 3). The equivalent figures for striped dolphins are 61,400 (confidence value: 0.93) in 2005 to 2007 and 372,000 (confidence value: 0.33) in 2016 (Table 3). For both common and striped dolphins, including sightings unidentified to species, the estimates are 306,000 (confidence value: 0.29) in 2005 to 2007 and 998,000 (confidence value: 0.18) in 2016. The estimates from Small Cetaceans in European Atlantic Waters and the North Sea III (SCANS-III) in 2016 are thus considerably greater than those from 2005 and 2007. One potential explanation could be large-scale inter-annual variation in distribution in these species, whose range extends beyond the surveyed areas.
The estimate of common and striped dolphins in summer 2012 from the Aerial Monitoring of Marine Megafauna (Suivi Aérien de la Mégafaune Marine: SAMM) surveys in the Channel and French waters in the Bay of Biscay was 696,000 animals. The survey area did not include Spanish waters that were included in Small Cetaceans in European Atlantic Waters and the North Sea III (SCANS-III) in 2016 and the estimate was not corrected for animals missed on the transect line. These 2016 and 2012 surveys, therefore, appear to be compatible.
Offshore bottlenose dolphin
Bottlenose dolphins are widely distributed in offshore waters of the North-East Atlantic (Reid and others, 2003; SCANS-II; Hammond, 2009; and SCANS-III surveys; Figure 9). In comparison to the coastal populations, little is known about the animals in these offshore waters. The Small Cetaceans in European Atlantic Waters and the North Sea II (SCANS-II) and Cetacean Offshore Distribution and Abundance in the European Atlantic (CODA) surveys in 2005 and 2007 and the Small Cetaceans in European Atlantic Waters and the North Sea III (SCANS-III) survey in 2016 covered almost all shelf waters and offshore waters of the region. The estimates from these surveys thus relate primarily to the Oceanic Waters Assessment Unit but also include Assessment Units inhabited by coastal bottlenose dolphin populations, although little survey effort was conducted in any of these coastal Assessment Units. Estimated abundance was 35,900 (confidence value: 0.21) in 2005 to 2007 and 27,700 (confidence value: 0.23) in 2016.
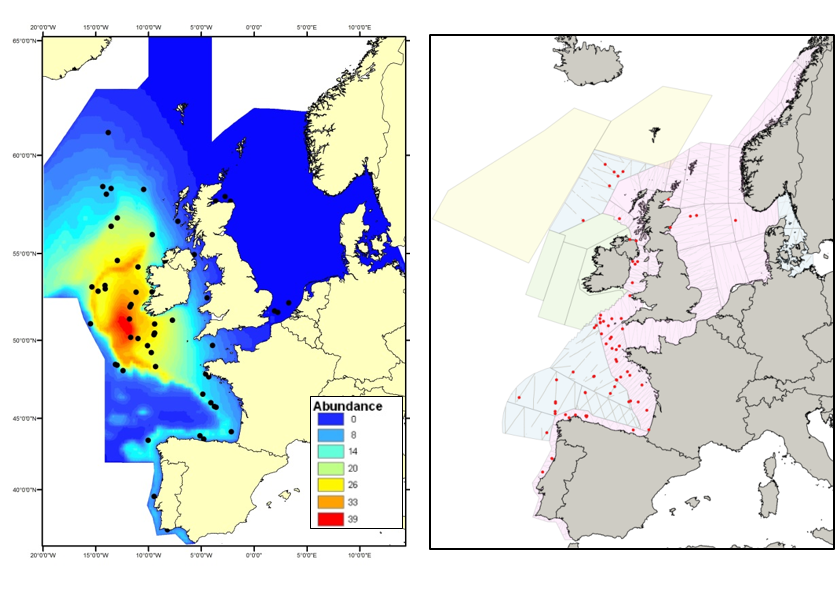
Figure 9. Left predicted density surface for bottlenose dolphin from CODA (Cetacean Offshore Distribution and Abundance in the European Atlantic), Small Cetaceans in European Atlantic Waters and the North Sea II (SCANS-II) and, North Atlantic Sighting Surveys (T-NASS) data. Right: sightings of bottlenosed dolphins in 2016 from the Small Cetaceans in European Atlantic Waters and the North Sea III (SCANS-III) survey (Hammond and others, 2017). The area in green to the west of Ireland was surveyed in summer 2016 by the Irish ObSERVE project but data were not yet available at the time of this assessment. The area in yellow was surveyed in the summer of 2015 by the North Atlantic Sightings Surveys project.
Fin whale
Fin whales primarily inhabit deeper waters (200 to 400m) beyond the shelf (Reid and others, 2003). They are not frequently encountered in the Greater North Sea but are commonly found in the Celtic Seas and the Bay of Biscay, and Iberian Coast (Figure 10). Data spanning the past 30 years do not indicate any changes in distribution over this time span (Hammond and others, 2011; Hammond and others, 2017).
An Assessment Unit has not been described for fin whales. The estimate of fin whale abundance in 2016 of 18,100 (confidence value: 0.38) (Hammond and others, 2017) is very similar to the estimate from 2007 of 19,300 (confidence value 0.24) for identified fin whales but smaller than the estimate that included a proportion of unidentified large whales of 29,500 (confidence value: 0.21) (Hammond and others, 2011). Analyses to account for unidentified large whales have not yet been undertaken for the Small Cetaceans in European Atlantic Waters and the North Sea III (SCANS-III) data. This survey did not include waters to the west of Ireland and a direct comparison between estimates for 2016 and 2005 and 2007 should not be made until estimates are available for equivalent areas.
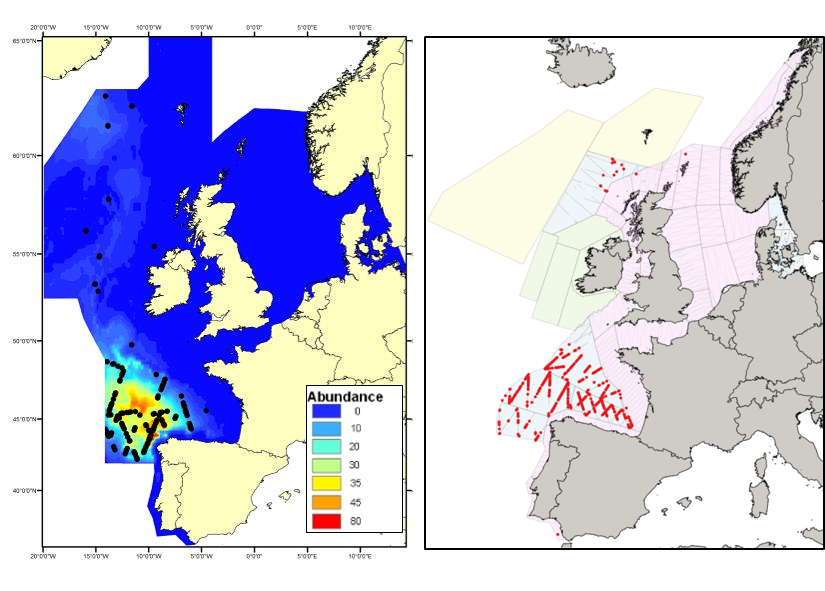
Figure 10: Left: predicted density surface for fin whale from CODA (Cetacean Offshore Distribution and Abundance in the European Atlantic), Small Cetaceans in European Atlantic Waters and the North Sea II (SCANS-II) and, North Atlantic Sighting Surveys (T-NASS) data. Right: sightings of fin whales in 2016 from the Small Cetaceans in European Atlantic Waters and the North Sea III (SCANS-III) survey (Hammond and others, 2017). The area in green to the west of Ireland was surveyed in summer 2016 by the Irish ObSERVE project but data were not yet available at the time of this assessment. The area in yellow was surveyed in the summer of 2015 by the North Atlantic Sightings Surveys project.
Long-finned pilot whale
Long-finned pilot whales are deep divers and are typically found only in waters around the continental slope and beyond the shelf. They occur throughout the Celtic Seas and the Bay of Biscay and Iberian Coast (Figure 11). No pilot whales were seen in the Small Cetaceans in European Atlantic Waters and the North Sea surveys (SCANS, SCANS-II and SCANS-III) in the Greater North Sea. Slope and distance to shelf edge have been found to be important predictors for the presence of this species (Rogan and others, 2017).
An Assessment Unit has not been described for the pilot whale. The estimate from 2005 and 2007 from the Small Cetaceans in European Atlantic Waters and the North Sea II (SCANS-II) and Cetacean Offshore Distribution and Abundance in the European Atlantic (CODA) surveys combined is 124,000 (confidence value: 0.35) animals. Rogan and others (2017) included a substantial area of high-density west of Ireland that is not included in the 2016 estimate from Small Cetaceans in European Atlantic Waters and the North Sea III (SCANS-III) of 20,700 (confidence value: 0.40). A direct comparison between estimates for 2016 and 2005 to 2007 should not be made until estimates are available for equivalent areas.
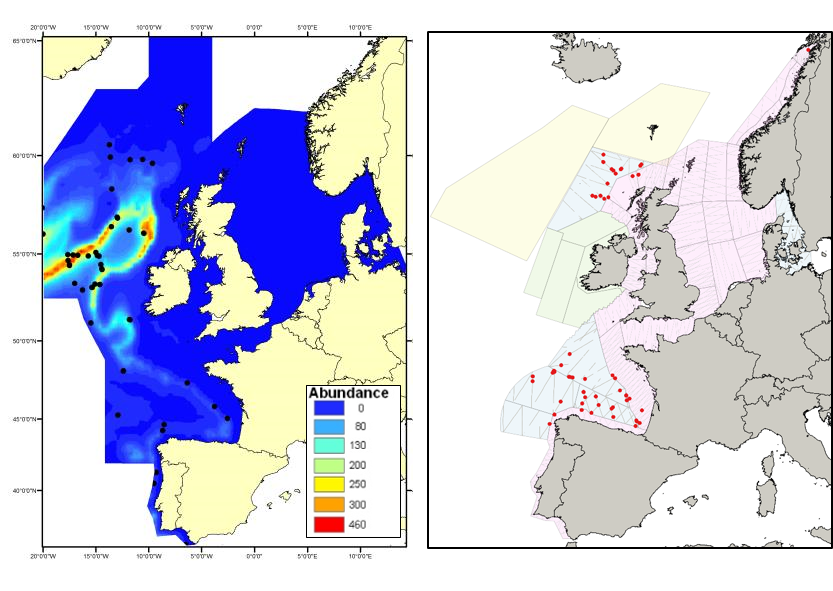
Figure 11. Left: predicted density surface for long-finned pilot whale from CODA (Cetacean Offshore Distribution and Abundance in the European Atlantic), Small Cetaceans in European Atlantic Waters and the North Sea II (SCANS-II) and, North Atlantic Sighting Surveys (T-NASS) data. Right: sightings of long-finned pilot whales in 2016 from the Small Cetaceans in European Atlantic Waters and the North Sea III (SCANS-III) survey (Hammond and others, 2017). The area in green to the west of Ireland was surveyed in summer 2016 by the Irish ObSERVE project but data were not yet available at the time of this assessment. The area in yellow was surveyed in the summer of 2015 by the North Atlantic Sightings Surveys project.
Beaked whales (all species)
Beaked whales are deep-diving species found almost exclusively in deep waters. Sighting of beaked whales are relatively uncommon in most areas throughout the Celtic Seas and the Bay of Biscay and Iberian Coast, and rare in the Greater North Sea. Sightings of northern bottlenose whales (Hyperoodon ampullatus) and Sowerby’s beaked whales (Mesoplodon bidens) have been made primarily in the northern part of the Celtic Seas, while Cuvier’s beaked whales (Ziphius cavirostris) have been seen mostly in the southern part of the Celtic Seas and the Bay of Biscay and Iberian Coast (Figures 12 and 13).
Assessment Units have not been described for beaked whales. The estimate of the abundance of all beaked whale species combined for 2016 of 11,600 (confidence value: 0.61; Hammond and others, 2017) is very similar to the equivalent estimate from Small Cetaceans in European Atlantic Waters and the North Sea II (SCANS-II) and Cetacean Offshore Distribution and Abundance in the European Atlantic (CODA) in 2005 and2007 of 12,900 (confidence value 0.31; Rogan and others, 2017). However, Small Cetaceans in European Atlantic Waters and the North Sea III (SCANS-III) did not include waters to the west of Ireland and a direct comparison between estimates for 2016 and 2005 and 2007 should not be made until estimates are available for equivalent areas.
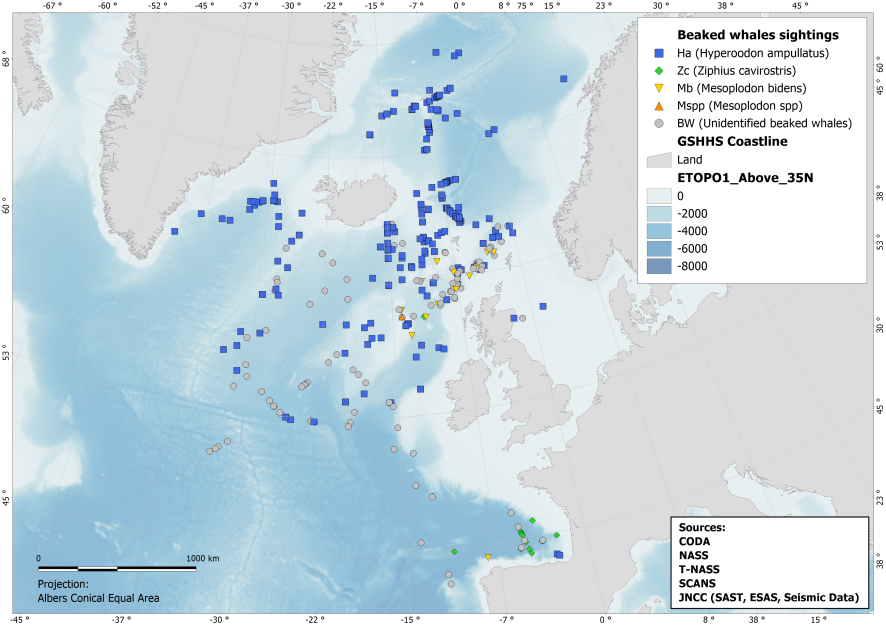
Figure 12. Combined sightings of beaked whales across the region over multiple years. GSHHS: Global Self-consistent, Hierarchical, High-resolution Geography Database; ETOPO1: 1-arc-minute global relief model of the Earth’s surface; CODA: Cetacean Offshore Distribution and Abundance project; T-NASS: Trans North Atlantic Sightings Survey; SCANS: Small Cetaceans in European Atlantic waters and the North Sea; JNCC: UK Joint Nature Conservation Committee; SAST: Seabirds at Sea Team; ESAS: European Seabirds at Sea.
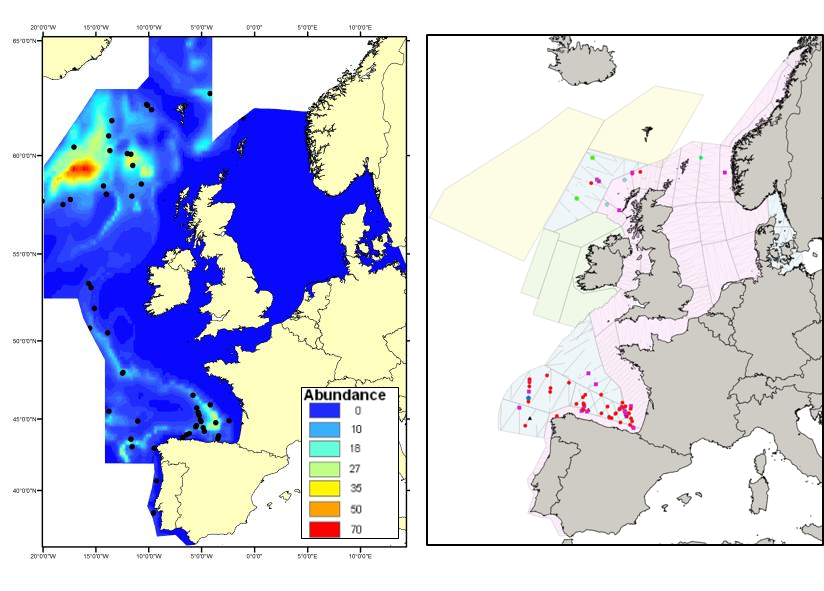
Figure 13. Left: predicted density surface for beaked whales from CODA (Cetacean Offshore Distribution and Abundance in the European Atlantic), Small Cetaceans in European Atlantic Waters and the North Sea II (SCANS-II) and, North Atlantic Sighting Surveys (T-NASS) data. Right: sightings of beaked whales in 2016 from the Small Cetaceans in European Atlantic Waters and the North Sea III (SCANS-III) survey (Hammond and others, 2017) in which red circles indicate Cuvier’s beaked whale, dark blue circles Gervais beaked whale, pink squares unidentified beaked whale, black unidentified Mesoplodon, green circles Sowerby’s beaked whale, and light blue circles bottlenose whale. The area in green to the west of Ireland was surveyed in summer 2016 by the Irish ObSERVE project but data were not yet available at the time of this assessment. The area in yellow was surveyed in the summer of 2015 by the North Atlantic Sightings Surveys project.
Sperm whale
The sperm whale is a deep-diving species found throughout deep waters of the Celtic Seas and the Bay of Biscay and Iberian Coast, and rarely in the Greater North Sea, except in the Faroes-Shetland channel between the Greater North Sea and Celtic Seas (Figure 14).
An Assessment Unit has not been described for the sperm whale. The estimate of abundance of sperm whales in 2016 of 9,600 (confidence value: 0.41; Hammond and others, 2017) is larger than the estimate from Cetacean Offshore Distribution and Abundance in the European Atlantic (CODA) in 2007 of 2,600 (confidence value: 0.26) for identified sperm whales and the estimate of 5,600 (confidence value: 0.32) if a proportion of unidentified large whales is included (Rogan and others, 2017). However, Small Cetaceans in European Atlantic Waters and the North Sea III (SCANS-III) did not include waters to the west of Ireland and a direct comparison between estimates for 2016 and 2005 to 2007 should not be made until estimates are available for equivalent areas.
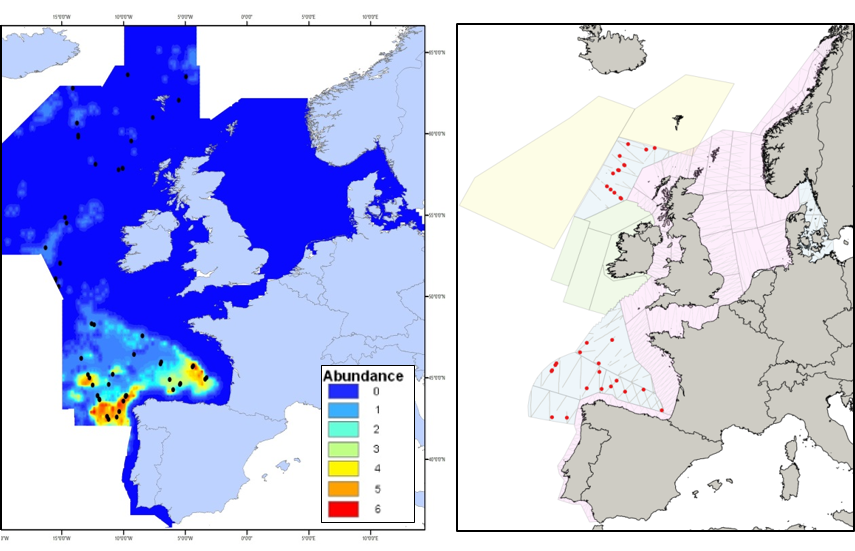
Figure 14. Left: predicted density surface for sperm whale from CODA (Cetacean Offshore Distribution and Abundance in the European Atlantic), Small Cetaceans in European Atlantic Waters and the North Sea II (SCANS-II) and, North Atlantic Sighting Surveys (T-NASS) data. Right: sightings of sperm whales in 2016 from the Small Cetaceans in European Atlantic Waters and the North Sea III (SCANS-III) survey (Hammond and others, 2017). The area in green to the west of Ireland was surveyed in summer 2016 by the Irish ObSERVE project but data were not yet available at the time of this assessment. The area in yellow was surveyed in the summer of 2015 by the North Atlantic Sightings Surveys project.
Conclusions
In the Greater North Sea, the UK target for population size of no ‘significant decline’ was met for minke whale during 1989 to 2016. This assessment was made with only medium confidence because an assessment of these two species should ideally be based on data from across their range in the European Atlantic.The abundance of harbour porpoise and white-beaked dolphin in the Greater North Sea appeared to be stable during 1994 to 2016, but uncertainty in the data meant a decline could not be ruled out. The range of harbour porpoise and minke whale in the Greater North Sea has remained the same, but the centre of their distribution has shifted southwards.
These assessments are only possible using data from large-scale surveys, such as Small Cetaceans in European Atlantic Waters and the North Sea III (SCANS III) in 2016. This survey yielded population estimates for a further six species in the Greater North Sea: common dolphin, striped dolphin, bottlenose dolphin, fin whale, long-finned pilot whale and beaked whales as a group. Numbers of these species were similar to, or larger than the only other previous estimates made in 2005, suggesting with very low confidence that these species are not declining in the Greater North Sea.
There was insufficient evidence to assess any species in the Celtic Seas, due to a lack of data from Irish waters for 2016 and there being only one previous estimate for the Celtic Seas in 2005 to 2007.
Knowledge gaps
For most species, recent data are insufficient to assess their status as only two estimates of abundance are available. Given this lack of data, it is not possible to indicate with confidence if there is a cause-effect relationship between human activities, abundance, and distribution. The power to detect trends could be improved by increasing the frequency of the large-scale surveys and by surveying at different times of the year (current large-scale survey data represents only summer) to understand seasonal influences.
Further information
Time series of information to assess the status
Many cetacean populations range over large areas and, even though some species are very abundant, these large ranges mean that densities are typically very low. All cetaceans spend the large majority of their lives underwater and are therefore difficult to observe. Surveys to obtain robust information over the large spatial scale required are both logistically challenging and expensive and, as a result, there have been few surveys undertaken. The large-scale Small Cetaceans in European Atlantic Waters and the North Sea (SCANS) and Cetacean Offshore Distribution and Abundance (CODA) surveys covering a large proportion of North-East Atlantic waters have been organised four times: in 1994, 2005 and 2016 (SCANS) and in 2007 (CODA). There have been additional valuable and more frequent systematic aerial surveys generating robust information for the southern and central North Sea that have been analysed (Disturbance Effects on the Harbour Porpoise Population in the North Sea project; Gilles and others, 2016). With the exception of harbour porpoise, minke whale and white-beaked dolphin in the Greater North Sea only, the time series of coordinated purpose-designed surveys for cetaceans is still too short to allow status to be assessed in relation to both indicators of abundance and distribution. The best way to improve this situation would be to establish systematic UK monitoring of cetacean abundance, that could be coordinated with the survey programmes of other countries, such as the three-yearly Dutch and German national surveys, the six-yearly Northern Atlantic Sightings Survey surveys in central North Atlantic waters and the Norwegian Independent Transect Surveys ‘mosaic’ surveys that cover the northeast North Atlantic.
A potentially useful way to improve this situation is to pursue a coordinated approach to collate and standardise all available effort-related cetacean sightings data across the region, including data from other sources such as seabird surveys such as further development of the Joint Cetacean Protocol. The patchiness in time, space and scale of survey data make this a challenging task but, the large amount of information available means that this could be a productive exercise.
Lack of seasonal information at an appropriately large scale
For logistical and practical reasons, large-scale surveys such as Small Cetaceans in European Atlantic Waters and the North Sea (SCANS) have been conducted during the summer. Information is lacking about large-scale seasonal changes in distribution. Seasonal variation in distribution and abundance at a smaller spatial scale is, however, available from some national survey programmes (for example, those of Belgium, Denmark, France, the Netherlands, and Germany). In some cases, these surveys are coordinated. To obtain better information about seasonal variation in distribution and abundance, consideration needs to be given to the extension to wider areas and to the better coordination of smaller-scale surveys in time and space. The Joint Cetacean Protocol initiative could also be valuable in this respect.
Anthropogenic influence on cetacean distribution and abundance
For human activities that have a direct negative impact on cetaceans such as removal by hunting, fisheries incidental bycatch, and ship strikes, the impact on populations is, at least in theory, possible to assess. Cetacean hunting no longer occurs in the UK. The impact of fisheries bycatch of harbour porpoises is considered separately within the UK Assessment. Bycatch also occurs in other species, especially in common dolphins. Ship-strikes of large cetaceans have been considered in a number of fora, including the particular problem of fast ferries. However, a lack of comprehensive data on, among other things, population abundance and animals affected, makes even these direct impacts difficult to assess.
For indirect impacts, it is much more difficult to quantify the number of animals affected and demonstrate cause and effect at a population level. Direct or indirect effects on cetaceans occur from a variety of human activities, including those generating underwater noise, prey depletion, habitat loss or degradation, chemical pollution, and marine debris.
The initiation of projects such as the Collaborative Oceanography and Monitoring for Protected Species (COMPASS) will help build an understanding of how cetaceans use an area of sea and how they may be impacted by or respond to pressure from human activities. The Collaborative Oceanography and Monitoring for Protected Species project has recently been initiated and will build cross-border capacity for effective monitoring and management of Marine Protected Areas through the establishment of a network of oceanographic and acoustic moorings across the regional seas of the Republic of Ireland, Northern Ireland and West Scotland. This network of buoys will enable the effective tracking, modelling, and monitoring of aquatic life and the oceanographic processes which influence them. The variety of habitats that the array covers will create a highly informative and varied data set, and, will be used to explore the importance of underwater noise in influencing the quality of the marine environmental quality for marine mammals.
References
Arbelo M, Los Monteros AE, Herráez P, Andrada M, Sierra E, Rodríguez F, Jepson PD, Fernández A (2013) ’Pathology and causes of death of stranded cetaceans in the Canary Islands (1999–2005)’ Diseases of Aquatic Organisms, 103: 87–99 (viewed on 30 November 2018)
ASCOBANS (2013) ‘Report of the Marine Debris Working Group. ASCOBANS Advisory Committee Meeting’ Document AC20/Doc.3.4.2 (viewed on 29 November 2018)
Bailey H, Brookes KL, Thompson PM (2014) ‘Assessing environmental impacts of off- shore wind farms: lessons learned and recommendations for the future’ Aquatic Biosystems, 10:1–13 (viewed on 30 November 2018)
Baulch S, Perry C (2014) ‘Evaluating impacts of marine debris ingestion and reporting interactions to the IWC’ Working Document to the Scientific Committee of the IWC SC/65b/E02, 19 pages (viewed on 29 November 2018)
Beineke A, Siebert U, McLachlan M, Bruhn R, Thron K, Failing K, Müller G, Baumgärtner W (2005) ‘Investigations of the potential influence of environmental contaminants on the thymus and spleen of harbor porpoises (Phocoena phocoena)’ Environmental Science and Technology 39: 3933–3938 (viewed on 29 November 2018
Bennett PM, Jepson PD, Law RJ, Jones BR, Kuiken T, Baker JR, Rogan E, Kirkwood JK (2001) ‘Exposure to heavy metals and infectious disease mortality in harbour porpoises from England and Wales’ Environmental Pollution 112: 33–40 (viewed on 29 November 2018)
Berggren P, Ishaq R, Zebuhr Y, Naf C, Bandh C, Broman D (1999) ‘Patterns and levels of organochlorines (DDTs, PCBs, non-ortho PCBs and PCDD/Fs) in male harbour porpoises (Phocoena phocoena) from the Baltic Sea, the Kattegat-Skagerrak Seas and the west coast of Norway’. Marine Pollution Bulletin 38: 1070–1084 (viewed on 29 November 2018)
Booth CG, Embling C, Gordon J, Calderan SV and Hammond PS (2013) ‘Habitat preferences and distribution of harbour porpoise Phocoena west of Scotland’ Marine Ecology Progress Series 478: 273–285 (viewed on 29 November 2018)
Brereton T, Kitching M, Davies R, McNie F, Walker R (2016) ‘Photo-identification Analysis of White-beaked Dolphins off South West and North East England 2007-2014 (RP03082)’ (viewed on 29 November 2018)
David JA (2006) ‘Likely sensitivity of bottlenose dolphins to pile-driving noise’ Water and Environment Journal, 20: 48–54 (viewed on 30 November 2018)
Davison N J, Perrett LL, Law RJ, Dawson CE, Stubberfield EJ, Monies RJ, Deaville R, Jepson PD (2011) ‘Infection with Brucellaceti and high levels of polychlorinated biphenyls in bottlenose dolphins (Tursiops truncatus) stranded in south-west England’ Veterinary Record, 1–69:14 (viewed on 30 November 2018)
Embling CB, Gillibrand PA, Gordon J, Shrimpton J, Stevick PT, Hammond PS (2010) ‘Using habitat models to identify suitable sites for marine protected areas for harbour porpoises (Phocoena phocoena)’ Biological Conservation 143(2): 267-279 (viewed on 12 December 2018)
European Commission (2013) ‘Habitat Directive reporting Article 17 reporting progress’. (viewed on 30 November 2018)
Evans PGH, Bjørge A (2013) ‘Impacts of climate change on marine mammals’ MCCIP Science Review 2013, 134-148, doi:10.14465/2013.arc15.134-148 (viewed on 12 December 2018)
Evans PGH, Nice H (1996) ‘Review of the effects of underwater sound generated by seismic surveys on cetaceans’ SeaWatch Foundation, Oxford (Report commissioned by UKOOA) (viewed on 1 December 2018)
Evans PGH, Anderwald P, Baines ME (2003) ‘UK Cetacean Status Review. Report to English Nature and the Countryside Council for Wales’ Sea Watch Foundation, Oxford, 160 pages (viewed on 29 November 2018)
Evans PGH, Baines ME, Anderwald P (2011) ‘Risk Assessment of Potential Conflicts between Shipping and Cetaceans in the ASCOBANS Region. 18th ASCOBANS Advisory Committee Meeting Document AC18/Doc.6-04 (S) rev.1’ (viewed on 29 November 2018)
Fontaine MC, Tolley KA, Siebert U, Gobert S, Lepoint G, Bouquegneau J-M and Das K (2007) ‘Long-term feeding ecology and habitat use in harbour porpoises Phocoenaphocoena from Scandinavian waters inferred from trace elements and stable isotopes’ BMC Ecology 7: 1 (viewed on 30 November 2018)
Gilles A, Viquerat S, Becker EA, Forney KA, Geelhoed SCV, Haelters J, Nabe-Nielsen J, Scheidat M, Siebert U, Sveegaard S, van Beest FM, van Bemmelen R, Aarts G (2016) ‘Seasonal habitat-based density models for a marine top predator, the harbor porpoise, in a dynamic environment’ Ecosphere 7: e01367. 10.1002/ecs2.1367 (viewed on 30 November 2018)
Gordon JCD, Gillespie D, Potter J, Frantzis A, Simmonds MP, Swift R, Thompson D (2003) ‘A Review of The effects of seismic surveys on marine mammals’ Journal of the Marine Technology Society 37: 41–53 (viewed on 30 November 2018)
Hammond PS, Berggren P, Benke H, Borchers DL, Collet A, Heide-Jørgensen MP, Heimlich S, Hiby AR, Leopold MF, Øien N (2002) ‘The abundance of harbour porpoises and other cetaceans in the North Sea and adjacent waters’ Journal of Applied Ecology 39: 361-376 (viewed on 30 November 2018)
Hammond PS, Northridge SP, Thompson D, Gordon JCD, Hall AJ, Murphy SN, Embling CB (2008) ‘Background information on marine mammals for Strategic Environmental Assessment 8’ Report to the Department for Business, Enterprise, and Regulatory Reform. Sea Mammal Research Unit, St Andrews, Scotland, UK, 52 pages (viewed 2 December 2018)
Hammond PS, Macleod K, Gillespie D, others (2009) ‘Cetacean Offshore Distribution and Abundance in the European Atlantic (CODA)’ Final report to the European Commission. St Andrews: Sea Mammal Research Unit, 42 pages (viewed 2 December 2018)
Hammond PS, Macleod K, Burt L, Cañadas A, Lens S, Mikkelsen B, Rogan E, Santos B, Uriarte A, Van Canneyt O, Vazquez JA (2011) ‘The abundance of baleen whales in the European Atlantic’ Paper SC/63/RMP24 presented to the Scientific Committee of the International Whaling Commission. Unpublished, abstract only available online (viewed 12 December 2018)
Hammond PS, Macleod K, Berggren P, Borchers DL, Burt L, Cañadas A, Desportes G, Donovan GP, Gilles A, Gillespie D, Gordon J, Hiby L, Kuklik I, Leaper R, Lehnert K, Leopold M, Lovell P, Øien N, Paxton CGM, Ridoux V, Rogan E, Samarra F, Scheidat M, Sequeira M, Seibert U, Skov H, Swift R, Tasker ML, Teilmann J, Van Canneyt O, Vázquez JA (2013) ‘Cetacean abundance and distribution in European Atlantic shelf waters to inform conservation and management’ Biological Conservation 164: 107–122 (viewed 2 December 2018)
Hammond PS, Lacey C, Gilles A, Viquerat S, Börjesson P, Herr H, Macleod K, Ridoux V, Santos MB, Scheidat M, Teilmann J, Vingada J, Øien N (2017) ‘Estimates of cetacean abundance in European Atlantic waters in summer 2016 from the SCANS-III aerial and shipboard surveys’ Report to ICES Working Group on Marine Mammal Ecology, 26 pages (viewed on 30 November 2018)
Heinänen S , Skov H (2015) ‘The identification of discrete and persistent areas of relatively high harbour porpoise density in the wider UK marine area’ JNCC Report No. 544, Joint Nature Conservancy Committee, Peterborough (viewed 30 November 2018)
HM Government (2012) ‘Marine Strategy Part One: UK Initial Assessment and Good Environmental Status’ (viewed on 5 July 2018)
ICES (2014a) ‘Bycatch of small cetaceans and other marine animals - Review of national reports under Council Regulation (EC) No. 812/2004 and other published documents’ ICES Advice April 2014.AC21/Inf.3.1.b (viewed online 30 November 2018)
ICES (2014b) ‘Report of the ICES / NAFO Joint working group on deepwater ecology. 24-28 February 2014’ 234 pages (viewed on 30 November 2018)
ICES (2015) ‘Report of the Working Group on Marine Mammal Ecology (WGMME),9-12 February 2015, London, UK’. ICES CM 2015/ACOM:25, 108 pages (viewed on 2 December 2018)
Isojunno S, Matthiopoulos J, Evans PGH (2012) ‘Harbour porpoise habitat preferences: Robust spatio-temporal inferences from opportunistic data’ Marine Ecology Progress Series 448: 155-170 (viewed on 30 November 2018)
IUCN (2012) ‘IUCN Red List Categories and Criteria: Version 3.1’ Gland: Switzerland and Cambridge: UK (Viewed on 2 December 2018)
Jepson PD, Deaville R, Acevedo-Whitehouse K, Barnett J, Brownlow A, Brownell Jr RL., Clare FC, Davison N, Law RJ, Loveridge J, Macgregor SK, Morris S, Murphy S, Penrose R, Perkins MW, Pinn E, Seibel H, Siebert U, Sierra U, Simpson V, Tasker ML, Tregenza N, Cunningham AA, Fernández A (2013) ‘What Caused the UK's Largest Common Dolphin (Delphinus delphis) Mass Stranding Event?’ PLoS One, 8: e60953 (viewed on 2 December 2018)
Jepson PD, Deaville R, Barber JL, Aguilar À, Borrell A. Murphy A, Barry J, Brownlow A, Barnett J, Berrow S, Cunningham AA, Davison NJ, ten Doeschate M, Esteban R, Ferreira M, Foote AD, Genov T, Giménez J, Loveridge J, Llanona À, Martin V, Maxwel DL, Papachlimitzou A, Penrose R, Perkins MW, Smith B, de Stephanis R, Tregenza N, Verborgh P, Fernadez A and Law RJ (2016) ‘PCB pollution continues to impact populations of orcas and other dolphins in European waters’ Nature Scientific Reports 6: 18573 (viewed on 30 November 2018)
JNCC (2013) Third Report by the UK under Article 17 on the implementation of the Habitats Directive from January 2007 to December 2012’ Joint Nature Conservation Committee: Peterborough (viewed on 2 December 2018)
Laist DW (1987) ‘Overview of the biological effects of lost and discarded plastic debris in the marine environment’ Marine Pollution Bulletin, 18:19–326 (viewed on 30 November 2018)
Laist DW (1997) ‘Impacts of marine debris: entanglement of marine life in marine debris including a comprehensive list of species with entanglement and ingestion records’ In: Coe JM, Rogers DB (Eds), Marine Debris: Sources, Impacts, and Solutions. Springer Verlag, New York, pages 99–140 (viewed on 2 December 2018)
Laist DW, Knowlton AR, Mead JG, Collet AS, Podesta M (2001) ‘Collisions between ships and great whales’. Marine Mammal Science, 17:35–75 (viewed on 2 December 2018)
Laran S, Authier M, Blanck A, Doremus G, Falchetto H, Monestiez P, Pettex E, Stephan E, Van Canneyt O, Ridoux V (2017). ‘Seasonal distribution and abundance 1 of cetaceans within French waters: Part II: The Bay of Biscay and the English Channel’ Deep Sea Research II: Topical studies in oceanography 141: 31-40 (viewed on 23 November 2018)
Law RJ, Barry J, Barber JL, Bersuder P, Deaville R, Reid RJ, Brownlow A, Penrose R, Barnett J, Loveridge J, Smith, Jepson PD (2012) ‘Contaminants in cetaceans from UK waters: Status as assessed within the Cetacean Strandings Investigation Programme from 1990 to 2008’ Marine Pollution Bulletin 64: 1485–1494 (viewed on 2 December 2018)
Lusher AL, Hernandez-Milian G, O'Brien J, Berrow S, O'Connor I, Officer R (2015) ‘Microplastic and macroplastic ingestion by a deep diving, oceanic cetacean: The True's beaked whale Mesoplodon mirus' Environmental Pollution 199: 185–191 (viewed on 2 December 2018)
MacLeod CD, Weir CR, Begona Santos M, Dunn TE (2008) ‘Temperature-based summer habitat partitioning between white-beaked and common dolphins around the United Kingdom and the Republic of Ireland’ Journal of the Marine Biological Association of the United Kingdom, 88: 1193–1198 (viewed on 2 December 2018)
MAGRAMA (2012) ‘Estrategias Marinas: Evaluación Inicial, Buen Estado Ambiental y Objetivos Ambientales’ Ministerio de Agricultura, Alimentación y Medio Ambiente, 287 pages (viewed on 30 November 2018)
Marubini F, Gimona A, Evans PGH, Wright PJ, Pierce GJ (2009) ‘Habitat preferences and interannual variability in the occurrence of the harbour porpoise Phocoena phocoena in the north-west of Scotland’ Marine Ecology Progress Series 381:297-310 (viewed on 30 November 2018)
Méndez-Fernandez P, Websterd L, Chouvelon T, Bustamante P, Ferreira M, González AF, López A, Moffat CF, Pierce GJ, Read FL, Russell M, Santos MB, Spitz J, Vingada JV and Caurant G (2014a) ‘An assessment of contaminant concentrations in toothed whale species on the NW Iberian Peninsula: Part I. Persistent organic pollutants’, Science of the Total Environment 484:196–205 (viewed on 30 November 2018).
Méndez-Fernandez P, Websterd L, Chouvelon T, Bustamante P, Ferreira M, González AF, López A, Moffat CF, Pierce GJ, Read FL, Russell M, Santos MB, Spitz J, Vingada JV, Caurant G (2014b) ‘An assessment of contaminant concentrations in toothed whale species on the NW Iberian Peninsula: Part II. Trace element concentrations’ Science of the Total Environment 484:206–217 (viewed on 2 December 2018)
Murphy S, Pinn EH, Jepson PD (2013) ‘The short-beaked common dolphin (Delphinus delphis) in the North-Eastern Atlantic: distribution, ecology, management and conservation status’ Oceanography and Marine Biology: An Annual Review, 51:193-280 (viewed on 2 December 2018)
Murphy S, Barber JL, Learmonth JA, Read FL, Deaville R, Perkins MW, Brownlow A, Davison N, Penrose R, Pierce GJ, Law RJ and Jepson PD (2015) ‘Reproductive Failure in UK Harbour Porpoises Phocoena: Legacy of Pollutant Exposure?’ PLoS One, 10(7):e0131085 (viewed on 2 December 2018).
Nichols JD, Williams BK (2006) ‘Monitoring for conservation’ Trends in Ecology and Evolution, 21:668–673 (viewed on 2 December 2018)
OSPAR Commission (2012) ‘MSFD Advice Manual and Background Document on Biodiversity A living document - Version 3.2 of 5 March 2012’ (viewed on 2 December 2018)
OSPAR Commission (2017) ‘Intermediate Assessment 2017’ (viewed on 21 September 2018)
Panigada S, Pesante G, Zanardelli M, Capoulade F, Gannier A and Weinrich MT (2006) ’Mediterranean fin whales at risk from fatal ship strikes’ Marine Pollution Bulletin 52:1287–1289 (viewed on 30 November 2018)
Panigada S, Zanardelli M, MacKenzie M, Donovan C, Melin F, Hammond PS (2008) ‘Modelling habitat preferences for fin whales and striped dolphins in the Pelagos Sanctuary (Western Mediterranean Sea) with physiographic and remote sensing variables’ Remote Sensing of Environment 112:3400–3412 (viewed on 30 November 2018)
Pierpoint C (2008) ‘Harbour porpoise (Phocoena phocoena) foraging strategy at a high energy near-shore site in south-west Wales, UK’ Journal of the Marine Biological Association of the United Kingdom 88:1167–1173 (viewed on 30 November 2018)
Reid JB, Evans PGH, Northridge SP (2003) ‘Atlas of Cetacean distribution in north-west European waters’ Joint Nature Conservation Committee (viewed on 30 November 2018)
Rogan E, Canadas A, Macleod K, Santos B, Mikkelsen B, Uriarte A, Van Canneyt O, Vazquez JA, Hammond PS (2017) ‘Distribution, abundance and habitat use of deep-diving cetaceans in the North East Atlantic’ Deep Sea Research II 141: 8-19 (viewed on 30 November 2018)
Scheidat M, Gilles A, Kock K-H, Siebert U (2008) ‘Harbour porpoise Phocoena abundance in the southwestern Baltic Sea Endangered Species Research 5:215-223 (viewed on 30 November 2018)
Silva MA, Machete M, Reis D, Santos M, Prieto R, Dâmaso C, Pereira JG, Santos RS (2011) ‘A review of interactions between cetaceans and fisheries in the Azores’. Aquatic Conservation: Marine and Freshwater Ecosystems 21: 17-27 (viewed on 30 November 2018)
Solvang HK, Skaug HJ, Øien NI (2015) Abundance estimates of common minke whales in the North East Atlantic based on survey data collected over the period 2008-2013 Paper SC/66a/RMP8 presented to the International Whaling Commission Scientific Committee. Unpublished.
Sveegaard S, Galatius A, Dietz R, Kyhn L, Koblitz JC, Amundin M, Nabe-Nielsen J, Sinding M-HS, Andersen LW, Teilmann J (2015) ‘Defining management units for cetaceans by combining genetics, morphology, acoustics and satellite tracking’ Global Ecology and Conservation 3:839–850 (viewed on 30 November 2018)
Viquerat S, Herr H, Gilles A, Peschko V, Siebert U, Sveegaard S and Teilmann J (2014) ‘Abundance of harbour porpoises (Phocoena phocoena) in the western Baltic, Belt Seas and Kattegat’ Marine Biology 161:745-754 (viewed on 30 November 2018)
Waring GT, Palka DL, Evans PGH (2009) North Atlantic Marine Mammals. Pages 763-771 In: Encyclopedia of Marine Mammals (Editors WF Perrin, B Würsig and JGM Thewissen). 2nd edition. Academic Press, San Diego.
WDCS (2011) ‘Marine Debris and Cetaceans’. Report of the Whale and Dolphin Conservation Society (viewed on 30 November 2018)
Wilson B, Batty RS, Daunt F, Carter C (2007) ‘Collision risks between marine renewable energy devices and mammals, fish and diving birds’ Report to the Scottish Executive. Scottish Association for Marine Science, Oban, Scotland, PA37 1QA (viewed on 2 December 2018)
Acknowledgements
Assessment metadata
| Assessment Type | UK MSFD Indicator Assessment |
|---|---|
D1/D4/D6 Biodiversity and Food Webs, Cetaceans | |
| Point of contact email | marinestrategy@defra.gov.uk |
| Metadata date | Saturday, May 1, 2021 |
| Title | Abundance and distribution of cetaceans other than coastal bottlenose dolphins and killer whales |
| Resource abstract | Common indicator assessment of abundance and distribution of wide-ranging cetaceans. Applicable to all of the North-East Atlantic. |
| Linkage | http://www.sciencedirect.com/science/article/pii/S0006320713001055 http://biology.st-andrews.ac.uk/coda/ |
| Conditions applying to access and use | Terms and Conditions for data used in the assessment. The data reported for a number of coastal bottlenose dolphin populations can only be used for this assessment reported here. For other use agreement should be sought with the data owners: East Coast Scotland: Aberdeen University Lighthouse Field Station. Cardigan Bay, Wales: Sea Watch Foundation. Shannon Estuary, Ireland: Shannon Whale and Dolphin Federation and the University College Cork. St Malo, France: Groupe d’Etude des Cétacés du Cotentin, Cherbourg-Octeville. Ile de Sein, France: Parc naturel marin d’Iroise, Brétagne. Sado Estuary, Portugal: Projecto Delfim – Portuguese Center for the Study of Marine Mammals, Lisbon; and others (Unidade de Investigação em Eco-Etologia, Instituto Superior de Psicologia Aplicada). |
| Assessment Lineage | |
| Dataset metadata | |
| Links to datasets identifiers | Please, see metadata record details above |
| Dataset DOI | Please, see metadata record details above with references to published material |
The Metadata are “data about the content, quality, condition, and other characteristics of data” (FGDC Content Standard for Digital Geospatial Metadata Workbook, Ver 2.0, May 1, 2000).
Metadata definitions
Assessment Lineage - description of data sets and method used to obtain the results of the assessment
Dataset – The datasets included in the assessment should be accessible, and reflect the exact copies or versions of the data used in the assessment. This means that if extracts from existing data were modified, filtered, or otherwise altered, then the modified data should be separately accessible, and described by metadata (acknowledging the originators of the raw data).
Dataset metadata – information on the data sources and characteristics of data sets used in the assessment (MEDIN and INSPIRE compliance).
Digital Object Identifier (DOI) – a persistent identifier to provide a link to a dataset (or other resource) on digital networks. Please note that persistent identifiers can be created/minted, even if a dataset is not directly available online.
Indicator assessment metadata – data and information about the content, quality, condition, and other characteristics of an indicator assessment.
MEDIN discovery metadata - a list of standardized information that accompanies a marine dataset and allows other people to find out what the dataset contains, where it was collected and how they can get hold of it.
Recommended reference for this indicator assessment
Eunice Pinn1, Ian Mitchell1, Jane Hawkridge1 and Kelly Macleod1 2018. Cetacean abundance and distribution: wide-ranging cetaceans*. UK Marine Online Assessment Tool, available at: https://moat.cefas.co.uk/biodiversity-food-webs-and-marine-protected-areas/cetaceans/abundance-and-distribution-of-cetaceans-other-than-coastal-bottlenose-dolphins/
* Adapted from OSPAR Intermediate Assessment 2017 on Abundance and Distribution of Cetaceans
1Joint Nature Conservation Committee