
The number of new populations of established invasive NIS
New populations of established invasive non-indigenous species (NIS) were detected across UK marine waters within the assessment period (2003-2020), with potential negative impacts. The rate of change in new populations of assessed NIS is uncertain due to data limitations. This is the first time this indicator has been assessed.
Background
Non-indigenous species (NIS) are organisms moved into new areas, outside their natural range of distribution and dispersal potential, by human activity. The term ‘non-indigenous species’ is the equivalent of ‘alien species’ and ‘non-native species’. It refers to a species intentionally or unintentionally introduced outside its native range by human actions. An ‘invasive non-native species’ (INNS) is any non-native animal or plant that has the ability to spread, causing damage to the environment, the economy, our health, or the way we live.
Invasive NIS cause impacts associated with competition with native species for resources and space, habitat modification, ecosystem engineering, introduction of pathogens and parasites, and hybridisation with native species. These impacts can result in changes to species’ and community composition potentially leading to localised extinctions; species’ ability to adapt to environmental changes; food webs; nutrient cycles and water quality. In addition to posing a significant threat to marine biodiversity, invasive NIS can also have negative economic and health impacts.
Preventing the introduction of NIS is currently considered the most effective form of management, particularly in the marine environment, where eradicating or controlling NIS is difficult and costly to achieve. However, reducing the abundance, and limiting the spread, of already established invasive NIS will also be important for reducing their potential impact.
The assessment presented here aims to assess NIS spread against the second NIS indicator ‘the number of new populations of established invasive NIS’. More specifically, it assesses the change in distribution of established invasive NIS through quantification of the relative change in the number of 10 km grid cells within the assessment area occupied by the NIS over time. Distribution data for NIS meeting criteria relating to establishment status, occurrence location, baseline data and habitat were sought from various sources including Marine Recorder, National Biodiversity Network (NBN) Atlas, and experts within each Devolved Administration.
Further information
The first NIS indicator and target presented in The UK Marine Strategy (UKMS) relates to ‘the number of new NIS introductions’ with its assessment contributing to our understanding of the efficacy of measures to prevent new NIS introductions (HM Government, 2012). The assessment presented here is based on the second indicator assessment ‘The number of new populations of established invasive NIS’ referred in the UKMS part one (updated in 2019).
The wider the distribution of an invasive NIS, the greater the spatial extent over which it may exert impacts, such that minimising invasive NIS spread is crucial to mitigating their negative effects. For the present indicator, the focus is on assessing the spread of established invasive NIS, i.e., those species which are known to cause negative impact and are a priority for monitoring and management to contain and reduce spread, where possible.
This is the first time an assessment has been undertaken based on the second indicator ‘The number of new populations of established invasive NIS’, to examine the distribution of NIS and their rate of spread. Given the significant limitations with respect to monitoring and knock-on impacts on data, robust and high-resolution assessment of trends is not possible, and caution is required when interpreting this indicator assessment.
Monitoring which explicitly targets marine NIS in UK waters is limited (HM Government 2022, 2014), and focuses primarily on detection of new NIS introductions, rather than the spread of already introduced NIS. However, more robust marine NIS monitoring programmes have been implemented regionally, for example in Orkney and Shetland. Focussed studies to examine the distribution of individual NIS, such as the carpet sea squirt (Didemnum vexillum), have also been undertaken but only on small spatial scales (Moore and Harries, 2020).
Some general measures such as biosecurity campaigns (e.g. Check, Clean, Dry, https://www.nonnativespecies.org/what-can-i-do/check-clean-dry/) and more recently, pathway action plans (e.g. the Recreational Boating Pathway Action Plan for Great Britain, https://www.nonnativespecies.org/biosecurity/pathway-action-plans/recreational-boating-pap-for-great-britain/) exist to facilitate the containment (and therefore reduce the spread) of NIS. Biosecurity plans targeting specific sites or areas also exist (e.g. Loch Creran Community Biosecurity Action Plan - gov.scot (www.gov.scot)), but national coverage is patchy and evidence of their efficacy is limited (O’Shaughnessy, 2023). Examples of active, targeted management of invasive NIS in the UK marine environment are also limited. One example is the manual removal of the Pacific oyster (Magallana gigas) which has been practised in some regions of the assessment area (Morgan and others, 2021).
Assessment method
This is a new indicator that uses four criteria to select species for inclusion in the assessment:
-
Defined as established on the GB Non-Native Species Information Portal (GBNNSIP)
-
Recorded within the UKMS assessment area prior to 2003 and between 2003 and 2020 (the assessment period, see below)
-
Has baseline data collated by Hughes and others (2016);
-
Occupies the marine environment only (i.e. Chinese mitten crab (Eriocheir sinensis) was excluded as it is found in freshwater systems as well as marine systems).
Data for species baseline distribution were extracted from Hughes and others (2016). Species occurrence records from 2003 to 2020 (inclusive) were extracted and downloaded from NBN Atlas UK and Marine Recorder. Data were checked to ensure only presence records were included. Known synonyms were included in searches to minimise risk of records being missed due nomenclatural change.
Data were checked and formatted to include Scientific Name, Longitude, Latitude and Year. Incomplete occurrence records were removed. Experts from each Devolved Administration checked occurrence records and provided additional occurrence records known to them. The UK records were assigned to three periods defined as follows: Period 1: 2003-2008; Period 2: 2009-2014; Period 3: 2015-2020. Records prior to 2003 were defined as baseline records.
Analysis of occurrence records for each NIS were plotted spatially and assigned to a grid cell of a 10km grid spanning the UK Marine Strategy assessment area (i.e. Charting Progress Two spatial remit) including coastal waters but excluding transitional waters defined by Water Framework Directive as ‘bodies of surface water in the vicinity of river mouths which are partly saline in character as a result of their proximity to coastal waters but are substantially influenced by freshwater flows’, also referred to as estuaries) created in QGIS. For each assessed NIS, the number of new populations was estimated, using the number of new 10km grid cells within which the species was recorded per year (based on the first record of the NIS within the grid cell). Temporal trends in new grid cells over time were analysed using generalised linear models (GLMs) of the Poisson family. Variation between assessed NIS in the effect of year or period on the number of new grid cells was accounted for by creating separate GLMs for each species or applying generalised linear mixed effects models with year/ period as the fixed effect and species as the random effect. Where GLMs highlighted significant differences between periods, Tukey pairwise comparison tests were used to examine differences between all period pairs. For the analysis of the latitude of grid cells newly occupied by the assessed NIS from 2003 to 2020, a linear mixed effects model was used with species included as a random effect. All analyses were conducted in R (version 4.2.2) unless otherwise stated. See Figure 1 for schematic illustrating the methodology applied.

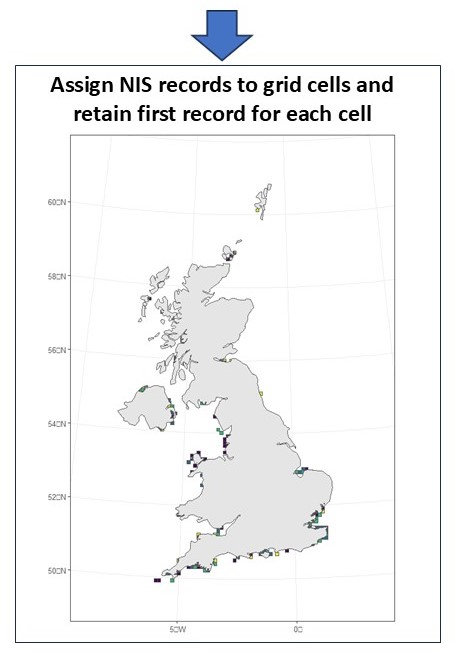
Figure 1. Schematic describing three core components of the methodology developed for the number of new populations of established invasive non-indigenous species indicator assessment: collation, formatting and plotting of NIS occurrence records; creation of 10km grid to cover the UKMS spatial remit; and assignment of NIS records to grid cells to determine number of new grid cells occupied by new populations per year within assessed period, a proxy for the number of new population of established invasive NIS.
Results
Thirteen species including molluscs, crustacea, seaweeds, a tunicate and an anemone met the selection criteria for this indicator assessment (Table 1). All species were recorded in at least two new grid cells in each assessment period, apart from Solidobalanus fallax which was not recorded in a new grid cell in Period 3. Across all periods, the lowest and highest number of new cells with species records was 8 for Urosalpinx cinerea and 152 for Sargassum muticum (Table 1, Figure 2). The greatest proportional increase in cells occupied from 2003-2020, compared to the baseline was for Caprella mutica with the lowest for Bonnemaisonia hamifera.
Table 1. Number of grid cells occupied by each species prior to 2003 (Baseline), and the number of new cells occupied within each period (P1= Period 1: 2003-2008; P2 Period 2: 2009-2014; Period 3: 2015-2020).
|
Species scientific name |
Species common name |
Species group |
Baseline |
P1 |
P2 |
P3 |
|
Bonnemaisonia hamifera |
Bonnemaison's Hook Weed |
Rhodophyta |
327 |
14 |
8 |
8 |
|
Caprella mutica |
Japanese Skeleton Shrimp |
Crustacea
|
1 |
47 |
32 |
3 |
|
Crepidula fornicata |
Slipper Limpet |
Mollusca |
185 |
58 |
42 |
18 |
|
Diadumene lineata |
Orange-striped Anemone |
Cnidaria |
13 |
1 |
3 |
5 |
|
Ensis leei |
American Jack Knife Clam |
Mollusc |
27 |
12 |
10 |
9 |
|
Ficopomatus enigmaticus |
Trumpet Tubeworm |
7 |
3 |
6 |
3 |
|
|
Grateloupia turuturu |
Devil's Tongue Weed |
Rhodophyta |
10 |
6 |
20 |
15 |
|
Magallana gigas |
Pacific Oyster |
Mollusca |
38 |
31 |
39 |
25 |
|
Sargassum muticum |
Wireweed |
84 |
64 |
50 |
38 |
|
|
Solidobalanus fallax |
Rosy-hitcher Barnacle |
Crustacea |
12 |
7 |
5 |
0 |
|
Styela clava |
Leathery Sea Squirt |
Chordata |
65 |
46 |
37 |
18 |
|
Undaria pinnatifida |
Wakame |
2 |
7 |
17 |
8 |
|
|
Urosalpinx cinerea |
Atlantic Oyster Drill |
Mollusca |
9 |
3 |
3 |
2 |
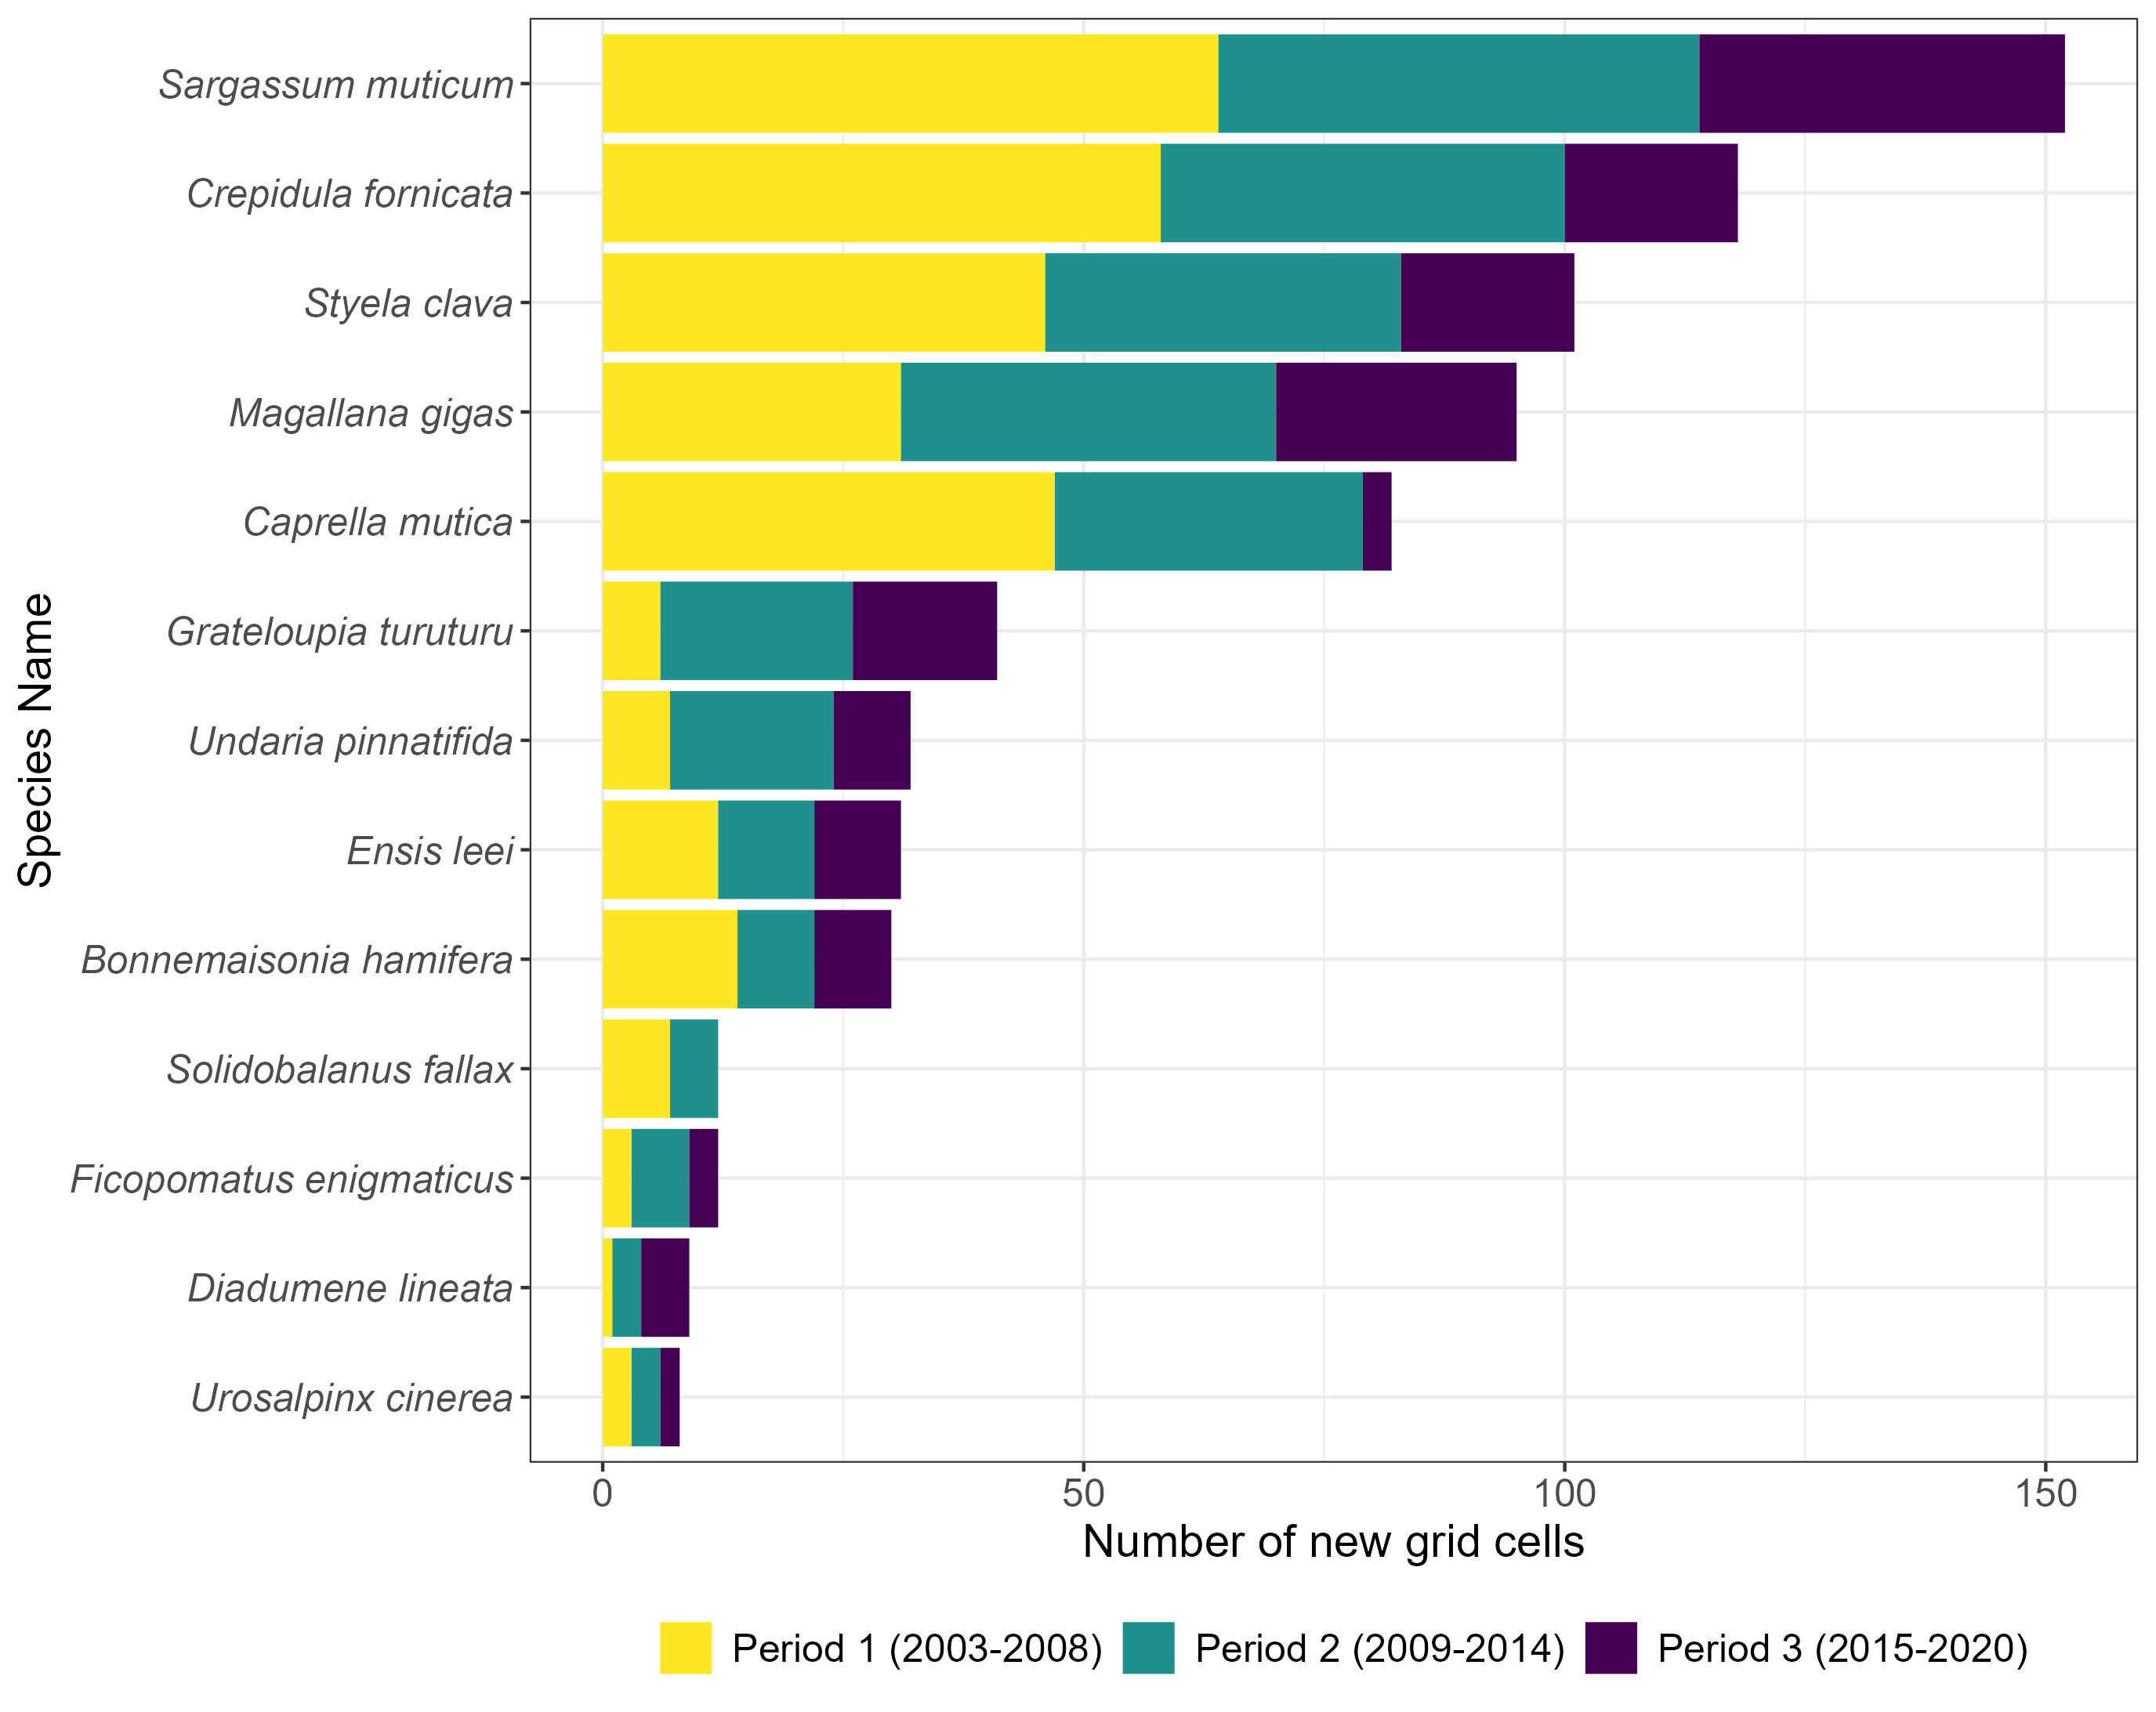
Figure 2. The number of new grid cells occupied by each assessed NIS within 6-year periods from 2003 to 2020.
Overall, there was a significant decrease in the number of new grid cells occupied by assessed NIS over the period of 2003-2020 (Estimate = -0.045, Standard Error = 0.0073, Z value = -6.25, P < 0.001) (Figure 3), possibly indicating a slowing rate of spread.
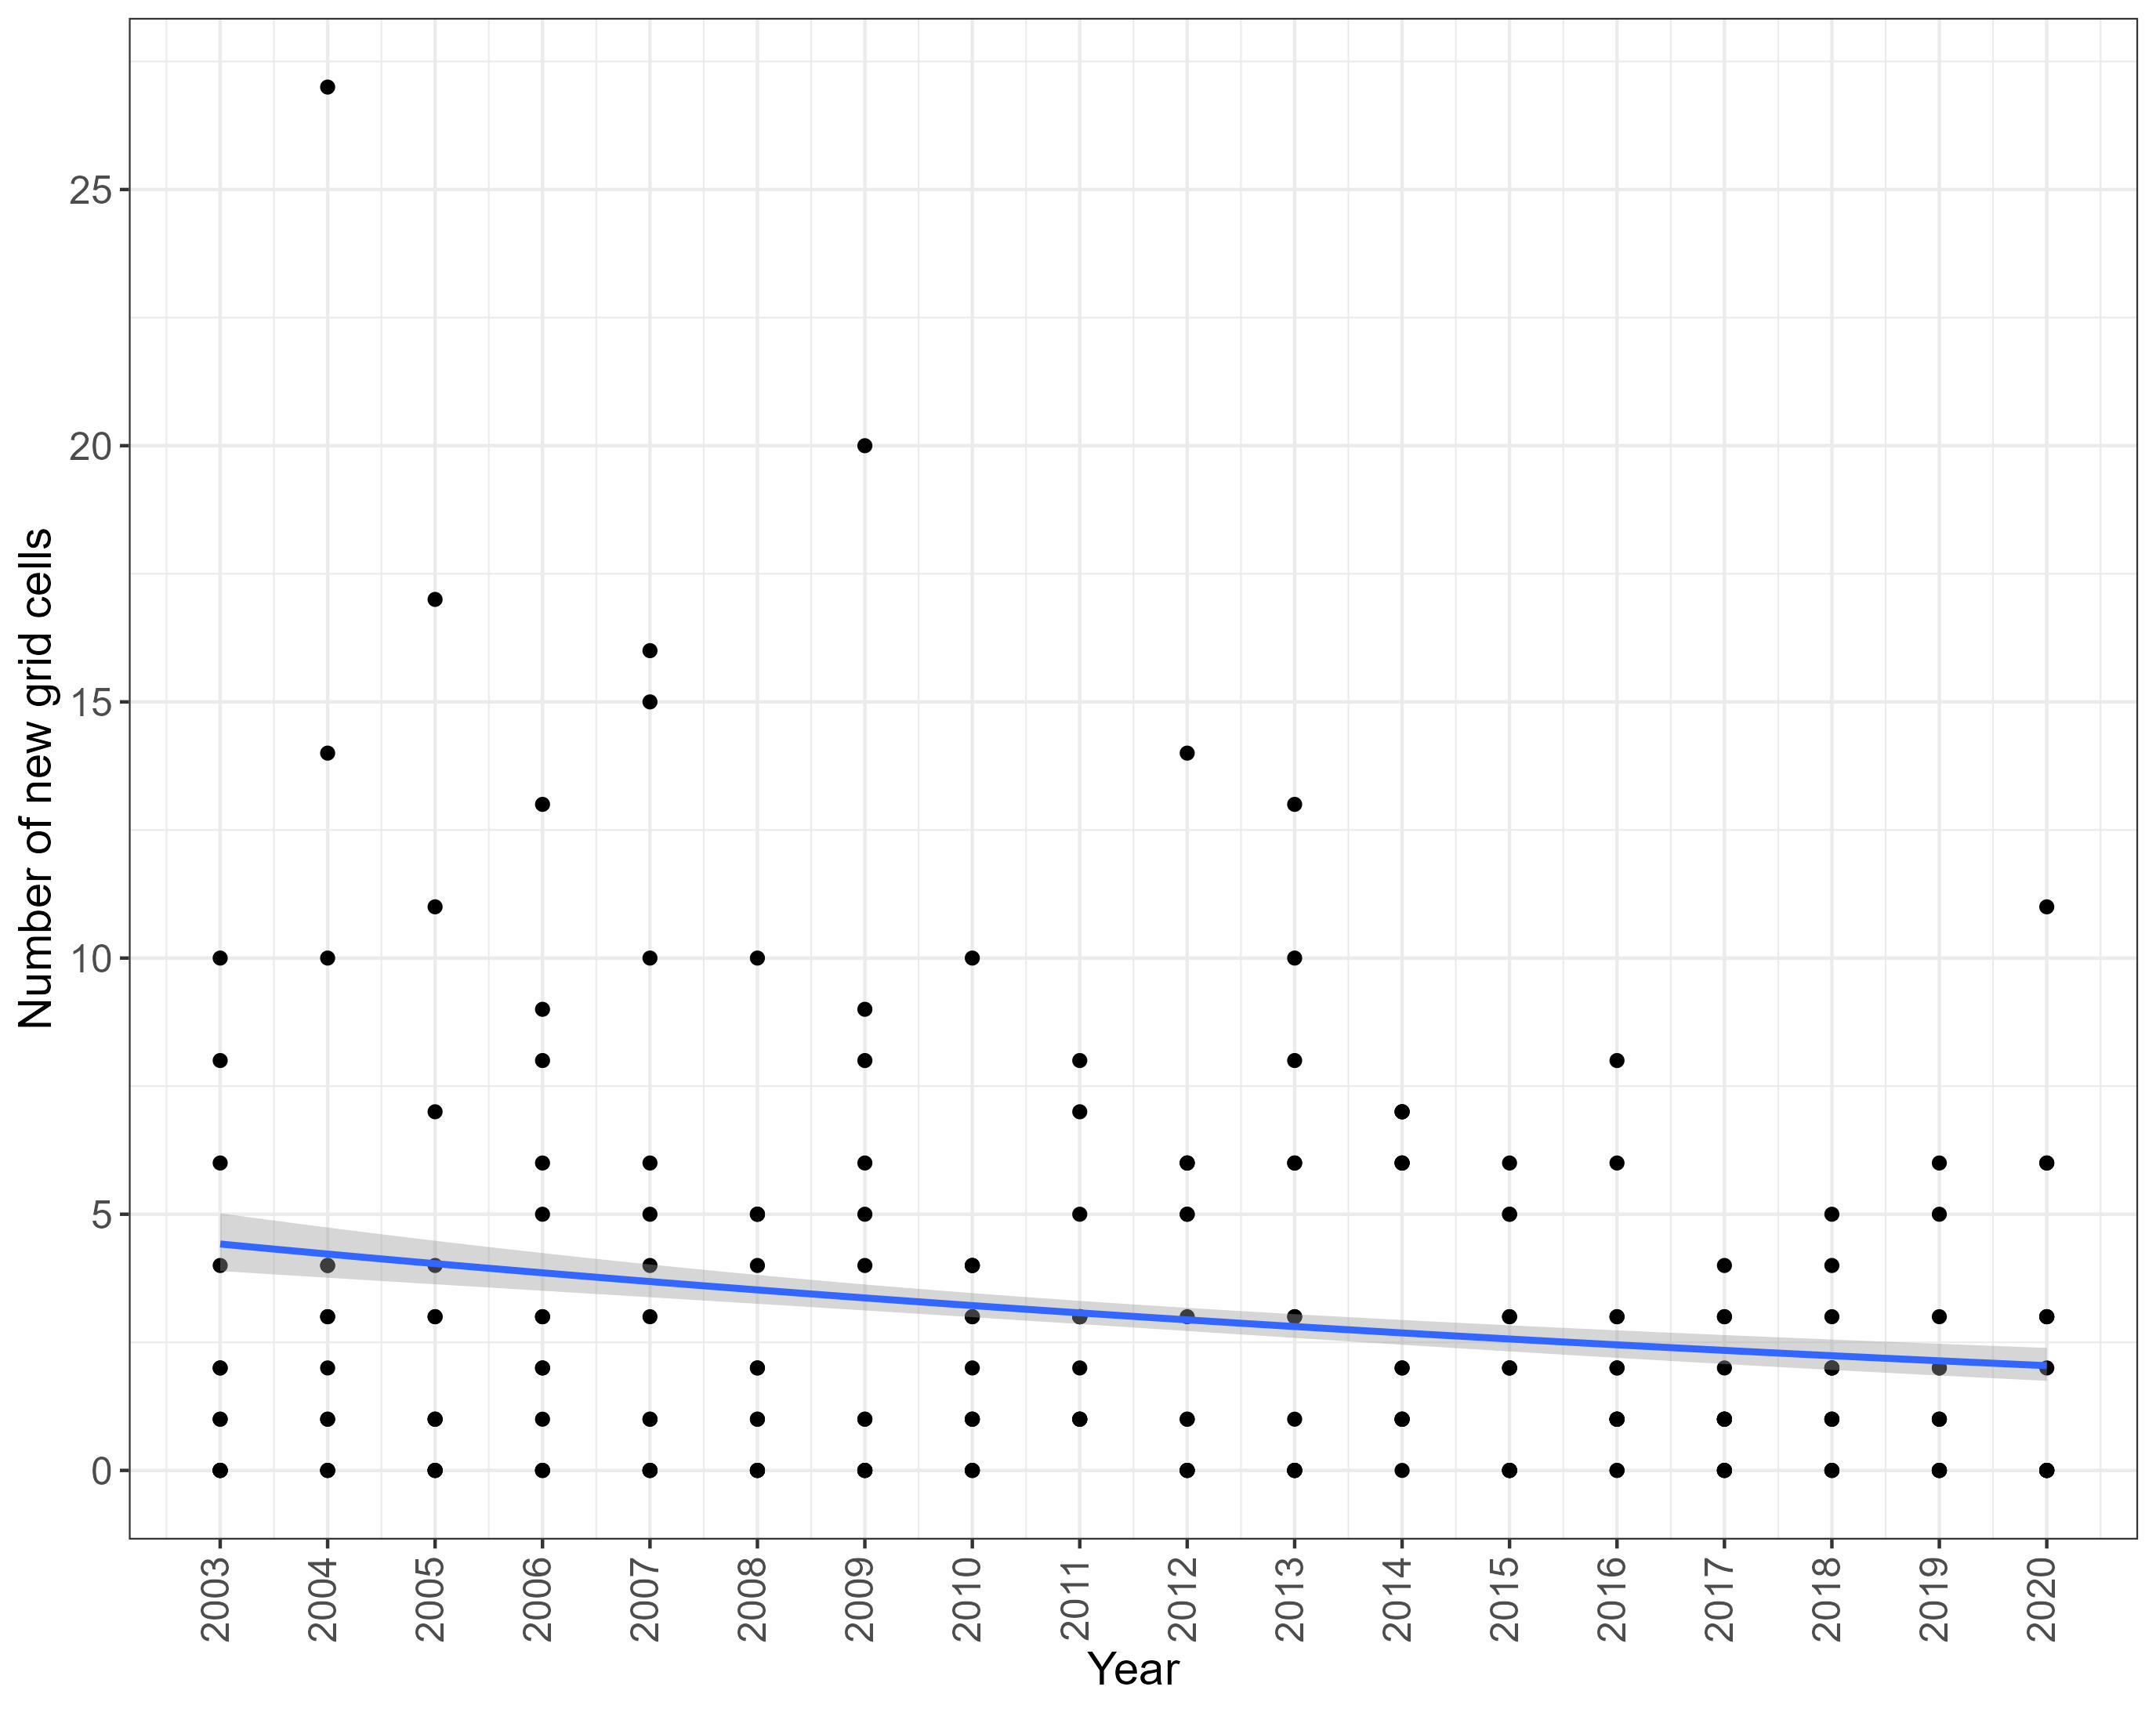
Figure 3. The number of new grid cells occupied by assessed NIS each year between 2003 and 2020. Line represents Generalised Linear Model of Poisson family, with standard error depicted by shading.
The trend in number of new grid cells occupied over the time from 2003-2020 differed between species. A statistically significant decrease in number of new cells occupied from 2003 to 2020 was seen for Caprella mutica, Crepidula fornicata, Sargassum muticum, Solidobalanus fallax and Styela clava, while a significant increase in number of new cells occupied from 2003 to 2020 was seen for Grateloupia turuturu. No significant relationship between number of new grid cells and time was found for the remaining seven species (Figure 4, Table 2).

Figure 4. The number of new grid cells occupied by each assessed NIS each year between 2003 and 2020. Lines represent Generalised Linear Model of Poisson family, with standard error depicted by shading. Red symbols denote statistically significant decrease (-) or increase (+) in number of new cells between 2003 and 2020.
Table 2. Outputs from Generalised Linear Models testing the effect of year on number of new grid cells for each assessed NIS. Species for which year had a significant effect on number of new grid cells (i.e. P value < 0.05) are in bold. Values are rounded to 4 decimal places.
|
Species name |
Estimate |
Standard error |
Z value |
P value |
|
Bonnemaisonia hamifera |
-0.0567 |
0.0361 |
-1.57 |
0.1164 |
|
Caprella mutica |
-0.144 |
0.0248 |
-5.8018 |
<0.001 |
|
Crepidula fornicata |
-0.0875 |
0.0188 |
-4.6434 |
<0.001 |
|
Diadumene lineata |
0.1073 |
0.0702 |
1.528 |
0.1265 |
|
Ensis leei |
-0.0054 |
0.0346 |
-0.1558 |
0.8762 |
|
Ficopomatus enigmaticus |
-0.0062 |
0.0557 |
-0.1113 |
0.9114 |
|
Grateloupia turuturu |
0.0821 |
0.0317 |
2.5876 |
0.0097 |
|
Magallana gigas |
-0.0084 |
0.0198 |
-0.4251 |
0.6708 |
|
Sargassum muticum |
-0.0387 |
0.0158 |
-2.4447 |
0.0145 |
|
Solidobalanus fallax |
-0.2007 |
0.0733 |
-2.7381 |
0.0062 |
|
Styela clava |
-0.0579 |
0.0197 |
-2.9368 |
0.0033 |
|
Undaria pinnatifida |
0.0198 |
0.0342 |
0.5786 |
0.5628 |
|
Urosalpinx cinerea |
-0.0422 |
0.0691 |
-0.6104 |
0.5416 |
In general, the number of new 10km grid cells occupied by the assessed NIS differed between the assessed periods. More specifically, significantly fewer new cells were occupied by assessed NIS in Period 3 compared to Period 1 (Estimate = -0.677, Standard error = 0.0992, Z value = -6.820, P <0.001), and in Period 3 compared to Period 2 (Estimate = -0.582, Standard error = 0.100, Z value = -5.77, P < 0.001) (Figure 4). A statistically significant difference in the number of new grid cells was not found between Period 1 and 2.
Species level analysis highlighted that for five assessed NIS there was significant differences in the number of new cells occupied between assessed periods (Figure 5, Table 3). For Caprella mutica, Crepidula fornicata, Sargassum muticum and Styela clava statistically significantly fewer new cells were occupied in Period 3 compared to Period 1. For Caprella mutica and Crepidula fornicata and Styela clava statistically significantly fewer new cells were occupied in Period 3 compared to Period 2. For Grateloupia turuturu, statistically significantly more new cells were occupied in Period 2 compared to Period 1. No statistically significant differences between periods were found for the remaining eight species.
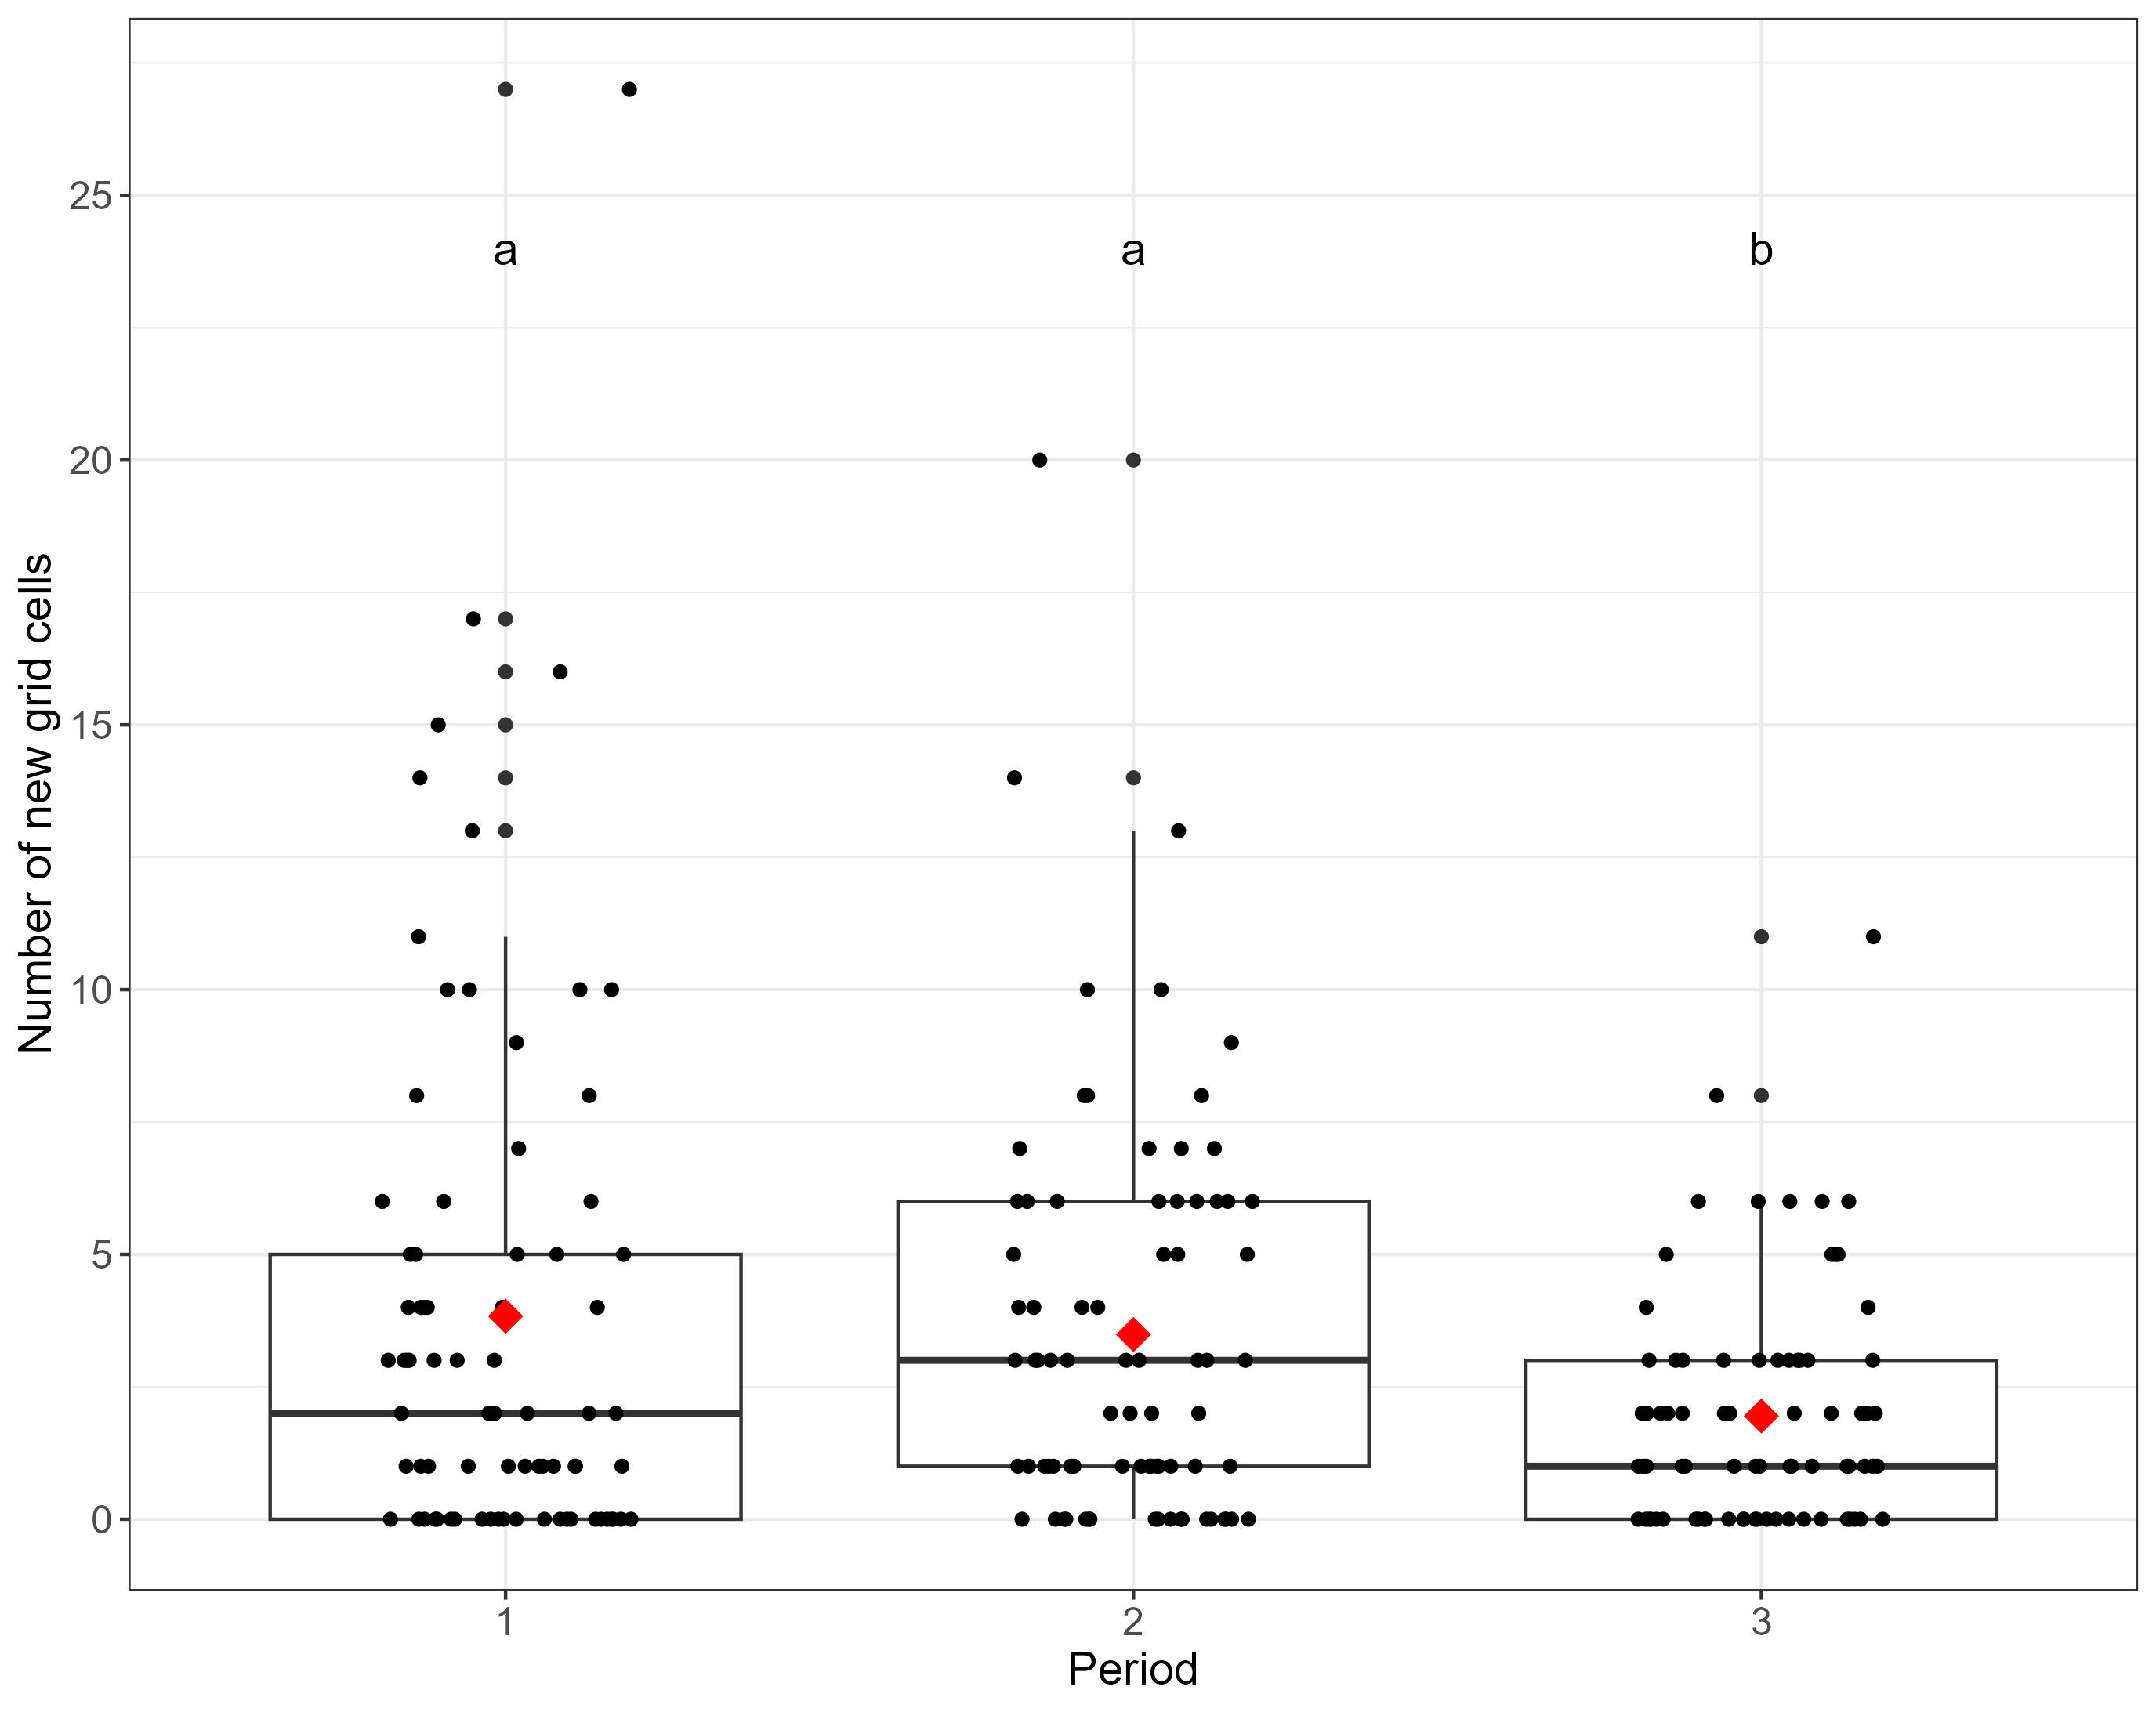
Figure 5. Number of new cells occupied by each species per year grouped by period. Text labels denote the outcome of post-hoc Tukey pairwise comparison such that Period 3 differs significantly from Period 1 (P<0.01) and Period 2 (P<0.01). Scatter points are jittered to allow all points to be visualised. Red diamonds demote mean number of new grid cells.
Table 3. Outputs from Generalised Linear Model post-hoc Tukey pairwise comparisons of number of new grid cells between assessed periods. Only outputs for species for which period had a significant impact on number of new cells are shown. Comparisons which are significant (i.e. P <0.05) are shown in bold. Values are rounded to 4 decimal places.
|
Species Name |
Comparison |
Estimate |
Standard Error |
Z value |
P value |
|
Caprella mutica |
P 2 - P 1 |
-0.3844 |
0.2292 |
-1.6773 |
0.1982 |
|
P 3 - P 1 |
-2.7515 |
0.5954 |
-4.6211 |
<0.001 |
|
|
P 3 - P 2 |
-2.3671 |
0.6037 |
-3.9207 |
<0.001 |
|
|
Crepidula fornicata |
P 2 - P 1 |
-0.3228 |
0.2026 |
-1.5931 |
0.2447 |
|
P 3 - P 1 |
-1.1701 |
0.2698 |
-4.3367 |
<0.001 |
|
|
P 3 - P 2 |
-0.8473 |
0.2817 |
-3.0076 |
0.0070 |
|
|
Grateloupia turuturu |
P 2 - P 1 |
1.204 |
0.4655 |
2.5866 |
0.0255 |
|
P 3 - P 1 |
0.9163 |
0.483 |
1.8969 |
0.1366 |
|
|
P 3 - P 2 |
-0.2877 |
0.3416 |
-0.8422 |
0.6729 |
|
|
Sargassum muticum |
P 2 - P 1 |
-0.2469 |
0.1887 |
-1.3079 |
0.3899 |
|
P 3 - P 1 |
-0.5213 |
0.2048 |
-2.5455 |
0.0291 |
|
|
P 3 - P 2 |
-0.2744 |
0.2152 |
-1.2752 |
0.4084 |
|
|
Styela clava |
P 2 - P 1 |
-0.2177 |
0.2208 |
-0.9859 |
0.5830 |
|
P 3 - P 1 |
-0.9383 |
0.278 |
-3.3748 |
0.0020 |
|
|
P 3 - P 2 |
-0.7205 |
0.2874 |
-2.5074 |
0.0321 |
Grid cells occupied by assessed NIS were generally more concentrated in the south of the UK (south of England). Combining all species, a positive trend in the latitude of first records per grid cell between 2003 and 2020 was seen (Estimate = 0.117, Standard error = 0.0166, t(723) = 7.04, P < 0.001) (Figure 7), indicating an apparent northward spread. However, the specific relationships between year and latitude depends on the NIS. More specifically a positive relationship was seen for Crepidula fornicata, Ensis leei, Grateloupia turuturu, Magallana gigas, Sargassum muticum and Styela clava, suggesting that new populations of these species were reported further north over time. A negative relationship is seen for Diadumene lineata, suggesting that new populations of this species were reported further south over time (Figure 8, Table 4). No significant relationship between latitude and time was found for the remaining six species.

Figure 6. Number of new cells occupied per year grouped by assessed period for each assessed NIS. Text labels denote the outcome of post-hoc Tukey pairwise comparisons. Scatter points are jittered to allow all points to be visualised. Red diamonds denote mean number of new grid cells. Letters indicate where differences between periods occurred.
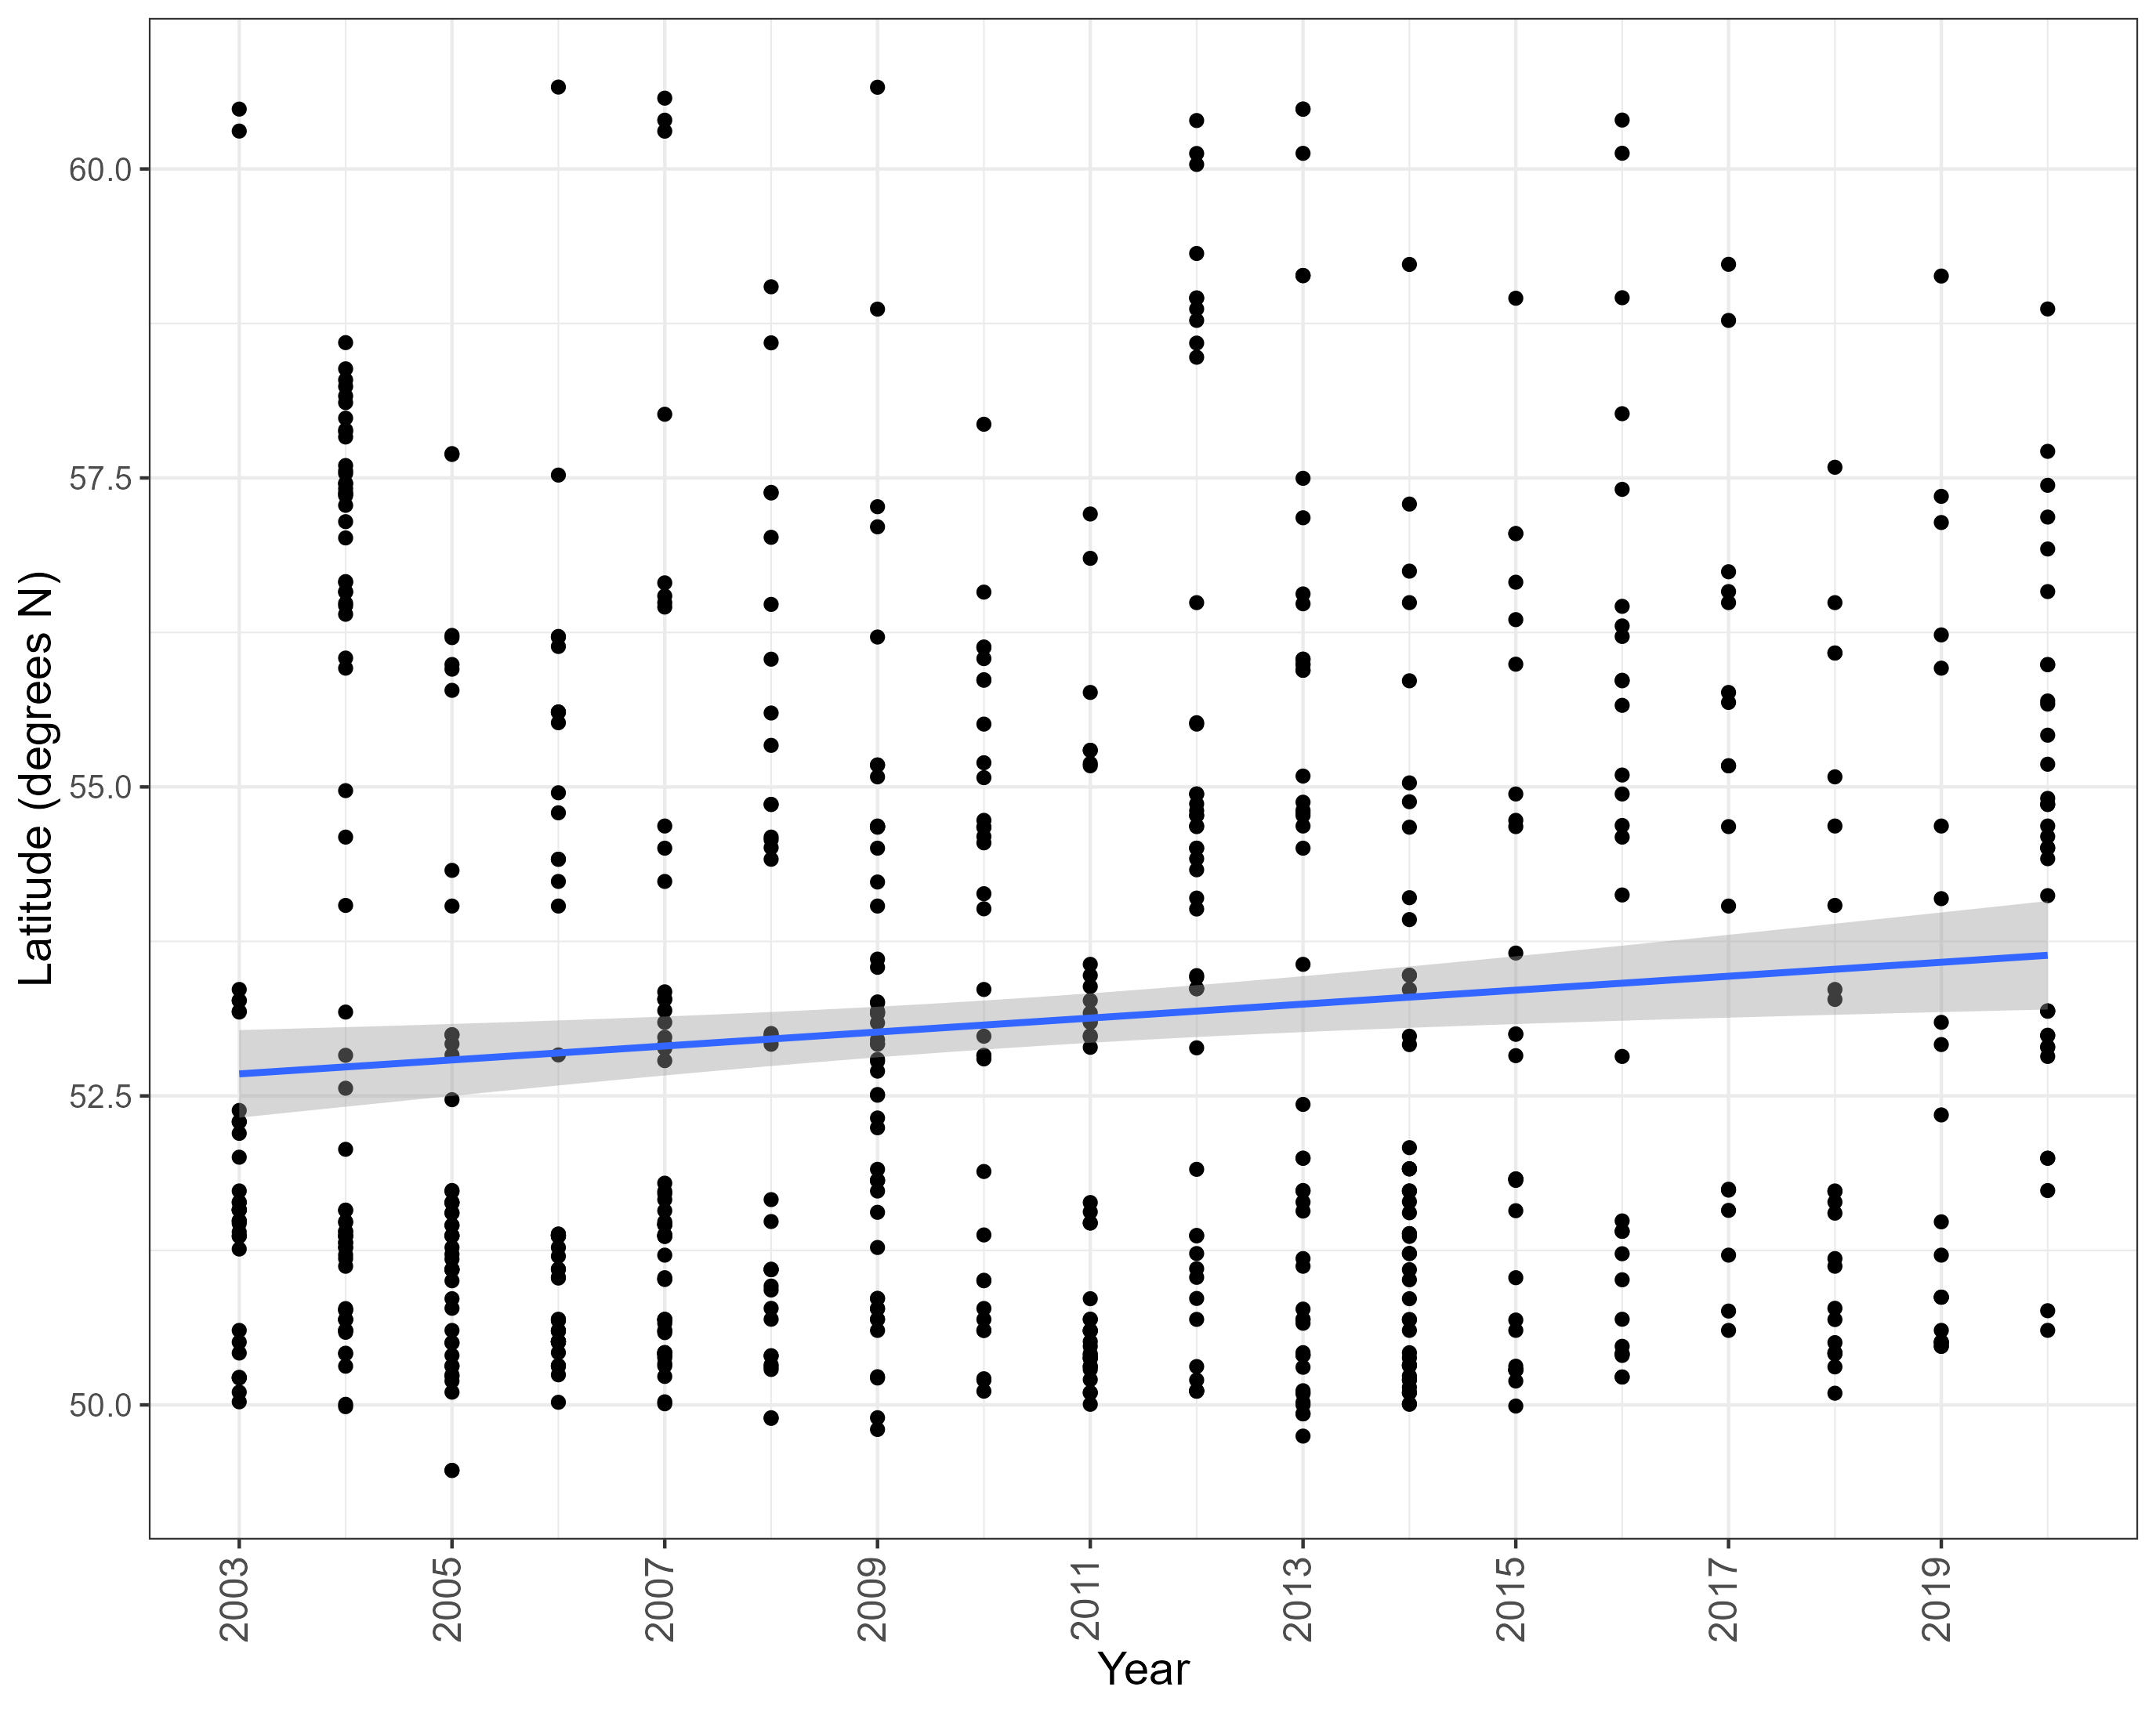
Figure 7. The latitude of grid cells newly occupied by assessed NIS each year. Blue lines represent linear regression with shading denoting standard error.
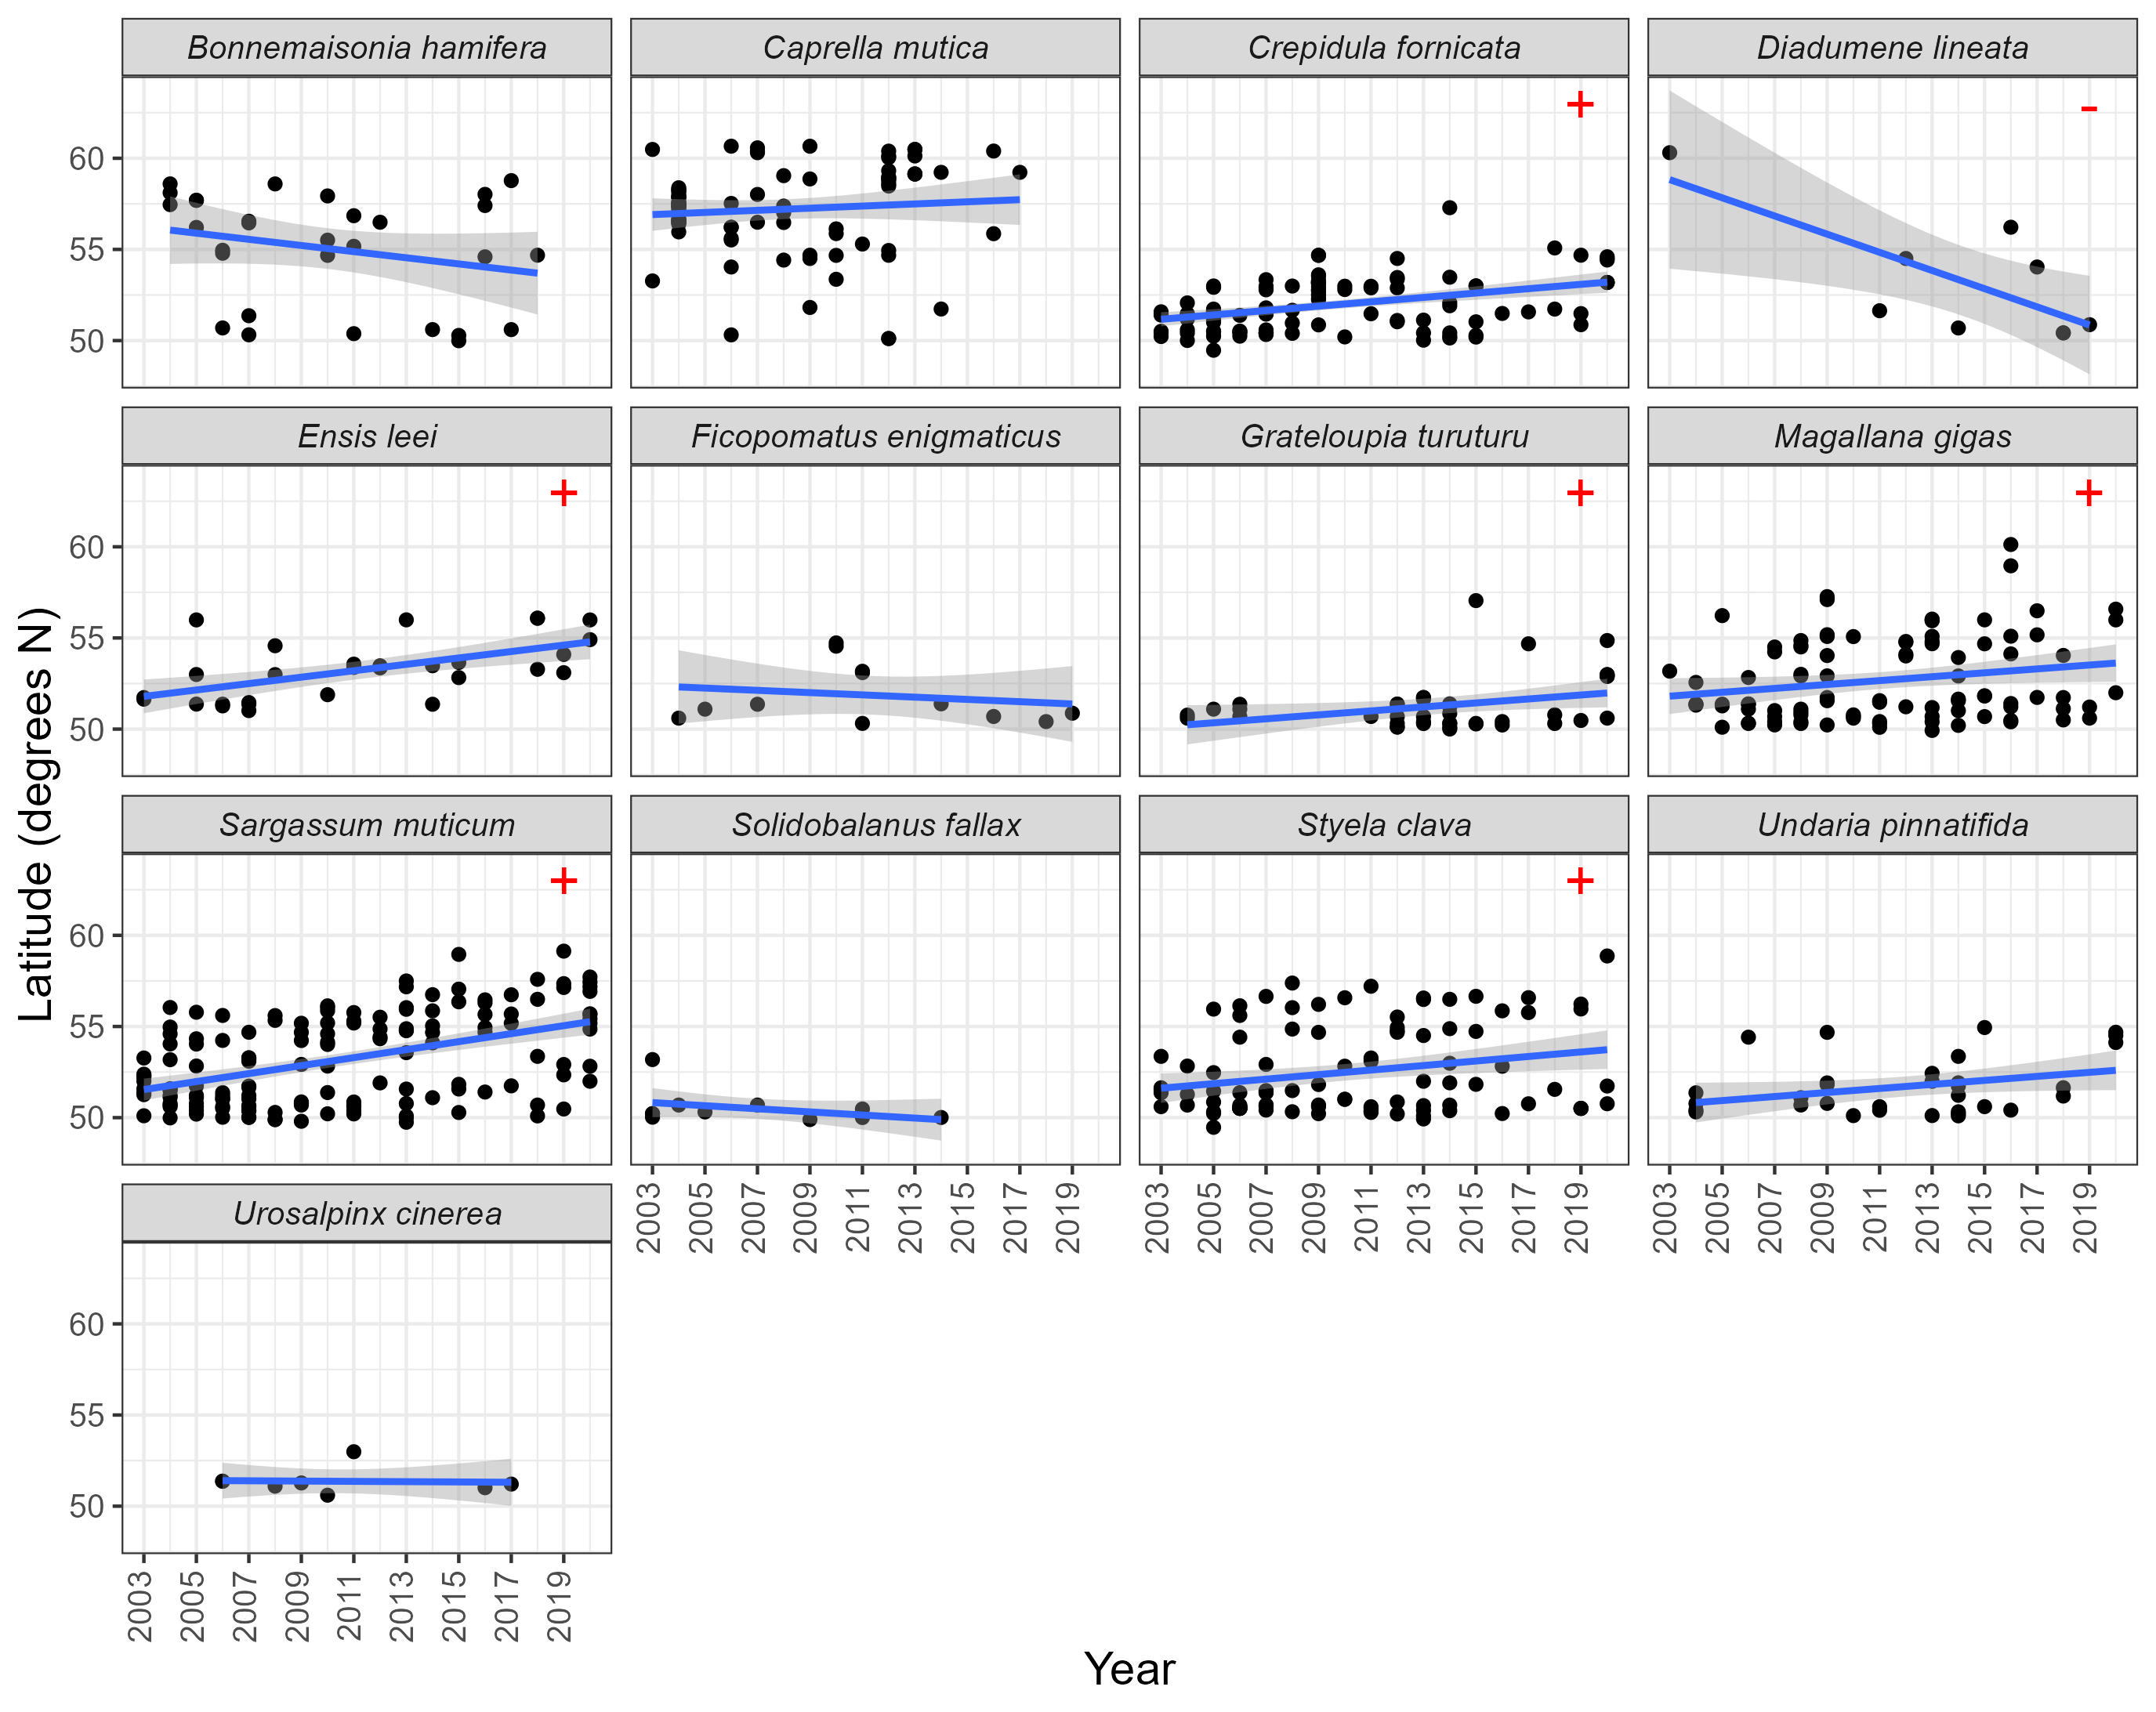
Figure 8. The latitude of grid cells newly occupied by assessed NIS each year. Blue lines represent linear regression with shading denoting standard error. Red symbols denote statistically significant decrease (-) or increase (+) in latitude over time.
Table 4. Outputs from Linear Models assessing grid cell latitude between 2003 and 2020. Model outputs which are significant (i.e. P <0.05) are shown in bold (which are positive for all but Diadumene lineata). Values are rounded to 4 decimal places.
|
Species Name |
Estimate |
Standard Error |
t value |
P value |
|
Bonnemaisonia hamifera |
-0.1686 |
0.1205 |
-1.3989 |
0.1728 |
|
Caprella mutica |
0.0584 |
0.0713 |
0.819 |
0.4152 |
|
Crepidula fornicata |
0.1197 |
0.025 |
4.7889 |
<0.0001 |
|
Diadumene lineata |
-0.4986 |
0.1696 |
-2.9393 |
0.0217 |
|
Ensis leei |
0.1758 |
0.0459 |
3.8271 |
0.0006 |
|
Ficopomatus enigmaticus |
-0.0622 |
0.1046 |
-0.5941 |
0.5656 |
|
Grateloupia turuturu |
0.1089 |
0.0502 |
2.1714 |
0.036 |
|
Magallana gigas |
0.1068 |
0.0529 |
2.0169 |
0.0466 |
|
Sargassum muticum |
0.219 |
0.0331 |
6.6114 |
<0.0001 |
|
Solidobalanus fallax |
-0.085 |
0.0646 |
-1.3156 |
0.2177 |
|
Styela clava |
0.1242 |
0.0481 |
2.5853 |
0.0112 |
|
Undaria pinnatifida |
0.1106 |
0.0576 |
1.9209 |
0.0643 |
|
Urosalpinx cinerea |
-0.008 |
0.0685 |
-0.1174 |
0.9104 |
This indicator assessment focusses on established invasive NIS meeting the four criteria. It is accepted that in most cases, invasive species abundance and distribution follows a logistic curve, the so called ‘invasion curve’, where increase is initially slow, then accelerates, before reaching a plateau (Ahmed and others, 2022; Lodge and others, 2016). Therefore, the overall reduction in number of new grid cells occupied by assessed NIS over time could be explained by their position on the invasion curve, (i.e. the species being close to or within the plateau phase), though confirmation of this would require more robust monitoring data and further analyses.
The interspecies variation in the number of new grid cells occupied over time could be explained by differing life history strategies, behaviours and physiology. . For example, reproductive success, a planktonic larval stage, resource utilisation and environmental tolerances are key factors driving the establishment and spread of marine NIS (Geburzi and McCarthy, 2018). While all species assessed here are defined as invasive NIS and therefore have traits commonly associated with high invasiveness, for some species such traits may be more pronounced or more beneficial in the risk assessment area. However, evidence to inform our understanding of traits, behaviours and physiology of invasive NIS in UK waters is very limited.
In addition to unaided dispersal, the spread of invasive NIS within UK waters can occur via human activity mediated pathways. The number, spatial extent and level of activity associated with pathways, to which spread of the established invasive NIS within UK waters may be attributed, could therefore explain the interspecies variation seen. Key relevant human mediated pathway categories, as defined in the Convention of Biological Diversity, include transport-contaminant, transport – stowaway, release in nature and escape from confinement (Harrower and others, 2018). Risk of introduction of marine NIS into the UK has previously been assessed using a pathway activity analysis approach (e.g. Shucksmith and Shelmerdine, 2015; Tidbury and others, 2016). While tools and approaches to assess the risk of NIS dispersal via the unaided pathway within UK waters exist, their application is limited to very few species such as Magallana gigas (Wood and others, 2021). Hence lack of understanding of risk of spread of the assessed NIS via key pathways limits our ability to confidently attribute interspecies variation to pathway activity.
Management of the assessed NIS, across the entire UK marine environment, has not been implemented. However, generic biosecurity approaches such as “Check, Clean, Dry”, aimed to limit the spread of NIS in the aquatic environment, are operational at a UK level. Whilst initially targeting the freshwater environment, a marine version of the Check, Clean, Dry campaign was launched in 2015 and might have contributed to the decline in number of new locations in which the assessed species were recorded in the third period. In particular, this could be the case for NIS such as Styela clava which are known to be spread as biofouling. The introduction and spread of number of the assessed species (e.g. Magallana gigas, Urosalpinx cinerea) may be linked to aquaculture activity. Increased awareness of NIS within the aquaculture sector and enhanced biosecurity practices in line with Aquatic Animal Health Regulations (e.g. Aquatic Animal Health (England and Wales) Regulations 2009, and equivalent in Scotland and Northern Ireland), though focussed on aquatic pathogens, during the assessment period, may have contributed to the decline in number of new locations in which the assessed species were recorded over time. Marine biosecurity guidance for Scotland, and England and Wales was also published in 2014 and 2015, respectively (Marine biosecurity » NNSS (nonnativespecies.org)) and could have also contributed to the slow in spread of NIS across the periods. However, a formal and comprehensive assessment of awareness and the uptake and efficacy of such biosecurity measures and targeted biosecurity plans in the UK marine environment will be required to confirm their role in slowing the spread of marine NIS (O’Shaughnessy, 2023).
Further examples of measures which could slow the spread of NIS are pathway action plans including The Recreational Boating and Recreational Angling Pathway Action Plans for GB and Northern Ireland which were introduced in 2020 (e.g. Angling PAP for Great Britain » NNSS (nonnativespecies.org) and The Merchant Shipping (Control and Management of Ships’ Ballast Water and Sediments) Regulations 2022 which implement the International Ballast Water Management Convention. Given the timing of these, they will not have impacted the current assessment results but will require consideration in future assessments.
Assessment of activity for pathways associated with the introduction of marine NIS highlights risk hotspots in the south of England (Tidbury and others, 2016). The trend of species occupying cells at higher latitude over time could therefore be explained by increased probability of introduction into south of England such that their spread will naturally follow a northwards trend. Monitoring may also have been concentrated in the south if focussed on of sites at high risk of NIS introduction and spread, making early detection of the priority NIS more likely in the south.
The trend of species occupying cells at higher latitude over time could also be linked to climate change and warming waters, whereby species with preference for warmer waters are able to survive in more northerly locations as temperatures warm to levels within their tolerance range and climatic barriers shift. The northward spread of invasive species due to climate change has been predicted and demonstrated both at UK and broader spatial scales, though over a much longer timeframe than reported for this assessment ((King and others, 2021; Townhill and others, 2017). Spawning and maturation are also often temperature dependant with increased spawning events and reduced maturation time predicted under warming waters associated with climate change for some NIS, including Magallana gigas (King and others, 2021; Teixeira Alves and others, 2021). Coupled with the potential for reduced efficacy of management measures under future climate scenarios (Teixeira Alves and Tidbury, 2022), all else being equal, the spread and abundance of invasive species is likely to increase into the future. Despite the apparent reduction in new locations occupied by assessed NIS, the role of climate change in the spread of invasive species cannot be robustly considered in this assessment, due to its short time frame (18 years), an absence of abundance data and limitations with respect to monitoring.
Monitoring and recording biases and data gaps may also contribute to the apparent reduction in new populations from 2003 to 2020, and in Period 3. The detection potential of some NIS is higher than others, for example, due to striking morphological characteristics or their tendency to inhabit/attach to more accessible and more regularly surveyed habitats or infrastructure. Citizen’s awareness and motivation to collect information on NIS could also influence the recordings evolving over time from its initial introduction, especially for those species with already wide geographic non-native range. There may also be some regions with high concentrations of marine species recorders from causal or citizen science initiatives (for example volunteer groups such as Seasearch).
Conclusions
This assessment demonstrates and applies a method to assess changes in the number of new populations of established invasive marine NIS in UK marine waters for the first time. Results indicate that although the distribution of established invasive NIS in UK waters is expanding, the number of reported new populations of established invasive NIS may have decreased between 2003 and 2020, evidenced also by an apparent reduction in the number of reported new populations between Period 3 (2015 – 2020), and Period 1 (2003-2008) and 2 (2009 – 2014).
However, the trend in number of reported new populations varies between assessed NIS. Four assessed NIS (Caprella mutica, Crepidula fornicata, Sargassum muticum, Solidobalanus fallax, Styela clava) showed a significant reduction in new populations over time, one assessed NIS (Grateloupia turuturu) showed a significant increase in new populations from 2003 to 2020, while for the remaining seven species no significant change in number of new populations was found. Further, for four (Caprella mutica, Crepidula fornicata, Sargassum muticum, Styela clava) and one (Grateloupia turuturu) assessed NIS a significant decrease or increase, respectively, in new populations between periods was found, while for the remaining eight species no significant difference between periods was found.
This assessment should be interpreted with caution given limitations associated with NIS monitoring data. In particular, the lack of consistent and comprehensive monitoring programmes designed to detect NIS as well as lags in data flow are significant weaknesses. It is unclear to what extent these weaknesses have driven the observed trends and therefore there is low confidence in the assessment results
Further information
The lack of consistent and comprehensive monitoring for NIS in the marine environment, both spatially and temporally, significantly limits confidence in this indicator assessment. More specifically, without monitoring across the risk assessment area, some populations of established invasive NIS may not have been recorded, resulting in underestimation of their distribution. Further, temporal peaks in new occurrence records may be the result of increased monitoring effort at certain times, and spatial clustering of species records may be the results of increased monitoring effort in specific locations. The time between the occurrence of a species in a specific location and it being recorded could be significant (many years in some cases) and impact the accurate assessment of changes in species distribution over time.
In line with the OSPAR 2023 QSR report ‘Trends in New Records of Non-Indigenous Species (NIS) Introduced by Human Activities’, this indicator assessment is based on data from 2003 up to and including 2020. While using historic occurrence records should mitigate against issues with missing data resulting from lags and gaps in NIS data flow, missing data could explain the apparent decreasing trend in new cells occupied by the assessed NIS over time, especially given that in most cases, a reduction in new cells appears in Period III. In addition to the lack of routine NIS monitoring in the UK marine environment, there is no single repository for marine NIS occurrence records increasing the risk of duplication and gaps in NIS records. Improved monitoring (Wood et al., 2024) and access to NIS data is crucial to improve the robustness of NIS assessments (Cefas, 2024).
As this is the first time an assessment has been undertaken for this indicator, ‘The number of new populations of established NIS’, it was not possible to compare results with previous assessments. No threshold has been set for this indicator, so in line with assessment against the primary NIS indicator ‘The number of new NIS’, the focus is on exploring trends in distribution of established invasive NIS.
Exclusion of data points outside the UK Marine Strategy assessment area, in particular within transitional waters, may affect conclusions drawn. High risk locations for the introduction, spread and establishment of NIS, such as ports, marinas, and aquaculture sites, may fall within transitional waters. In this assessment, greater than 4000 species occurrence records were excluded based on their location within transitional waters. While it is the relative change over time within the same assessment area that is being assessed, exclusion of NIS records from transitional waters impacts the robustness and accuracy of this assessment.
The method developed, which is based on assessment using 10km grid cells, somewhat mitigates against issues with duplicate occurrence records and spatial reference errors. However, this method does not allow assessment at a higher spatial resolution. A 10km area is relatively large such that multiple discrete populations of an NIS could be present within each grid cell. While capturing NIS spread at the broad assessment area scale, quantifying new populations at a 10km grid cell scale may significantly underestimate NIS spread at more localised scales. On the other hand, using the 10km grid cell method, a single large population which traverses grid cell boundaries could be considered multiple populations, thereby overestimating NIS spread. While the developed method provides a proof of concept and enables changes over time to be examined, future assessments should attempt to build on this and examine spread at a smaller spatial scale, if and where data allow.
Despite the aforementioned limitations, this assessment describes and demonstrates a straightforward and transparent methodology which provides a foundation to assess ‘the number of new populations of established invasive NIS’. Development and implementation of coordinated and harmonised monitoring, using standardised methods, across UK is required to address the issues listed above and to provide accurate datasets to underpin robust assessments into the future. Further improvement to flow and curation of marine NIS occurrence records for UK will aid the speed and accuracy with which subsequent assessments can be undertaken.
Knowledge gaps
In the absence of robust monitoring programmes, and metadata available for each survey and or site surveyed to enable quantification of monitoring effort for NIS and how it might affect observed trends, confidence in the assessment results is very low. Also, our understanding of connectedness between populations of priority NIS is poor, limiting our ability to distinguish new introductions from spread events, and attribute a new population to a particular origin or pathway. Finally, our understanding of natural NIS range shifts in response to changes in climate is limited.
Further information
Monitoring effort is not well documented making it difficult to eliminate change in monitoring effort as the reason for a change in the number of new populations of established invasive NIS. As recommended under the OSPAR 2023 QSR report ‘Trends in New Records of Non-Indigenous Species (NIS) Introduced by Human Activities’, development of an approach to capture monitoring effort, incorporating absence data, including sites where successful eradication has taken place and accounting for variation in detection probability of priority NIS by different methods, is necessary. Further, measures to improve NIS reporting and efficient data flow is required to ensure NIS occurrence data are accessible for use in assessments (Cefas, 2024).
The purpose of this indicator assessment is to assess the spread of established invasive NIS over time. However, it is not known whether new records of species are the result of spread from populations already established in UK marine waters, or in fact organisms introduced from outside the UK. Further examination of pathways attributed to introduction of NIS into UK waters is required. Population genetics studies will be valuable in gaining a greater understanding of relatedness and connectivity between populations of priority species, and insight into likely pathways of introduction/spread, though low genetic diversity for NIS may limit the outcomes of such work (Hagenblad and others, 2015) .
An increase in geographic extent of invasive NIS is likely a good proxy for increased impact. However, without any reliable metrics to quantify NIS impact, and in the absence of data on abundance of the NIS and the composition and structure of the native community into which the NIS has spread, translating the extent of distribution to impact is challenging. Improved evidence to support understanding of impacts is crucial and highlighted as a key priority in the GB INNS Evidence Strategic Plan (INNS Research Working Group, 2022). Currently abundance data are not available from all surveys from which data were used in the assessment and therefore could not be included in this assessment. Acquisition of abundance data in addition to community composition information will be highly valuable for future assessments.
Into the future, large monitoring programmes such as the marine Natural Capital Ecosystem Assessment (mNCEA) programme in England may contribute to addressing knowledge gaps around data flow, monitoring effort, abundance and community composition. However, such programmes are also likely to result in an influx of marine data, including NIS occurrence records. This will need to be considered in subsequent assessments.
Distinguishing NIS range expansion due to climate change from human mediated NIS spread remains a challenge. A greater understanding of the environmental tolerances of NIS and potential shifts in range under future climate scenarios is crucial and aligns with aspirations under the UK Government’s National Adaptation Programme 3.
References
Ahmed, D.A., Hudgins, E.J., Cuthbert, R.N., Kourantidou, M., Diagne, C., Haubrock, P.J., Leung, B., Liu, C., Leroy, B., Petrovskii, S., Beidas, A., Courchamp, F. (2022). Managing biological invasions: the cost of inaction. Biological Invasions 24, 1927–1946.
Cefas (2024). Improving marine NIS data access and flow efficiency. Defra Report. Cefas Project Code C8530.
HM Government (2014). Marine Strategy Part Two: UK Marine Monitoring Programmes. https://assets.publishing.service.gov.uk/media/5a7efecded915d74e6227ca0/msfd-part-2-final.pdf
HM Government (2015). Marine Strategy Part Three: UK Programme of Measures. https://assets.publishing.service.gov.uk/media/5a80330040f0b6230269218c/marine-strategy-part3-programme-of-measures.pdf
HM Government (2019). Marine Strategy Part One: UK Updated Assessment and Good Environmental Status. https://assets.publishing.service.gov.uk/media/5f6c8369d3bf7f7238f23151/marine-strategy-part1-october19.pdf
HM Government (2022). Marine Strategy Part Two: UK Updated Monitoring Programmes. https://www.gov.uk/government/publications/marine-strategy-part-two-uk-marine-monitoring-programmes
HM Government (2025). Marine Strategy Part Three: 2025 UK Programme of Measures https://www.gov.uk/government/publications/marine-strategy-part-three-2025-uk-programme-of-measures
Geburzi, J.C., McCarthy, M.L. (2018). How Do They Do It? – Understanding the Success of Marine Invasive Species. YOUMARES 8 – Oceans Across Boundaries: Learning from each other 109–124.
Hagenblad, J., Hülskötter, J., Acharya, K.P., Brunet, J., Chabrerie, O., Cousins, S.A.O., Dar, P.A., Diekmann, M., De Frenne, P., Hermy, M., Jamoneau, A., Kolb, A., Lemke, I., Plue, J., Reshi, Z.A., Graae, B.J. (2015). Low genetic diversity despite multiple introductions of the invasive plant species Impatiens glandulifera in Europe. BMC Genetics 16, 1–16.
Harrower, C.A., Scalera, R., Pagad, S., Schonrogge, K., Roy, H.E. (2018). Guidance for interpretation of CBD categories on introduction pathways. Invasive alien species guidance for interpretation of the categories on introduction pathways under the Convention on Biological Diversity.
Hughes, E., Wood, C.A., Bishop, J.D., Arnold, M., Griffiths, C., Sewell, J., Lear, D. (2016). Collating baseline invasive non-indigenous species data for MSFD reporting. Report by Marine Biological Association for Defra, Project ME5223.
INNS Research Working Group (2022). GB INNS Evidence Strategic Plan. Produced by the INNS Research Working Group on behalf of the UK Non-native Species Programme Board.
King, N.G., Wilmes, S.B., Smyth, D., Tinker, J., Robins, P.E., Thorpe, J., Jones, L., Malham, S.K. (2021). Climate change accelerates range expansion of the invasive non-native species, the Pacific oyster, Crassostrea gigas. ICES Journal of Marine Science 78, 70–81.
Lodge, D.M., Simonin, P.W., Burgiel, S.W., Keller, R.P., Bossenbroek, J.M., Jerde, C.L., Kramer, A.M., Rutherford, E.S., Barnes, M.A., Wittmann, M.E., Chadderton, W.L., Apriesnig, J.L., Beletsky, D., Cooke, R.M., Drake, J.M., Egan, S.P., Finnoff, D.C., Gantz, C.A., Grey, E.K., Hoff, M.H., Howeth, J.G., Jensen, R.A., Larson, E.R., Mandrak, N.E., Mason, D.M., Martinez, F.A., Newcomb, T.J., Rothlisberger, J.D., Tucker, A.J., Warziniack, T.W., Zhang, H., (2016). Risk Analysis and Bioeconomics of Invasive Species to Inform Policy and Management. Annual Review of Environment and Resources 41, 453–488.
Moore, C., Harries, D. (2020). Monitoring for the possible spread of Didemnum vexillum into the subtidal environment of Loch Creran. Scottish Natural Heritage Research Report No. 1155.
Morgan, A., Slater, M., Mortimer, N., McNie, F., Singfield, C., Bailey, L., Covey, R., McNair, S., Waddell, C., Crundwell, R., Gall, A., Selley, H., Packer, N. (2021). Partnership led strategy to monitor and manage spread of Pacific oyster populations in south Devon and Cornwall. Natural England Research Reports, NERR100.
O’Shaughnessy, K. (2023). Audit, review and prioritisation for marine invasive non-native species biosecurity planning in England. Natural England Commissioned Report, NECR477.
Shucksmith, R.J., Shelmerdine, R.L. (2015). A risk-based approach to non-native species management and biosecurity planning. Marine Policy 59, 32–43.
OSPAR (2023). The 2023 Quality Status Report for the Northeast Atlantic. Trends in New Records of Non-Indigenous Species (NIS) Introduced by Human Activities OSPAR Commission, London
Stebbing, P.D., Tidbury, H.J., Hill, T. (2015). Development of priority species lists for monitoring and surveillance of marine non-natives in the UK. Defra Report. Cefas Project Code C6484.
Teixeira Alves, M., Taylor, N.G.H., Tidbury, H.J., (2021). Understanding drivers of wild oyster population persistence. Scientific Reports 11, 7837.
Teixeira Alves, M., Tidbury, H. (2022). Invasive non-native species management under climatic and anthropogenic pressure: application of a modelling framework. Management of Biological Invasions 13, 259–273.
Tidbury, H.J., Taylor, N.G.H., Copp, G.H., Garnacho, E., Stebbing, P.D. (2016). Predicting and mapping the risk of introduction of marine non-indigenous species into Great Britain and Ireland. Biological Invasions 18, 3277–3292.
Townhill, B., Pinnegar, J., Tinker, J., Jones, M., Simpson, S., Stebbing, P., Dye, S. (2017). Non-native marine species in north-west Europe: Developing an approach to assess future spread using regional downscaled climate projections. Aquatic Conservation 27, 1035–1050.
Wood, L.E., Clarke, S.A., Murphy, D., Davison, P.I., Thrush, M.A., Bass, D., Birchenough, S.N.R., Peeler, E.J., Tidbury, H.J. (2024). Monitoring of non-indigenous marine species for legislative and policy goals in the UK. Marine Policy 162, 106027.
Wood, L.E., Silva, T.A.M., Heal, R., Kennerley, A., Stebbing, P., Fernand, L., Tidbury, H.J. (2021). Unaided dispersal risk of Magallana gigas into and around the UK: combining particle tracking modelling and environmental suitability scoring. Biological Invasions 23(6), 1719-1738.
Citation:
Hannah Tidbury (2024). The number of new populations of established invasive Non-indigenous species indicator assessment for the UK Marine Strategy. UK Marine Online Assessment Tool, available at:https://moat.cefas.co.uk/2024-assessment/pressures-from-human-activities/non-indigenous-species/nis-spread/
Authors
Tidbury H.J1,
Acknowledgements for useful reviews and comments:
Eva Garnacho1, Ivetta Matejusova, Bernadette Moloughney2, Jan Maclennan3, Christine Wood4, Laura Grant5, Chloe Powell-Jennings5, Holly Peek5, Chris Nall6, Jenni Kakkonen7, Rebecca Giesler8, Janet Khan9, Susan McCambridge10 Olaf Booy11
1 Centre for Environment, Fisheries and Aquaculture Science
2 Marine Directorate, Scottish Government
3 Natural England
4 Marine Biological Association
5 Natural Resources Wales
6 Scotland’s Nature Agency
7 Orkney Islands Council
8 University of Highlands and Islands
9 Scottish Environment Protection Agency
10 Department of Agriculture, Environment and Rural Affairs, Northern Ireland
11 GB Non-Native Species Secretariat
Citation:
Hannah Tidbury (2024). The number of new populations of established invasive non-indigenous species indicator assessment for the UK Marine Strategy. In: UK Marine Online Assessment Tool, available at https://moat.cefas.co.uk/pressures-from-human-activities/non-indigenous-species/nis-spread/
Assessment metadata
| Assessment Type | UK Marine Strategy |
|---|---|
Non- indigenous species | |
| Point of contact email | marinestrategy@defra.gov.uk |
| Metadata date | Wednesday, January 1, 2025 |
| Title | Number of new populations of established invasive non-indigenous species. |
| Resource abstract | |
| Linkage | |
| Conditions applying to access and use | Licenced under the Open Government Licence (OGL). |
| Assessment Lineage | |
| Dataset metadata | Please see details in data-doi below |
| Dataset DOI | Non-indigenous species spatial spread in UK waters from 1890 to 2020. Cefas, UK. V1. doi: https://doi.org/10.14466/CefasDataHub.167 |
The Metadata are “data about the content, quality, condition, and other characteristics of data” (FGDC Content Standard for Digital Geospatial Metadata Workbook, Ver 2.0, May 1, 2000).
Metadata definitions
Assessment Lineage - description of data sets and method used to obtain the results of the assessment
Dataset – The datasets included in the assessment should be accessible, and reflect the exact copies or versions of the data used in the assessment. This means that if extracts from existing data were modified, filtered, or otherwise altered, then the modified data should be separately accessible, and described by metadata (acknowledging the originators of the raw data).
Dataset metadata – information on the data sources and characteristics of data sets used in the assessment (MEDIN and INSPIRE compliance).
Digital Object Identifier (DOI) – a persistent identifier to provide a link to a dataset (or other resource) on digital networks. Please note that persistent identifiers can be created/minted, even if a dataset is not directly available online.
Indicator assessment metadata – data and information about the content, quality, condition, and other characteristics of an indicator assessment.
MEDIN discovery metadata - a list of standardized information that accompanies a marine dataset and allows other people to find out what the dataset contains, where it was collected and how they can get hold of it.