
Distribution of reported impulsive sound in UK seas
Reported impulsive noise events for the period 2015 to 2021 decreased in the first three years followed by an increase since 2018. Most events occurred in the Greater North Sea. Seismic surveys were the most prevalent sound source, followed by sub-bottom profiler surveys, pile-driving and military sonar.
Background
This indicator is based on the spatio-temporal distribution of loud, low and mid frequency impulsive sound sources introduced into the marine environment through human activities. The UK Marine Strategy aims that such impulsive sounds are managed to the extent that they do not have adverse effects on marine ecosystems and animals at the population level.
Anthropogenic underwater sound can be a by-product of human activities in the marine environment (e.g., shipping or construction) or can be produced intentionally for the purposes of surveying the seabed or water column (e.g., seismic surveys).
The introduction of anthropogenic sound became widespread with the advent of motorised shipping, and now has a wide range of sources, which can be categorised as impulsive or continuous. This assessment addresses impulsive sound sources, which include impact pile driving for inshore and offshore construction (Figure 1), seismic surveys (using airguns) to map subsea oil and gas deposits (Figure 2), explosions, and some sonar sources.

Figure 1: Pile driving operation with bubble curtain. Copyright: Trianel/Lang

Figure 2: Seismic survey vessel. Copyright: GETTY Images
Impulsive sound sources have been observed to cause temporary displacement of small cetaceans (e.g., harbour porpoise, Figure 3), increased physiological stress in some fish species (e.g., European seabass, Figure 4), and developmental abnormalities in invertebrate larvae. In some cases, more severe effects such as permanent auditory damage or blast injuries are possible. While effects on individual animals have been shown for several species, there is uncertainty over whether and how the effects of anthropogenic sound on individuals are translated to the population or ecosystem scale.

Figure 3: Harbour porpoise (Phocoena phocoena). Copyright: Solvin Zankl

Figure 4: European seabass (Dicentrarchus labrax). Copyright: Citron
Further information
Human activities introduce many types of energy into the marine environment including sound, light and other electromagnetic fields, heat, and radioactive energy. Of these, the most widespread and pervasive is underwater sound. It is likely that the amount of underwater sound has been increasing since the advent of steam driven ships (Duarte and others 2021).
Sound sources can be categorised as continuous or impulsive. Impulsive sounds are pulse-like sounds of short duration and start suddenly (such as explosions, impact pile driving, seismic airguns, sonar), while continuous sounds are long lasting and do not have pulse characteristics (such as shipping, dredging). Impulsive sounds may be repeated at intervals (such as in pile driving), and this repetition may lead to sound diffusing with distance and becoming indistinguishable from continuous sound. In addition, the spread of sound is affected by its frequency, with high frequency sounds unable to propagate as well in the marine environment whereas lower frequency sounds can travel great distances in sufficiently deep waters.
Marine animals that are exposed to anthropogenic sound (e.g., harbour porpoise Phocoena phocoena, Figure 3; and European seabass, Dicentrarchus labrax; Figure 4) can be adversely affected over short timescales (acute effect) and over longer periods. Adverse effects may be subtle (e.g., temporary reduction in hearing sensitivity, physiological stress) or obvious (e.g., overt behavioural responses, death). While there is a growing body of literature on the potential effects of anthropogenic sound on individual animals (Williams and others 2015; Duarte and others 2021), obtaining direct observations of the effects of anthropogenic sound on ecosystems or populations is challenging. As such, there is uncertainty over whether and how effects on individuals are translated to the population or ecosystem scale.
Assessment method
This assessment quantifies anthropogenic pressure from impulsive sound in UK waters, covering data reported in the period 2015-2021. Information about impulsive noise events is submitted to the UK Marine Noise Registry (MNR) on a mandatory basis where submission of data is made a condition of activity licences, and on a voluntary basis when no licence is required, for example, activities conducted by the Ministry of Defence. The MNR collates data for seven different impulsive sound generating activities: 1. seismic (airgun) survey; 2. sub-bottom profiling survey; 3. impact pile driving; 4. unclassified Ministry of Defence (MoD) activity (mainly military sonar); 5. explosives; 6. acoustic deterrent devices; 7. multi-beam echosounders. Inputs to MNR should fall between 10Hz and 10kHz (up to 12kHz for Multibeam echosounders). Data submitted always include location (points in decimal degrees or licensing blocks), date and activity type. Other information such as sounds levels and frequency is optional. MNR Data outputs are published on a yearly basis on www.data.gov.uk.
The assessment unit used is referred to as a Pulse Block Day (Van der Graaf and others, 2012; Dekeling and others, 2014). A Pulse Block Day occurs when at least one noise event has occurred within a ‘block’ on a particular day. The assessment uses the blocks of the UK oil and gas licensing grid (Oil and Gas Authority, 2015). A block measures 10 minutes’ latitude by 12 minutes’ longitude. If more than one noise event occurs on the same day within the same block it still counts as 1 PBD, therefore the maximum number of PBDs a single block can have within a year is 365 (366 in leap years).
Results
Across the whole of UK seas, total Pulse Block Days (PBDs) decreased in the first three years of the time series, from the highest ever level in 2015 (6211) to the lowest in 2017 (2260). In 2015 and 2016 there were government-led unusually large-scale seismic surveys which have inflated baseline levels of noise. These types of surveys are rare and have not occurred since. Since the low levels of 2017, however, noise has increased with a maximum of 4974 PBDs being recorded for 2021 (Figure 5). Variation has been mainly driven by noise in the Greater North Sea (GNS), since for the Celtic Seas (CS) total PBDs have remained similar (average of 1408 PBDs). PBDs in the GNS account for 68% of total PBDs, even though the CS has more than the double of blocks than the GNS, denoting the high levels of industrial activity in the GNS.

Figure 5. Total Pulse Block Days reported in UK Seas during 2015-2021.
The highest number of days with noise in a year for any single block was recorded in 2021 for both sea regions, 174 and 194 days for GNS and CS, respectively (Table 1), both due to pile-driving. The overall percentage of blocks with noise ranged from 7.2% in 2017 to 39.7% in 2021 for the GNS and 3.7% in 2017 to 10.2% in 2016 for the CS. Whereas in 2015 and 2016 the widespread pressure of noise was caused by the government-led large-scale surveys, in 2021, the large number of blocks with noise reflect several small-scale surveys. Of those blocks where noise events occurred, a minimum of 16.4% (2021) and a maximum of 45.0% (2019) had more than 10 days of noise in the GNS, with a minimum of 5.9% (2015) and a maximum of 31.7% (2018) for CS.
Table 1. Summary data for the maximum number of days with noise in any block, the percentage of blocks with noise, and, of those with noise, the percentage with more than 10 days of noise, in GNS and CS, during 2015-2021. Maximums for the period shown in bold.
|
Greater North Sea |
|||
|
Year |
Maximum number of PBDs (days with noise) in a single block |
% blocks with noise |
% blocks with noise with more than 10 PBDs (days with noise) |
|
2015 |
99 |
39.3 |
21.3 |
|
2016 |
62 |
24.2 |
18.6 |
|
2017 |
89 |
7.2 |
20.0 |
|
2018 |
100 |
17.9 |
37.7 |
|
2019 |
119 |
15.9 |
45.0 |
|
2020 |
131 |
14.4 |
42.9 |
|
2021 |
174 |
39.7 |
16.4 |
|
Celtic Seas |
|||
|
2015 |
28 |
18.2 |
5.9 |
|
2016 |
53 |
10.2 |
7.9 |
|
2017 |
101 |
3.7 |
31.6 |
|
2018 |
29 |
5.21 |
31.68 |
|
2019 |
125 |
4.37 |
20.74 |
|
2020 |
63 |
4.4 |
13.97 |
|
2021 |
194 |
7.18 |
12.61 |
Overall, seismic surveys accounted for 64% of all PBDs across the two sea regions, with 22% being accounted for by sub-bottom profiler surveys, 7% by pile-driving, 5% by unclassified military sonar and less than 3% for ADDs, explosives and multibeam surveys combined (Figure 6). Seismic surveys contributed the most noise in all years except 2020 when they were overtaken by sub-bottom profiler surveys (Figure 7).

Figure 6. Overall contribution of sound sources to total Pulse Block Days (2015-2021)

Figure 7. Contribution of sound sources to total Pulse Block Days during 2015-2021
Further information
Figure 8 represents the impulsive noise pressure in UK seas between 2015 to 2021. The maps illustrate the distribution of reported Pulse Block Days (PBD) for each year. A higher PBD count within a block translates directly to a greater number of days on which one or more noise events occurred. In 2015 and 2016, large-scale government-led seismic surveys took place, accounting for the widespread distribution of impulsive noise in those years. With the added exception of 2021, when several seismic surveys took place spread across the GNS, the more typical distribution is one of a series of localised hotspots, denoting known areas of offshore construction, oil and gas exploration, and military exercises.

Figure 8. Distribution of impulsive noise pressure in UK seas from 2015 to 2021 presented as individual maps for each year. Unit is Pulse Block Day (PBD, a PBD occurs when at least one noise event has occurred within a block on a particular day).
In Figure 9, the maps show areas of occurrence of the different sound sources, with certain areas dominated year on year by particular sources, for example in the Southwest Approaches and the West coast of Scotland, where military exercise areas are well established, in the central North Sea and around Shetland, where oil and gas exploration is prevalent, in coastal areas, where harbour construction has taken place, and in the Moray Firth and Firths of Tay and Forth as well as southern North Sea, where large scale wind farms are under construction.
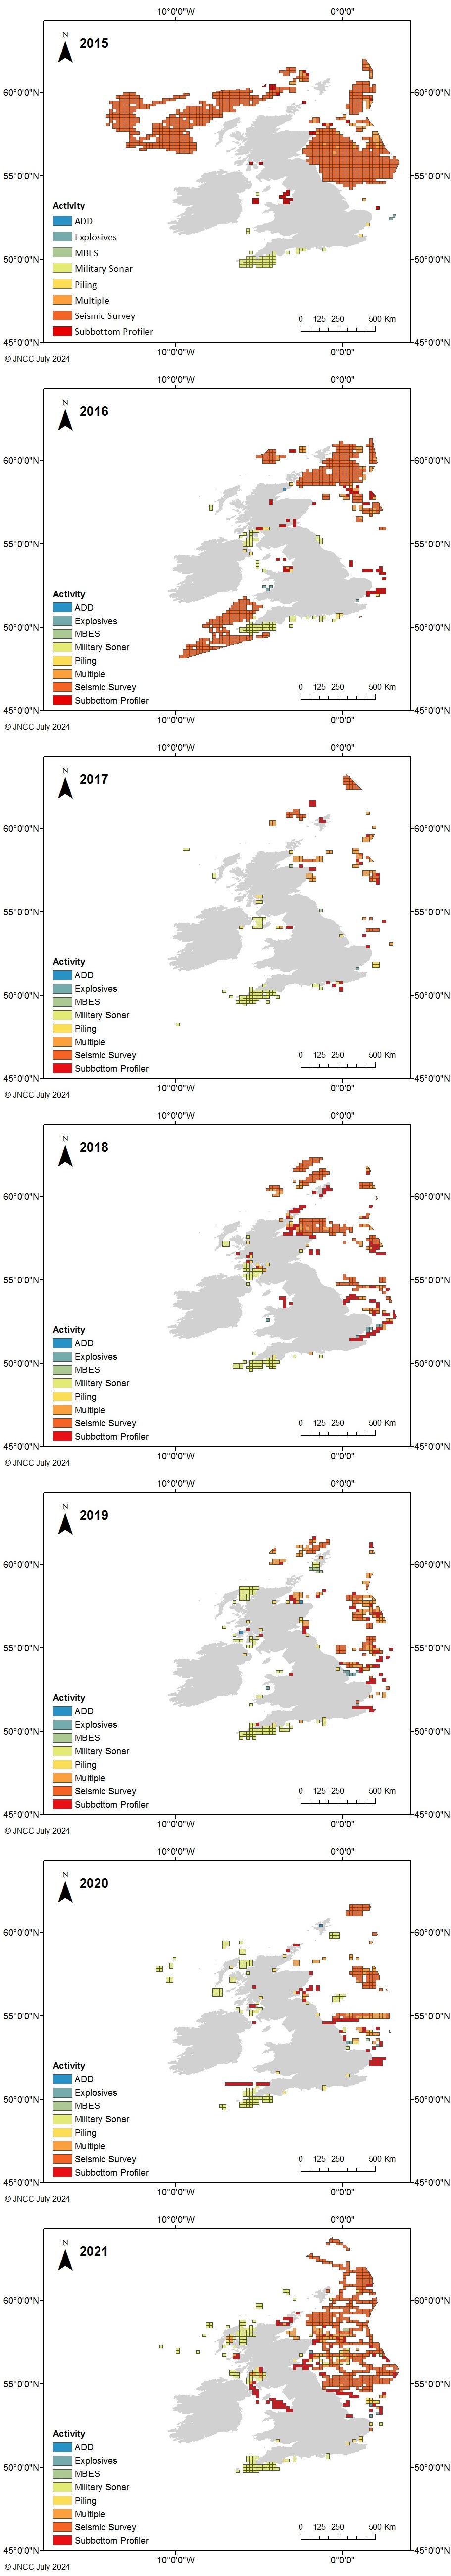
Figure 9. Spatial distribution of impulsive sound sources from 2015 to 2021 presented in individual maps for each year. In legend, ‘Multiple’ is when more than one activity was reported in a block, typically this is seismic surveys and sub-bottom profilers.
Conclusions
This assessment of the UK Impulsive Noise Indicator shows the distribution and prevalence of reported noise events in the Great North Sea (GNS) and Celtic Seas (CS) during the first seven years of reporting (2015-2021). These were dominated by seismic surveys and were most prevalent in the GNS region. Noise in the GNS drove most of the variation seen in the total number of Pulse Block Days (PBDs) over the period. After a fall from the high baseline levels of 2015 (driven by large-scale government-led seismic surveys) to the lowest level in 2017, total PBDs increased again in 2021 to their second highest level. Sub-bottom profilers were the second most prevalent source overall, followed by pile-driving and military sonar. Noise events occurred typically in a few localised hotspots, denoting known areas for offshore construction, oil and gas exploration, and military exercises.
The assessment shows the spatial and temporal patterns of noise events and sound sources highlighting the areas where marine animals, if present, may have been affected. However, the occurrence of effects depends on the distribution and susceptibility of the animals to sound exposure. The likelihood and consequences of the effects of impulsive noise is not assessed here.
Further information
The assessment of the pressure of anthropogenic impulsive sound in UK seas is based on data reported to the UK Marine Noise Registry (MNR) which could be improved. For example, some noise events may be missing, such as:
-
Non-licensed geophysical surveys (non-oil and gas surveys e.g. some pre-installation surveys for offshore renewables).
-
All classified MoD active sonar, active sonar check, and explosions data. The MoD is not obliged to submit data to the MNR but submits unclassified data on a voluntary basis.
-
Active sonar activity by non-UK military in UK seas.
-
Some small-scale impact pile driving events where there is currently no licensing condition to submit data to the MNR, e.g., conducted by the oil and gas industry, and coastal pile driving events categorised as band 1 or 2 by the MMO (voluntarily submitted).
-
Acoustic Deterrent Devices (ADDs) at fish farms, as their use was until recently unlicensed.
-
ADDs used as mitigation, for example in pile driving activities, as these are usually voluntarily input to the MNR as additional information. However, where ADDs are used in mitigation for other impulsive noise generating activities such as explosive detonation and impact pile driving, inclusion of ADDs is unlikely to affect the pulse block days calculated for any given day as these are usually deployed just before the start of the other activities.
-
Activities/projects that were licensed before MNR licence conditions were routinely added; these include nationally significant infrastructure projects consented pre-2016 that include some offshore wind farms. However, by now most of these will have been built.
More accurate reporting of locations of noise events would increase robustness of conclusions. While for some activities locations are reported as points, for the great majority, oil and gas blocks are used, which masks the actual location of for example a seismic survey line or the use of explosives. In addition, different sound sources can have different sound levels, frequencies, directionality and levels of sound complexity, all of which will influence the spatial range of effects on animals such as behavioural disturbance. Having more confidence in source characteristics and the spatial extent of effects may allow for robust assessments of the pressure on species’ habitats.
Knowledge gaps
The assessment of impulsive sound pressure does not directly reflect the extent or magnitude of effects on marine life. While evidence exists, for some species at least, on the effects of impulsive noise on individual marine animals, a key knowledge gap remains on whether and how cumulative noise levels lead to effects at the population and ecosystem scales. Filling this gap will help quantify the risk of impact at these scales and develop proportionate noise management measures. More robust characterisation of sound sources (e.g. levels, frequencies, directionality) will also help with risk assessments and understanding of the pressure’s spatial reach.
Further information
Data on sound properties, such as sound pressure level and frequency, when available, are input to the UK Marine Noise Registry, however there is currently a medium to low level of confidence in these parameters and therefore no attempt is made in the assessment to categorise pressure by these properties. Whilst a higher confidence level would allow for a more accurate representation of the spatial extent of the pressure, since those parameters have a great influence on sound propagation, this does not limit the assessment significantly given that the magnitude and significance of effects on marine animals is not solely dependent on these. Other sound characteristics as well as the behavioural context, individual’s motivation, the previous experience of exposed individuals, and how the animal interprets the sound can have an influence (e.g. DeRuiter and others, 2013; Ellison and others, 2012). Further studies are needed to disentangle the contribution of different factors and allow for a more robust prediction of impact ranges.
The scope of this assessment is to monitor and assess human pressure on the marine environment from impulsive sound sources. Future work can address the risk of impact from impulsive sound sources on marine animals. The OSPAR Common Indicator on the risk of impact from impulsive noise has used noise pressure layers in combination with distribution maps of species sensitive to sound. Such assessments enable the identification of priority areas for improved noise management.
One of the UK Marine Strategy’s aims is that impulsive sounds are managed to the extent that they do not have adverse effects on marine ecosystems and animals at the population level. However, there is a lack of direct evidence on the effects of man-made sound at population and ecosystem scales. The direct observation of population and ecosystem-scale effects will require detailed long-term studies which are able to distinguish the effects of man-made sound from the effects of other human stressors or natural factors. In the meantime, studies which examine the effects of man-made sound on, for example, aspects of ecosystem functioning, such as nutrient cycling (Solan and others, 2016), food web dynamics, such as predator-prey interactions (Simpson and others, 2016) and community structure (for a review see Kok and others, 2023), can investigate the mechanisms by which man-made sound may affect marine ecosystems.
A further knowledge gap is that many of the individual-based studies of the effects of man-made sound have been carried out in laboratory conditions. More field studies on the responses of animals to impulsive sound are needed (for example, DeRuiter and others, 2013; Debuscherre and others, 2015; Sarnocińska and others, 2020), particularly for fish (van der Knaap and others 2022) and marine invertebrates (McCauley and others, 2017; Solé and others, 2023), as well as investigation of the applicability of laboratory studies to wild populations.
For an overview of key evidence gaps, barriers and actions to the management of underwater noise in an European context see Thomsen and others (2021).
References
Dekeling, R.P.A., Tasker, M.L., Van der Graaf, A.J., Ainslie, M.A, Andersson, M.H., André, M., Borsani, J.F., Brensing, K., Castellote, M., Cronin, D., Dalen, J., Folegot, T., Leaper, R., Pajala, J., Redman, P., Robinson, S.P., Sigray, P., Sutton, G., Thomsen, F., Werner, S., Wittekind, D., Young, J.V. (2014). Monitoring Guidance for Underwater Noise in European Seas, JRC Scientific and Policy Report EUR 26555 EN, Publications Office of the European Union, Luxembourg, 2014, doi: 10.2788/27158.
DeRuiter SL, Southall BL, Calambokidis J, Zimmer WMX, Sadykova D, Falcone EA, Friedlaender AS, Joseph JE, Moretti D, Schorr GS, Thomas L, Tyack PL. (2013). First direct measurements of behavioural responses by Cuvier’s beaked whales to mid-frequency active sonar. Biol Lett 9:20130223.http://dx.doi.org/10.1098/rsbl.2013.0223
Duarte, C.M., Chapuis, L., Collin, S.P., Costa, D.P., Devassy, R.P., Eguiluz, V.M., Erbe, C., Gordon, T.A.C., Halpern, B.S., Harding, H.R., Havlik, M.N., Meekan, M., Merchant, N.D., Miksis-Olds, J.L., Parsons, M., Predragovic, M., Radford, A.N., Radford, C.A., Simpson, S.D., Slabbekoorn, H., Staaterman, E., Van Opzeeland, I.C., Winderen, J., Zhang, X., Juanes, F. (2021). The soundscape of the Anthropocene ocean. Science, 371(6529), eaba4658. doi:10.1126/science.aba4658
Ellison, W. T., Southall, B. L., Clark, C. W., and Frankel, A. S. (2012). A new context-based approach to assess marine mammal behavioral responses to anthropogenic sounds. Conserv. Biol. 26, 21–28. doi: 10.1111/j.1523-1739.2011.01803.
Kok ACM, Berkhout BW, Carlson NV, Evans NP, Khan N, Potvin DA, Radford AN, Sebire M, Shafiei Sabet S, Shannon G and Wascher CAF (2023) How chronic anthropogenic noise can affect wildlife communities. Front. Ecol. Evol. 11:1130075. doi: 10.3389/fevo.2023.1130075.
McCauley, R. D., Day, R. D., Swadling, K. M., Fitzgibbon, Q. P., Watson, R. A., and Semmens, J. M. (2017). Widely used marine seismic survey air gun operations negatively impact zooplankton. Nat. Ecol. Evol. 1 (7), 1–8. doi: 10.1038/s41559-017-0195
Sarnocińska, J., Teilmann, J., Balle, J.D., van Beest, F.M., Delefosse, M., Tougaard, J. (2020). Harbor porpoise (Phocoena phocoena) reaction to a 3D seismic airgun survey in the North Sea. Frontiers in Marine Science, 824, 6p.
Sole´ M, Kaifu K, Mooney TA, Nedelec SL, Olivier F, Radford AN, Vazzana M, Wale MA, Semmens JM, Simpson SD, Buscaino G, Hawkins A, Aguilar de Soto N, Akamatsu T, Chauvaud L, Day RD, Fitzgibbon Q, McCauley RD and Andre´ M. (2023). Marine invertebrates and noise. Front. Mar. Sci. 10:1129057. doi: 10.3389/fmars.2023.1129057
Thomsen, F., Mendes, S., Bertucci, F., Breitzke, M., Ciappi, E., Cresci, A. Debusschere, E., Ducatel, C., Folegot, F., Juretzek, C., Lam, F-P., O’Brien, J., dos Santos, M. E. (2021). Addressing underwater noise in Europe: Current state of knowledge and future priorities. Kellett, P., van den Brand, R., Alexander, B., Muniz Piniella, A., Rodriguez Perez, A., van Elslander, J., Heymans, J. J. [Eds.] Future Science Brief 7 of the European Marine Board, Ostend, Belgium. ISSN: 2593-5232. ISBN: 9789464206104. DOI: 10.5281/zenodo.5534224.
Van der Graaf, J., Ainslie, M.A., André, M., Brensing, K., Dalen, J., Dekeling, R.P.A., Robinson, S., Tasker, M.L., Thomsen, F., Werner, S. (2012). European Marine Strategy Framework Directive - Good Environmental Status (MSFD GES): Report of the Technical Subgroup on Underwater noise and other forms of energy. https://www.cbd.int/doc/meetings/mar/mcbem-2014-01/other/mcbem-2014-01-submission-mfsd-02-en.pdf
van der Knaap I, Slabbekoorn H, Moens T, Van den Eynde D, Reubens J (2022) Effects of pile driving sound on local movement of free-ranging Atlantic cod in the Belgian North Sea. Environmental Pollution, Volume 300, 118913. https://doi.org/10.1016/j.envpol.2022.118913
Williams, R, et al. (2015) Impacts of anthropogenic noise on marine life: Publication patterns, new discoveries, and future directions in research and management. Ocean & Coastal Management 115, 17-24. https://doi.org/10.1016/j.ocecoaman.2015.05.021
Authors
Sónia Mendes1
1Joint Nature Conservation Committee
Citation:
Sónia Mendes (2024). Distribution of reported impulsive sound indicator assessment for the UK Marine Strategy. In: UK Marine Online Assessment Tool, available at: https://moat.cefas.co.uk/pressures-from-human-activities/underwater-noise/impulsive-noise/
Assessment metadata
| Assessment Type | UK Marine Strategy Assessment Part 1 (2024) |
|---|---|
Underwater noise | |
| Point of contact email | marinestrategy@defra.gov.uk |
| Metadata date | Friday, May 5, 2023 |
| Title | UK Distribution of loud, low and mid frequency impulsive sounds |
| Resource abstract | |
| Linkage | Additional information about the assessment can be found
|
| Conditions applying to access and use | © Crown copyright, licenced under the Open Government Licence (OGL). |
| Assessment Lineage | |
| Dataset metadata | |
| Dataset DOI | Marine noise data sets for each year (2015-2021) can be found as follows: |
The Metadata are “data about the content, quality, condition, and other characteristics of data” (FGDC Content Standard for Digital Geospatial Metadata Workbook, Ver 2.0, May 1, 2000).
Metadata definitions
Assessment Lineage - description of data sets and method used to obtain the results of the assessment
Dataset – The datasets included in the assessment should be accessible, and reflect the exact copies or versions of the data used in the assessment. This means that if extracts from existing data were modified, filtered, or otherwise altered, then the modified data should be separately accessible, and described by metadata (acknowledging the originators of the raw data).
Dataset metadata – information on the data sources and characteristics of data sets used in the assessment (MEDIN and INSPIRE compliance).
Digital Object Identifier (DOI) – a persistent identifier to provide a link to a dataset (or other resource) on digital networks. Please note that persistent identifiers can be created/minted, even if a dataset is not directly available online.
Indicator assessment metadata – data and information about the content, quality, condition, and other characteristics of an indicator assessment.
MEDIN discovery metadata - a list of standardized information that accompanies a marine dataset and allows other people to find out what the dataset contains, where it was collected and how they can get hold of it.