
Fishing pressure
There is an increase towards GES for the fishing pressure indicator of 9% for quota fish and 6% for national non-quota shellfish since the last assessment.
The percentage of marine quota fish stocks meeting GES criteria for the fishing pressure indicator is 53%. The status of national non-quota shellfish remains unknown for 52% of stocks, and 11% met GES.
Background
The UK Marine Strategy (HM Government, 2010, 2019, 2025) continues with the policy commitment to achieve Good Environmental Status (GES) in UK waters that includes descriptor 3 commercially exploited fish and shellfish stocks being within safe biological limits. We report here the results from one indicator, fishing pressure (D3C1) that refers to the proportion of stocks with a fishing mortality rate being at or below levels to produce the maximum sustainable yield (MSY).
The key driver is the commercial fishing, taking place for decades as part of the international exploitation of marine fisheries resources, is managed by a range of national and international management measures aiming to protect and conserve marine fisheries resources. The UK Fisheries Act 2020 is a key regulatory framework to manage the pressure of commercial fishing activity, requiring stocks to be exploited sustainably to provide the maximum sustainable yield, defined as the highest theoretical equilibrium yield that can be continuously taken on average from a marine stock under existing environmental conditions without significantly affecting the reproduction process.
Further information
The fishing pressure indicator assessment considers commercially exploited quota stocks (fish and Nephrops) and non-quota national shellfish stocks. The quota stocks, are internationally exploited, monitored, and assessed by the International Council for the Exploration of the Sea (ICES) and subject to agreed national total allowable quotas to manage the fishing pressure at or below maximum sustainable yield levels. The non-quota shellfish stocks reported in this assessment are shellfish stocks in UK waters that are not managed by agreed national allowable quotas. Although most of the non-quota shellfish stocks were not routinely monitored or formally assessed before the late 90’s, national stock assessments are undertaken and developed for crab, lobster and scallop to estimate biomass and reference points to establish a harvest rate or fishing pressure that can sustain the maximum sustainable yield (Dobby and others 2017; Delargy and others 2019; Cefas 2020a; 2020b; Lawler and others, 2023; Mesquita et al., 2023).
Assessment method
The fishing pressure indicator was evaluated for 125 stocks (58 marine quota fish stocks and 62 non-quota shellfish stocks). The GES assessment method for commercially exploited fish and shellfish is evaluated at the level of stocks rather than species and is based on stock assessments results and threshold values from the lates ICES’ approach within the assessment cycle or period of 6 years (ICES, 2016) and compared with previous assessment cycles. In the case of non-quota national shellfish (stocks not assessed by ICES), the method is the same but uses data and reference points from national stock assessments.
The fishing pressure indicator (described as criterion D3C1) defines GES criteria as fishing mortality rate of stocks being at levels which in long term leads to maximum sustainable yield, by applying the threshold value for fishing mortality rate being at or below MSY (FMSY) from the latest stock assessment to the annual fishing mortality recorded across the years of the assessment period (ICES, 2016, EU commission 2022). Stocks meeting such criteria are categorised as achieving GES, otherwise are classified as not achieving GES, and in cases where there is a lack of stock assessment providing fishing mortality estimates and targets are classified as unknown. Progress towards GES is assessed by comparing the results, as percentages achieving GES, between the latest and previous assessment cycles for the same list of stocks.
The assessment results for quota fish and non-quota shellfish are analysed and presented separately given the difference on the management regimes between the internationally agreed quotas for fish and the lack of agreed quotas for national shellfish, as well as differences on stock assessment procedures between the annual international stock assessments from ICES for quota fish and the national stock assessments for shellfish that are mostly data-limited and run less frequently.
Although methods for stock assessments might vary between stocks and depend on the quantity and quality of the available data, the relevant stock assessments data are considered equally following the method for GES in the fishing pressure indicator assessment. The data used in this indicator assessment originates from ICES stock assessments for quota fish and from national stock assessments for non-quota shellfish (Dobby and others 2017; Delargy and others 2019; Cefas 2020a; 2020b; Lawler and others, 2023; Mesquita et al., 2023) and described in Campón-Linares and others (2025).
Results
The fishing pressure indicator shows Good status for 53% of marine quota fish, as the fishing mortality rate met the criteria to be at or below levels which can produce the maximum sustainable yield. There is an increasing trend towards GES for this indicator (Figure 1), with a 9% increase from the last assessment cycle (2010-2015) and 33% increase from the previous one (2004-2009).
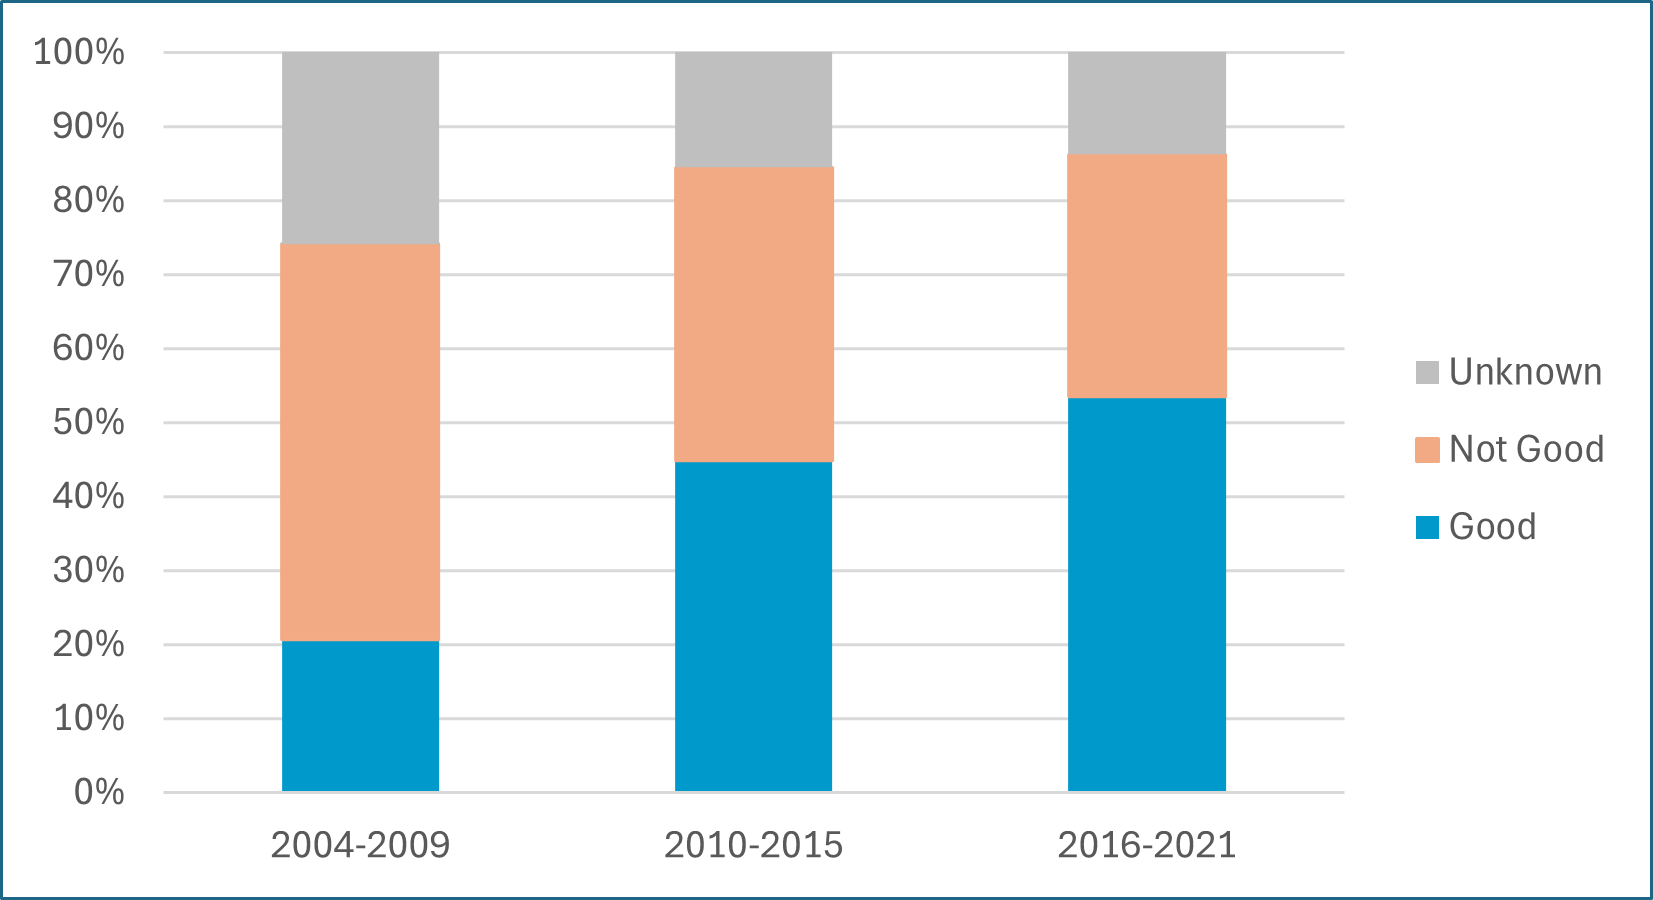
Figure 1. Fishing pressure indicator for quota stocks showing GES changes in three assessment periods from 2004 to 2021.
The percentage of quota stocks with a fishing pressure indicator in not Good status declined from 53% (2002-2009) to 40% (2010-2015) and further decreased to 33% (2016-2021). Over this period, the proportion of fish stocks with unknown status decreased from 26% (2002-2009) to 16% (2010-2015) and to 14% (2016-2021).
The fishing pressure indicator assessment by regional seas (Figure 2) shows that 59% of quota fish stocks in the Celtic Seas achieved GES, followed by stocks widely distributed (50%) and in the North Sea (45%). The percentage of quota stocks with unknown status is higher in the Greater North Sea.
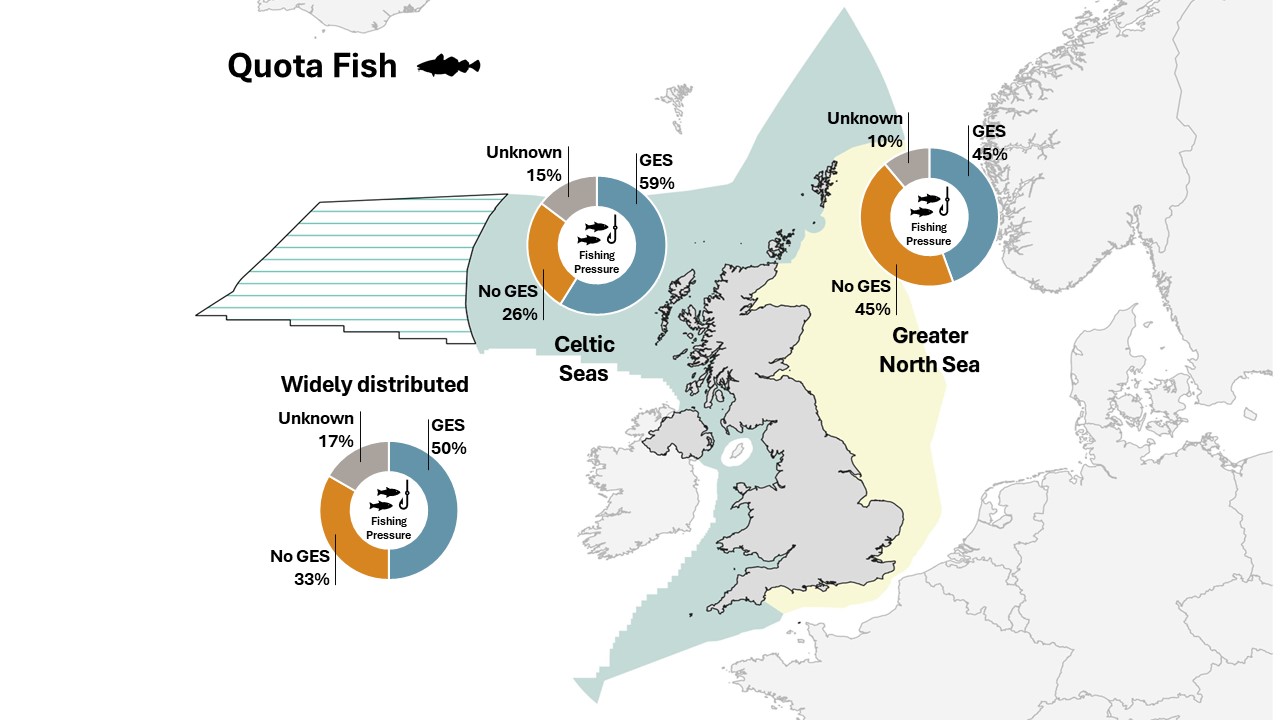
Figure 2. Fishing pressure indicator GES outcome for commercially exploited quota fish stocks in the UK Marine Strategy regions.
The GES outcome for fishing pressure indicator is presented by individual quota stocks in Table 1.
Quota Stocks that achieved GES for the fishing pressure indicator in the Celtic Seas are:
Black-bellied anglerfish in Celtic Seas and Bay of Biscay; Cod in Irish sea; Haddock in Rockall, Haddock in the Irish Sea; Herring in the West of Scotland, Herring in the north west Ireland, Herring in the Irish Sea; Megrim in Rockall; White Anglerfish in Celtic Seas and Bay of Biscay; Nephrops in West Scotland, Nephrops in the Irish Sea East; Plaice in the Irish Sea; Sole in the Irish Sea, Sole n Western English Channel, Sole in Bristol channel (sol.27.7fg), and Whiting in Rockall (whg.27.6a).
In the Greater North Sea, the quota stocks that achieved GES for the fishing pressure indicator are:
Megrim in northern North Sea and West of Scotland; Herring in the Northeast Atlantic; Nephrops in northern North Sea, Nephrops in the Central North Sea; Plaice in the North Sea and Skagerrak; Whiting in North Sea and easter English Channel.
The quota stocks widely distributed across the Norh East Atlantic ecoregions that achieved GES for the fishing pressure indicator are: Spurdog Northeast Atlantic and adjacent waters; hake in the Greater North Sea, Celtic Seas. and the northern Bay of Biscay and mackerel the Northeast Atlantic and adjacent waters.
Table 1. Fishing pressure indicator GES outcome for commercially exploited marine quota fish.
|
Quota fish stock name |
Stock code |
Regional Sea |
Fishing Pressure GES |
|
Anglerfish (Lophius budegassa. Lophius piscatorius) in subareas 4 and 6, and Division 3.a (North Sea, Rockall and West of Scotland, Skagerrak, and Kattegat) |
anf.27.3a46 |
Greater North Sea |
no Good |
|
Black-bellied anglerfish (Lophius budegassa) in Subarea 7 and divisions 8.a-b and 8.d (Celtic Seas, Bay of Biscay) |
ank.27.78abd |
Celtic Seas |
Good |
|
Blue whiting (Micromesistius poutassou) in subareas 1-9, 12, and 14 (Northeast Atlantic and adjacent waters) |
whb.27.1-91214 |
Widely |
no Good |
|
Cod (Gadus morhua) in Subarea 4, Division 7.d, and Subdivision 20 (North Sea, eastern English Channel, Skagerrak) |
cod.27.47d20 |
Greater North Sea |
no Good |
|
Cod (Gadus morhua) in Division 6.a (West of Scotland) |
cod.27.6a |
Celtic Seas |
no Good |
|
Cod (Gadus morhua) in Division 6.b (Rockall) |
cod.27.6b |
Celtic Seas |
unknown |
|
Cod (Gadus morhua) in Division 7.a (Irish Sea) |
cod.27.7a |
Celtic Seas |
Good |
|
Cod (Gadus morhua) in divisions 7.e-k (eastern English Channel and southern Celtic Seas) |
cod.27.7e-k |
Celtic Seas |
no Good |
|
Haddock (Melanogrammus aeglefinus) in Subarea 4, Division 6.a, and Subdivision 20 (North Sea, West of Scotland, Skagerrak) |
had.27.46a20 |
Greater North Sea |
no Good |
|
Haddock (Melanogrammus aeglefinus) in Division 6.b (Rockall) |
had.27.6b |
Celtic Seas |
Good |
|
Haddock (Melanogrammus aeglefinus) in Division 7.a (Irish Sea) |
had.27.7a |
Celtic Seas |
Good |
|
Haddock (Melanogrammus aeglefinus) in divisions 7.b-k (southern Celtic Seas and English Channel) |
had.27.7b-k |
Celtic Seas |
no Good |
|
Herring (Clupea harengus) in subareas 1, 2, 5 and divisions 4.a and 14.a, Norwegian spring-spawning herring (the Northeast Atlantic and Arctic Ocean) |
her.27.1-24a514a |
Greater North Sea |
Good |
|
Herring (Clupea harengus) in Subarea 4 and divisions 3.a and 7.d. autumn spawners (North Sea, Skagerrak and Kattegat, eastern English Channel) |
her.27.3a47d |
Greater North Sea |
Good |
|
Herring (Clupea harengus) in Division 6.a North (North of 56°00'N and East of 07°00'W), autumn spawners (West of Scotland) |
her.27.6aN |
Celtic Seas |
Good |
|
Herring (Clupea harengus) in Division 6.a South (South of 56°00'N and West of 07°00'W) and 7.b-c (northwest and west of Ireland) |
her.27.6aS7bc |
Celtic Seas |
Good |
|
Herring (Clupea harengus) in divisions 7.a South of 52°30'N. 7.g-h. and 7.j-k (Irish Sea, Celtic Sea, and southwest of Ireland) |
her.27.irls |
Celtic Seas |
no Good |
|
Herring (Clupea harengus) in Division 7.a North of 52°30’N (Irish Sea) |
her.27.nirs |
Celtic Seas |
Good |
|
Hake (Merluccius merluccius) in subareas 4, 6, and 7, and divisions 3.a, 8.a-b, and 8.d, Northern stock (Greater North Sea. Celtic Seas. and the northern Bay of Biscay) |
hke.27.3a46-8abd |
Widely |
Good |
|
Horse mackerel (Trachurus trachurus) in Subarea 8 and divisions 2.a, 4.a, 5.b, 6.a, 7.a-c, e-k (the Northeast Atlantic) |
hom.27.2a4a5b6a7a-ce-k8 |
Widely |
no Good |
|
Ling (Molva molva) in subareas 3, 4. 6-9, 12, and 14 (Northeast Atlantic and Arctic Ocean) |
lin.27.346-91214 |
Widely |
unknown |
|
Mackerel (Scomber scombrus) in subareas 1-8 and 14 and Division 9.a (the Northeast Atlantic and adjacent waters) |
mac.27.nea |
Widely |
Good |
|
Megrim (Lepidorhombus spp.) in divisions 4.a and 6.a (northern North Sea, West of Scotland) |
lez.27.4a6a |
Greater North Sea |
Good |
|
Megrim (Lepidorhombus spp.) in Division 6.b (Rockall) |
lez.27.6b |
Celtic Seas |
Good |
|
Megrim (Lepidorhombus whiffiagonis) in divisions 7.b-k, 8.a-b, and 8.d (west and southwest of Ireland, Bay of Biscay) |
meg.27.7b-k8abd |
Celtic Seas |
no Good |
|
Norway lobster (Nephrops norvegicus) in Division 6.a, Functional Unit 11 (West of Scotland, North Minch) |
nep.fu.11 |
Celtic Seas |
Good |
|
Norway lobster (Nephrops norvegicus) in Division 6.a, Functional Unit 12 (West of Scotland, South Minch) |
nep.fu.12 |
Celtic Seas |
Good |
|
Norway lobster (Nephrops norvegicus) in Division 6.a, Functional Unit 13 (West of Scotland, the Firth of Clyde, and Sound of Jura) |
nep.fu.13 |
Celtic Seas |
Good |
|
Norway lobster (Nephrops norvegicus) in Division 7.a, Functional Unit 14 (Irish Sea. East) |
nep.fu.14 |
Celtic Seas |
Good |
|
Norway lobster (Nephrops norvegicus) in Division 7.a, Functional Unit 15 (Irish Sea. West) |
nep.fu.15 |
Celtic Seas |
Good |
|
Norway lobster (Nephrops norvegicus) in divisions 7.b-c and 7.j-k, Functional Unit 16 (west and southwest of Ireland, Porcupine Bank) |
nep.fu.16 |
Celtic Seas |
no Good |
|
Norway lobster (Nephrops norvegicus) in divisions 4.b and 4.c, Functional Unit 5 (central and southern North Sea, Botney Cut-Silver Pit) |
nep.fu.5 |
Greater North Sea |
unknown |
|
Norway lobster (Nephrops norvegicus) in Division 4.b, Functional Unit 6 (central North Sea, Farn Deeps) |
nep.fu.6 |
Greater North Sea |
no Good |
|
Norway lobster (Nephrops norvegicus) in Division 4.a, Functional Unit 7 (northern North Sea, Fladen Ground) |
nep.fu.7 |
Greater North Sea |
Good |
|
Norway lobster (Nephrops norvegicus) in Division 4.b, Functional Unit 8 (central North Sea, Firth of Forth) |
nep.fu.8 |
Greater North Sea |
Good |
|
Norway lobster (Nephrops norvegicus) in Division 4.a, Functional Unit 9 (central North Sea, Moray Firth) |
nep.fu.9 |
Greater North Sea |
Good |
|
Plaice (Pleuronectes platessa) in Subarea 4 (North Sea) and Subdivision 20 (Skagerrak) |
ple.27.420 |
Greater North Sea |
Good |
|
Plaice (Pleuronectes platessa) in Division 7.a (Irish Sea) |
ple.27.7a |
Celtic Seas |
Good |
|
Plaice (Pleuronectes platessa) in Division 7.d (eastern English Channel) |
ple.27.7d |
Greater North Sea |
no Good |
|
Plaice (Pleuronectes platessa) in Division 7.e (western English Channel) |
ple.27.7e |
Celtic Seas |
unknown |
|
Plaice (Pleuronectes platessa) in divisions 7.f and 7.g (Bristol Channel, Celtic Sea) |
ple.27.7fg |
Celtic Seas |
no Good |
|
Pollack (Pollachius pollachius) in subareas 6-7 (Celtic Seas and the English Channel) |
pol.27.67 |
Celtic Seas |
unknown |
|
Roundnose grenadier (Coryphaenoides rupestris) in subareas 6-7 and divisions 5.b and 12.b (Celtic Seas and the English Channel, Faroes grounds, and western Hatton Bank) |
rng.27.5b6712b |
Celtic Seas |
unknown |
|
Saithe (Pollachius virens) in subareas 4, 6 and Division 3.a (North Sea, Rockall and West of Scotland, Skagerrak and Kattegat) |
pok.27.3a46 |
Greater North Sea |
no Good |
|
Sole (Solea solea) in Subarea 4 (North Sea) |
sol.27.4 |
Greater North Sea |
no Good |
|
Sole (Solea solea) in Division 7.a (Irish Sea) |
sol.27.7a |
Celtic Seas |
Good |
|
Sole (Solea solea) in Division 7.d (eastern English Channel) |
sol.27.7d |
Greater North Sea |
no Good |
|
Sole (Solea solea) in Division 7.e (western English Channel) |
sol.27.7e |
Celtic Seas |
Good |
|
Sole (Solea solea) in divisions 7.f and 7.g (Bristol Channel, Celtic Sea) |
sol.27.7fg |
Celtic Seas |
Good |
|
Sprat (Sprattus sprattus) in Division 3.a and Subarea 4 (Skagerrak, Kattegat and North Sea) |
spr.27.3a4 |
Greater North Sea |
unknown |
|
Sprat (Sprattus sprattus) in Subarea 6 and divisions 7.a-c and 7.f-k (West of Scotland, southern Celtic Seas) |
spr.27.67a-cf-k |
Celtic Seas |
unknown |
|
Spurdog (Squalus acanthias) in subareas 1-10, 12 and 14 (the Northeast Atlantic and adjacent waters) |
dgs.27.nea |
Widely distributed |
Good |
|
White anglerfish (Lophius piscatorius) in Subarea 7 and divisions 8.a-b and 8.d (Celtic Seas, Bay of Biscay) |
mon.27.78abd |
Celtic Seas |
Good |
|
Whiting (Merlangius merlangus) in Subarea 4 and Division 7.d (North Sea and eastern English Channel) |
whg.27.47d |
Greater North Sea |
Good |
|
Whiting (Merlangius merlangus) in Division 6.a (West of Scotland) |
whg.27.6a |
Celtic Seas |
Good |
|
Whiting (Merlangius merlangus) in Division 6.b (Rockall) |
whg.27.6b |
Celtic Seas |
unknown |
|
Whiting (Merlangius merlangus) in Division 7.a (Irish Sea) |
whg.27.7a |
Celtic Seas |
no Good |
|
Whiting (Merlangius merlangus) in divisions 7.b-c and 7.e-k (southern Celtic Seas and eastern English Channel) |
whg.27.7b-ce-k |
Celtic Seas |
no Good |
The fishing pressure indicator for national non quota shellfish stocks in 2019 shows that 52% of shellfish stocks are unknown, and for the remaining that were assessed, 11% achieved Good Environmental Status, and 37% did not achieve GES because were exploited above maximum sustainable yield. There is slow increase towards GES for national non-quota shellfish stocks, with 6 % increase since last assessment period (2012) and 10% increase from 1990. (Figure 3).
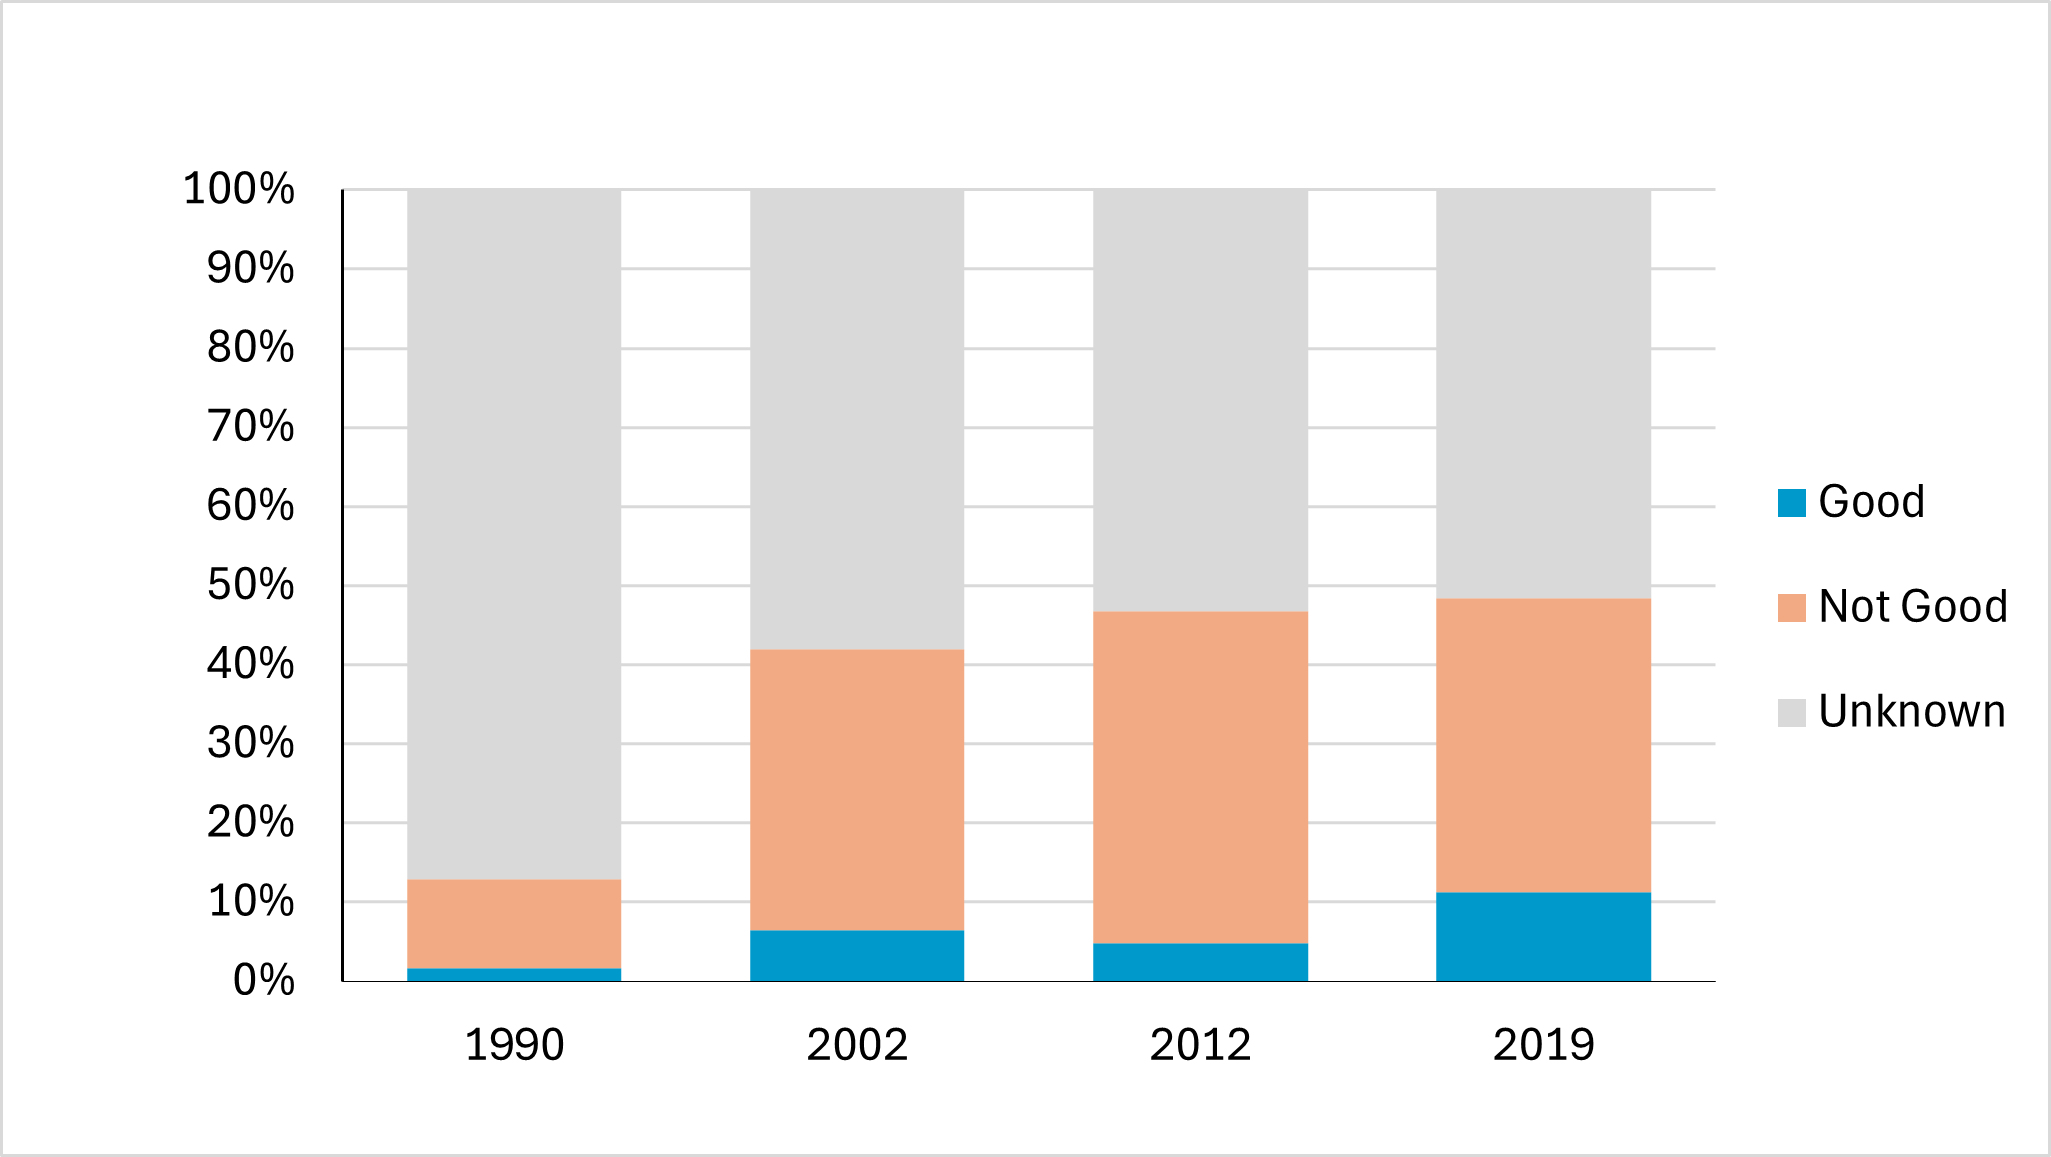
Figure 3. Fishing pressure indicator for non-quota shellfish stocks showing percentages of stocks with GES status changes from 1990 to 2019.
The target to decrease the proportion of non-quota shellfish stocks with unknown status was achieved by a reduction from 87% in 1990 to 52% in 2019. This helps to identify which stocks are being harvested above MSY to inform management advice.
The non-quota shellfish stocks assessment by regional seas (Figure 4) shows that 17% achieved GES in the Greater North Sea and 6% in the Celtic Seas. The percentage of non-quota shellfish stocks with unknown status was higher in the Celtic Seas (56%) that in the Greater North Sea (46%).
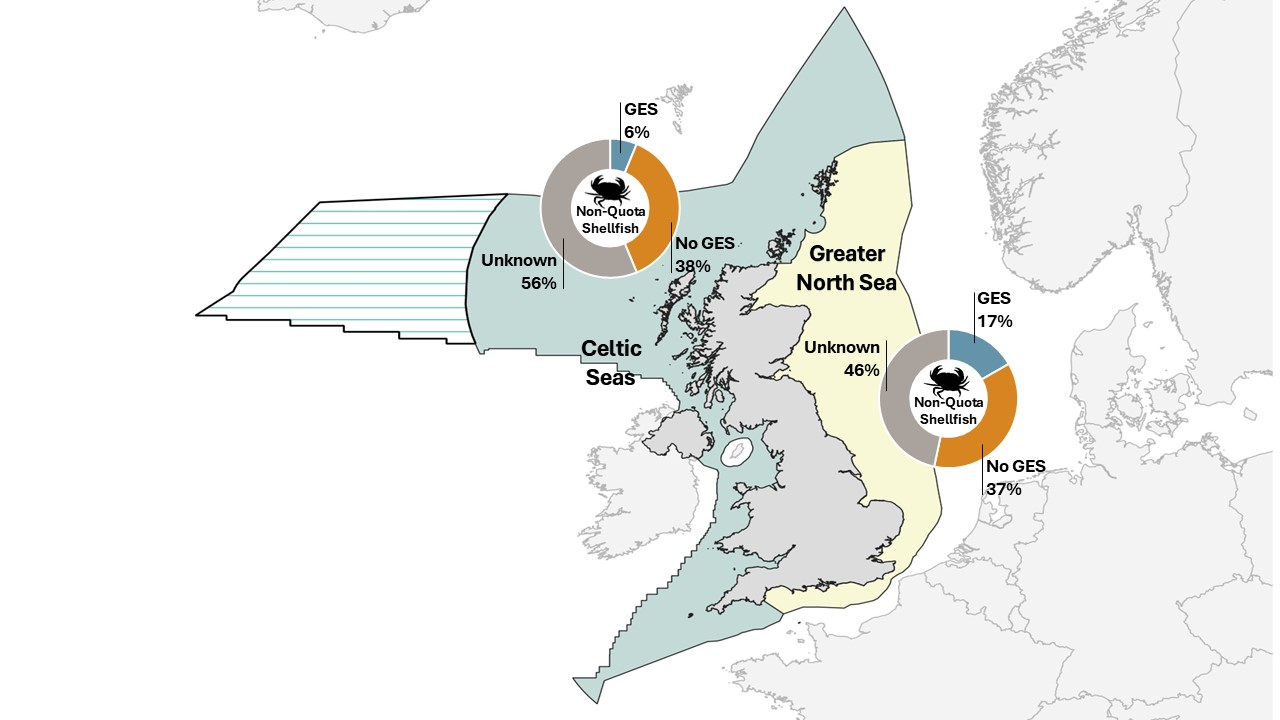
Figure 4. Fishing pressure indicator GES outcome for commercially exploited non-quota shellfish in the UK Marine Strategy regions.
The status for the fishing pressure indicator for each non-quota stock assessed is presented in Table 2.
The national non-quota shellfish stocks that achieved GES for the fishing pressure indicator in the North Sea are:
King Scallops at Yorkshire coast, King Scallops in Eastern Channel North, King Scallops in Western English Channel (Lyme Bay), King Scallops in Western English Channel Offshore; Brown (or edible) crab stock in Papa bank.
In the Celtic Seas, King Scallops also achieved GES in the Western English Channel and North of Cornwall. The rest of King scallop stocks were of unknown status due to data limitations. Queen Scallop in the West of Scotland had also unknown status.
Most of the lobster and velvet crab stocks did not achieved GES because the fishing pressure indicator was above the required threshold (Fmsy).
Table 2. Fishing pressure indicator GES outcome for commercially exploited non- quota shellfish stocks in the UK.
|
Shellfish non-quota stock name |
Stock Code |
Region |
Fishing pressure GES |
|
Brown crab Clyde |
CBE-CL |
Celtic Seas |
no Good |
|
Brown crab Hebrides |
CBE-HE |
Celtic Seas |
no Good |
|
Brown crab Mallaig |
CBE-MA |
Celtic Seas |
unknown |
|
Brown crab North Coast |
CBE-NC |
Celtic Seas |
no Good |
|
Brown crab Orkney |
CBE-OR |
Greater North Sea |
no Good |
|
Brown crab Papa bank |
CBE-PA |
Greater North Sea |
Good |
|
Brown crab Southeast |
CBE-SE |
Greater North Sea |
no Good |
|
Brown crab Shetland |
CBE-SH |
Greater North Sea |
no Good |
|
Brown crab South Minch |
CBE-SM |
Celtic Seas |
no Good |
|
Brown crab Sule |
CBE-SU |
Celtic Seas |
no Good |
|
Brown crab Ullapool |
CBE-UL |
Celtic Seas |
no Good |
|
Edible crab in the Central North Sea |
CBE-CNS |
Greater North Sea |
no Good |
|
Edible crab in the Celtic Sea |
CBE-CS |
Celtic Seas |
no Good |
|
Brown crab East Coast |
CBE-EC |
Greater North Sea |
no Good |
|
Edible crab in the Eastern Channel |
CBE-EEC |
Greater North Sea |
unknown |
|
Edible crab in the Southern North Sea |
CBE-SNS |
Greater North Sea |
no Good |
|
Edible crab in the Western Channel |
CBE-WEC |
Celtic Seas |
no Good |
|
King scallop Yorkshire coast |
SCE-27.4.b.S |
Greater North Sea |
Good |
|
King scallop Eastern Channel North |
SCE-27.7.d.N |
Greater North Sea |
Good |
|
King scallop Western English Channel Inshore |
SCE-27.7.e.I |
Celtic Seas |
Good |
|
King scallop Western English Channel Lyme Bay |
SCE-27.7.e.L |
Greater North Sea |
Good |
|
King scallop Western English Channel Offshore |
SCE-27.7.e.O |
Greater North Sea |
Good |
|
King scallop Cornwall North |
SCE-27.7.f.I |
Celtic Seas |
Good |
|
King scallop Cardigan Bay |
SCE-CB |
Celtic Seas |
unknown |
|
King scallop Clyde |
SCE-CL |
Celtic Seas |
unknown |
|
King scallop East Coast |
SCE-EC |
Greater North Sea |
unknown |
|
King scallop Irish Sea |
SCE-IS |
Celtic Seas |
unknown |
|
King scallop Northeast |
SCE-NE |
Greater North Sea |
unknown |
|
King scallop Northwest |
SCE-NW |
Celtic Seas |
unknown |
|
King scallop Orkney |
SCE-OR |
Greater North Sea |
unknown |
|
King scallop Shetland |
SCE-SH |
Greater North Sea |
unknown |
|
King scallop West of Kintyre |
SCE-WK |
Celtic Seas |
unknown |
|
Queen scallop West of Scotland and Irish Sea (VIa and VIIa) |
QSC-IRIS |
Celtic Seas |
unknown |
|
Lobster Clyde |
LBE-CL |
Celtic Seas |
no Good |
|
Lobster in East Anglia |
LBE-EA |
Greater North Sea |
no Good |
|
Lobster East Coast |
LBE-EC |
Greater North Sea |
no Good |
|
Lobster Hebrides |
LBE-HE |
Celtic Seas |
no Good |
|
Lobster Mallaig |
LBE-MA |
Celtic Seas |
unknown |
|
Lobster North Coast |
LBE-NC |
Celtic Seas |
unknown |
|
Lobster in Northumberland and Durham |
LBE-Nrthblnd |
Greater North Sea |
no Good |
|
Lobster Orkney |
LBE-OR |
Greater North Sea |
no Good |
|
Lobster Papa Bank |
LBE-PA |
Greater North Sea |
no Good |
|
Lobster South East |
LBE-SE |
Greater North Sea |
no Good |
|
Lobster South East South Coast |
LBE-SESC |
Greater North Sea |
unknown |
|
Lobster Shetland |
LBE-SH |
Greater North Sea |
no Good |
|
Lobster South Minch |
LBE-SM |
Celtic Seas |
no Good |
|
Lobster Sule |
LBE-SU |
Celtic Seas |
unknown |
|
Lobster South West |
LBE-SW |
Celtic Seas |
no Good |
|
Lobster Ullapool |
LBE-UL |
Celtic Seas |
unknown |
|
Lobster on the Yorkshire and Humber coast |
LBE-YorkHum |
Greater North Sea |
no Good |
|
Velvet crab Clyde |
LIO-CL |
Celtic Seas |
no Good |
|
Velvet crab East Coast |
LIO-EC |
Greater North Sea |
no Good |
|
Velvet crab Hebrides |
LIO-HE |
Celtic Seas |
no Good |
|
Velvet crab Mallaig |
LIO-MA |
Celtic Seas |
unknown |
|
Velvet crab North Coast |
LIO-NC |
Celtic Seas |
unknown |
|
Velvet crab Orkney |
LIO-OR |
Greater North Sea |
no Good |
|
Velvet crab Papa Bank |
LIO-PA |
Greater North Sea |
unknown |
|
Velvet crab South East |
LIO-SE |
Greater North Sea |
no Good |
|
Velvet crab Shetland |
LIO-SH |
Greater North Sea |
unknown |
|
Velvet crab South Minch |
LIO-SM |
Celtic Seas |
no Good |
|
Velvet crab Sule |
LIO-SU |
Celtic Seas |
unknown |
|
Velvet crab Ullapool |
LIO-UL |
Celtic Seas |
unknown |
Conclusions
This UKMS GES assessment provides an indication of the fishing pressure on internationally commercially exploited fish stocks, and national non-quota shellfish stocks.
The fishing pressure indicator of commercially exploited fish and shellfish stocks shows a higher percentage of quota stocks achieving GES (53%) than for non-quota shellfish stocks (11%). The increase towards GES for the fishing pressure indicator is also higher for quota fish stocks (9%) than for national non-quota shellfish 6% since the last assessment period.
From the 162 stocks assessed, the fishing pressure indicator shows that 16% of marine quota fish stocks are of unknown status whereas for non-quota shellfish stock 52% are unknown, highlighting a significant gap on data and stock assessments.
Marine quota fish are shared stocks and internationally exploited so the UK progress towards GES is influenced by international agreements and cooperation to maintain the fishing pressure to levels at or below maximum sustainable yield.
Depending on the future availability of a wider range of stocks assessments, the number of stocks (quota fish and non-quota shellfish) to include in the next assessment period could be increased.
Knowledge gaps
The environmental status for half of the national non-quota shellfish stocks remains unknown by 2019, due to insufficient data being available to allow MSY-level stock assessments for some stocks of king scallop, velvet crab, and lobster.
Monitoring and research programmes are required to address the lack of robust data and knowledge gaps in the underlying biology for data-limited stocks, and non-quota finfish and shellfish stocks, to feed into future stock assessments and determine sustainable reference points for more stocks, and to inform fisheries management advice.
In addition to the fishing pressure on commercially exploited fish and shellfish, there is a need to consider a wider range of combined pressures to assess GES, including the effect of environmental, climate and ecosystem changes on fish and shellfish populations.
References
Campón-Linares, V , McIntyre, R and Garnacho, E. (2025). Fish and shellfish stock assessments data for the UK Marine Strategy 2004 assessment of descriptor 3. Cefas, UK. V1. doi: https://doi.org/10.14466/CefasDataHub.173
Cefas. (2020a). Lobster (Homarus gammarus). Cefas Stock Status Report 2019. https://www.gov.uk/government/publications/crab-and-lobster-stock-assessments-2019
Cefas. (2020b). Edible crab (Cancer pagurus). Cefas Stock Status Report 2019. https://www.gov.uk/government/publications/crab-and-lobster-stock-assessments-2019
Dobby, H., Millar, S., Blackadder, L., Turriff, J., and McLay, A. (2012). Scottish Scallop Stocks: Results of 2011 Stock Assessments. Scottish Marine and Freshwater Science Volume 3 Number 10. ISSN: 2043-7722. https://www.gov.scot/publications/scottish-marine-freshwater-science-volume-3-number-10-scottish-scallop/
Delargy, A., Hold, N., Lambert, G. I., Murray L. G., Hinz H., Kaiser M. J., McCarthy, I., and Hiddink J. G. (2019). Welsh waters scallop surveys and stock assessment. Bangor University, Fisheries and Conservation Report No. 75. pp 48.
European Commission. (2022). MSFD CIS Guidance Document No. 19, Article 8 MSFD, May 2022. https://circabc.europa.eu/sd/a/20abe862-2684-4a16-9e25-52ffc2e71de6/GD19%20-%20MSFDguidance_2022_Art.8Assessment_REV_12-12-2023.pdf
ICES. (2016). ICES guidance on the practical methodology for delivering an MSFD GES assessment on D3 for an MSFD region/subregion. https://doi.org/10.17895/ices.advice.18686882
Lawler, A., Nawri, N., Harvey, J., Clarke, D., Vanstaen, K., and Benedet, R. (2023). Assessment of king scallop stock status for selected waters around the English coast 2021/2022. Cefas stock assessment report. https://www.gov.uk/government/publications/assessment-of-scallops-stocks-202122
HM Government. (2010). The Marine Strategy Regulations 2010. UK Statutory Instruments 2010 No. 1627. https://www.legislation.gov.uk/uksi/2010/1627
HM Government (2019). The Marine Strategy Part One: UK updated assessment and Good Environmental Status. https://www.gov.uk/government/publications/marine-strategy-part-one-uk-updated-assessment-and-good-environmental-status
HM Government. (2020). Fisheries Act 2020. UK Public General Acts 2020 c. 22. https://www.legislation.gov.uk/ukpga/2020/22
HM Government (2025) Marine strategy part three: 2025 UK programme of measures. https://www.gov.uk/government/publications/marine-strategy-part-three-2025-uk-programme-of-measures
Mesquita, C., Ellis, A., Miethe, T., and Dobby, H. (2023). Crab and Lobster Fisheries in Scotland: Results of Stock Assessments 2016-2019. Scottish Marie and Freshwater Science Vol 14 (5). 123 pp. https://doi.org/10.7489/12451-1.
Authors
Eva Garnacho1, Victoria Campón-Linares1, José De Oliveira1, Ewen Bell1
1 Centre for the Environment, Fisheries and Aquaculture
Citation:
Eva Garnacho, Victoria Campón-Linares, José De Oliveira, Ewen Bell (2024). Fishing Pressure indicator assessment of commercially exploited fish and shellfish for the UK Marine Strategy. In: UK Marine Online Assessment Tool, available at: https://moat.cefas.co.uk/pressures-from-human-activities/commercial-fish-and-shellfish/fishing-pressure/
Assessment metadata
| Assessment Type | UK Marine Strategy |
|---|---|
Commercially exploited fish and shellfish (D3) | |
| Point of contact email | marinestrategy@defra.gov.uk |
| Metadata date | Friday, March 1, 2024 |
| Title | Fishing pressure for commercially exploited fish and shellfish (D3.1) |
| Resource abstract | |
| Linkage | |
| Conditions applying to access and use | Crown copyright, licenced under the Open Government Licence (OGL). |
| Assessment Lineage | |
| Dataset metadata | See details in Campón-Linares, V , McIntyre, R and Garnacho, E. (2025). Fish and shellfish stock assessments data for the UK Marine Strategy 2004 assessment of descriptor 3. Cefas, UK. V1. doi: https://doi.org/10.14466/CefasDataHub.173 . |
| Dataset DOI |
The Metadata are “data about the content, quality, condition, and other characteristics of data” (FGDC Content Standard for Digital Geospatial Metadata Workbook, Ver 2.0, May 1, 2000).
Metadata definitions
Assessment Lineage - description of data sets and method used to obtain the results of the assessment
Dataset – The datasets included in the assessment should be accessible, and reflect the exact copies or versions of the data used in the assessment. This means that if extracts from existing data were modified, filtered, or otherwise altered, then the modified data should be separately accessible, and described by metadata (acknowledging the originators of the raw data).
Dataset metadata – information on the data sources and characteristics of data sets used in the assessment (MEDIN and INSPIRE compliance).
Digital Object Identifier (DOI) – a persistent identifier to provide a link to a dataset (or other resource) on digital networks. Please note that persistent identifiers can be created/minted, even if a dataset is not directly available online.
Indicator assessment metadata – data and information about the content, quality, condition, and other characteristics of an indicator assessment.
MEDIN discovery metadata - a list of standardized information that accompanies a marine dataset and allows other people to find out what the dataset contains, where it was collected and how they can get hold of it.