
B2. Breeding Success of Kittiwake
The kittiwake breeding success indicator measures if breeding success of kittiwakes is impacted by human activities over and above the negative impacts from climate change. The target for this indicator has not been met since two thirds of assessed colonies show declines that are greater than expected from climate change effects.
Background
UK target on kittiwake breeding success
This indicator assesses the progress against the following target, set in the UK Marine Strategy Part One (HM Government, 2012): “At the scale of the UK Marine Strategy sub-regions, marine bird productivity is not significantly affected by human activities: Annual breeding success of black-legged kittiwakes should not be significantly different, statistically, from levels expected under prevailing climatic conditions such as sea surface temperature.”

Black-legged kittiwake (photo from Daisy Burnell)
Key pressures and impacts
The abundance and productivity of seabirds breeding in the UK and elsewhere in the North-East Atlantic have declined over the last two decades. These declines are thought to be caused by a shortage of the small shoaling fish that seabirds feed on (e.g. sandeels), due to both the effects of the climate crisis and commercial fishing.
This indicator separates the effects of climatic conditions and human activities (e.g. fishing) on kittiwake populations to indicate if human activities (other than those that impact the climate) effect productivity on their own. As surface feeders, kittiwakes are particularly susceptible to food shortages making them the ideal candidate species for this breeding success indicator.
Measures taken to address the impacts
Since 2000, sandeel fishery closures were used off North-East England and East Scotland to support the recovery of breeding success of local kittiwake colonies. Between 2004 and 2015, voluntary sandeel fishing bans were in place in Shetland. Following a public consultation by Defra in 2023 a spatial closure of sandeel fisheries in English waters of the North Sea was introduced from the 1st of April 2024 (Nature recovery to be accelerated as the government delivers on measures to protect land and sea - GOV.UK (www.gov.uk)). Following a similar public consultation in Scotland, the Scottish Government enacted the Sandeel (Prohibition of Fishing) (Scotland) Order 2024 in March 2024, which prohibits fishing for sandeels in Scottish waters and applies to all fishing boats. The indicator could monitor the effectiveness of such measures.
Further information
Introduction
Kittiwake, like other marine bird species that feed at the surface of the sea, have experienced frequent widespread breeding failures, and therefore failed the UK and OSPAR assessments of breeding abundance (OSPAR Commission QSR, 2023). This contrasts with water-column feeding species who also feed on fish but can dive below the surface to catch prey at a variety of depths (OSPAR Commission, 2023; Searle and others, 2023). The difference suggests that it is not a sheer abundance of prey that is affecting their productivity and breeding numbers, but the availability of the prey to predators confined to the surface. Indeed, there is only weak evidence linking prey abundance to kittiwake breeding success (ICES, 2015). The poor breeding success of kittiwakes has been related to increases in sea surface temperature (Frederiksen and others, 2004; 2007; Cook and others, 2014a) and stratification within the water column (Carroll and others, 2017), suggesting these environmental factors are important in determining the abundance or availability of sandeels to kittiwakes and other surface-feeders. There is also evidence to suggest an additional negative impact of industrial sandeel fishing on the breeding success of kittiwakes at nearby colonies (Frederiksen and others, 2004; 2008; Cook and others, 2014a; Carroll and others, 2017, Searle and others, 2023). This indicator aims to distinguish between the effects of prevailing climatic conditions from those that may have resulted from human activities, such as fishing.
Justification for the indicator
This indicator was developed by Cook and others (2014b) and refines and improves on a previously proposed draft OSPAR Ecological Quality Objective, an indicator for ecosystem health concerned with local sandeel availability to black-legged kittiwakes. In the North Sea, the lesser sandeel (Ammodytes marinus) is a key prey species for kittiwakes and other fish-eating seabirds, such as shag, guillemot, razorbill, puffin and terns. The Ecological Quality Objective was not adopted because it failed to distinguish between changes in sandeel availability that were an impact of fishing from those that resulted from variation in prevailing climatic conditions. The indicator considers the changes in kittiwake breeding success that are related to changes in sea surface temperature.
The indicator is based on work by Frederiksen and others (2004; 2005; 2007), which found that kittiwake breeding success at seven colonies along the North Sea coast of the UK was significantly negatively correlated with local mean sea surface temperatures during February and March of the year preceding each breeding season. The relationship was thought to be related to larval sandeel survival and their subsequent availability, impacting kittiwakes in the rearing of their chicks. Frederiksen and others (2004) proposed that warmer winters resulted in lower recruitment of sandeels to the current year cohort (referred to as group 0), subsequently leading to reduced availability of sandeels in the following year (referred to as group 1).
Kittiwake breeding success is not affected immediately following a warm winter because neither adults nor chicks feed on Group 0 (young of the year) sandeels until June. However, birds are affected in the following year when they feed on the same cohort of sandeels (now classed as Group 1) at the start of the breeding season, which leads to poorer breeding conditions and lower breeding success. A recent study at the Bempton Cliffs colony in Northeast England found increased sea surface temperature had a negative association with sandeel biomass (i.e. higher temperatures are related to lower sandeel stocks), which in turn was associated with lower kittiwake breeding success (Carroll and others 2017).
In an area of the North Sea where sandeel fishing occurred between 1991 and 1998 but has been banned since 2000, there was a significant negative effect of the presence of fishing (Frederiksen and others, 2004; 2008). An analysis of this kittiwake indicator in UK North Sea waters (Cook and others, 2014a) provides further evidence of links to fishing pressure. They found a significant effect on kittiwake breeding success of a fishing pressure factor denoted by the interaction between the annual North Sea stock size of sandeels and the proportion of the stock that was harvested. Carroll and others (2017) further found an additional negative effect of increased sandeel fishing mortality on kittiwake breeding success, even when sea surface temperature had been taken into account. More recently, Searle and others (2023) found a decrease in breeding success due to the sandeel fishery of 28%, in the 20 years since its closure the breeding success had increased by 17%. These studies suggest that kittiwake breeding success could be used as an indicator of fishing impacts on the availability of prey to kittiwakes and other sandeel reliant seabirds.
This indicator could not be developed for the Celtic Seas because no relationship between sea surface temperature and kittiwake breeding success could be found by this and other studies for the Celtic Seas (Cook and others, 2014b; Lauria and others, 2012). This is likely because sea surface temperature is not the primary driver of food availability on the west coast of the UK as a result of the convoluted tidal currents in coastal areas. Indeed, Johnston and others (2021) suggested more heterogenous foraging habitat correlates with reduced breeding success in Kittiwakes. Kittiwakes in the Celtic Seas are also more reliant on other species of small fish, such as sprat and herring (Chivers and others, 2012; Lauria and others, 2012). The availability of these prey types, coupled with the complex foraging habitat are possibly the main drivers for Kittiwake breeding success in this region. Climate change is still likely influencing the population in the Celtic Seas but to an unknown magnitude and through less clear pathways making the region unsuitable for this indicator at present.
Population context
The last census of kittiwakes breeding in the UK, conducted during 1998 to 2002 recorded a total of 380,000 pairs, or 8% of their global population (Mitchell and others, 2004; Figure 1). This total was 25 % less than the number previously counted in the mid-1980s. Since 2000, numbers have continued to fall. Table 1 shows changes in abundance at the colonies included in this kittiwake breeding success indicator. Declines in Shetland have been as much as 95%, and they were most substantial at the previously largest colonies at Noss and Fair Isle. On Orkney, the declines were even more pronounced with two of the largest colonies, Mull Head and Row Head, being wiped out entirely. Declines on the mainland North Sea coast have been lower than in the Northern Isles, with still substantial drops in population sizes in some colonies, but also increases in others like Coquet Island (see Table 1).
 Figure 1. Abundance and distribution of kittiwake in the UK and Ireland in 1998 to 2002 (Source: Mitchell and others, 2004. Provided under copyright by P. I. Mitchell).
Table 1: Changes in the number of breeding kittiwake pairs at the colonies included in this indicator of kittiwake breeding success. The year during which populations were counted are given as superscripts to the count number. Source: JNCC, 2023, Seabird Monitoring Programme Database.
|
Region |
Colony Name |
Seabird 2000 Census count |
(Year) |
Most recent Count |
(Year) |
Change (%) |
Used to assess period 2014-2019 * |
|
Shetland |
Cross-Voe-Sand to Caves (aka Eshaness) |
11 |
1999 |
32 |
2019 |
191 |
✖ |
|
Shetland |
Fair Isle |
8,204 |
2001 |
448 |
2021 |
-95 |
✔ |
|
Shetland |
Foula |
1,934 |
2000 |
425 |
2021 |
-78 |
✔ |
|
Shetland |
Hermaness NNR |
643 |
1999 |
171 |
2016 |
-73 |
✔ |
|
Shetland |
Noness (aka. Ramna Geo to Skerry of Rest) |
520 |
2001 |
197 |
2015 |
-62 |
✔ |
|
Shetland |
Noss |
2,395 |
2000 |
179 |
2015 |
-93 |
✔ |
|
Shetland |
Sumburgh Head |
877 |
2001 |
769 |
2017 |
-12 |
✔ |
|
Shetland |
Westerwick |
84 |
1999 |
50 |
2016 |
-40 |
✖ |
|
Shetland |
Whale Wick to Sandwick (incl. Ramna Geo) |
162 |
1999 |
29 |
2016 |
-82 |
✔ |
|
Orkney |
Costa Head |
1,256 |
2000 |
52 |
2018 |
-96 |
✖ |
|
Orkney |
Gultak |
249 |
2000 |
14 |
2018 |
-94 |
✖ |
|
Orkney |
Marwick Head |
5,573 |
1999 |
906 |
2018 |
-84 |
✔ |
|
Orkney |
Mull Head |
1,006 |
2000 |
0 |
2018 |
-100 |
✖ |
|
Orkney |
Papa Westray - North Hill RSPB* |
602 |
1999 |
15 |
2019 |
-98 |
✖ |
|
Orkney |
Row Head (aka HY2218) |
1,565 |
1999 |
1 |
2018 |
-100 |
✖ |
|
Mainland |
Buchan Ness to Collieston Coast SPA |
13,922 |
2001 |
11,295 |
2019 |
-19 |
✖ |
|
Mainland |
Coquet Island |
51 |
1999 |
466 |
2021 |
814 |
✔ |
|
Mainland |
Dunbar Coast and Harbour |
1,191 |
2000 |
1,155 |
2007 |
— |
✔ |
|
Mainland |
Farne Islands |
5,125 |
2000 |
4,402 |
2019 |
-14 |
✖ |
|
Mainland |
Flamborough Head and Bempton Cliffs |
42,582 |
2000 |
45,504 |
2017 |
7 |
✔ |
|
Mainland |
Fowlsheugh |
42,582 |
2000 |
45,504 |
2017 |
7 |
✔ |
|
Mainland |
Isle of May |
3,639 |
2001 |
2,516 |
2018 |
-31 |
✔ |
|
Mainland |
Lowestoft |
150 |
2000 |
446 |
2018 |
197 |
✖ |
|
Mainland |
North Sutor of Cromarty |
663 |
1999 |
279 |
2017 |
-58 |
✔ |
|
Mainland |
River Tyne (all colonies) |
646 |
2000-02 |
1,257 |
2015 |
94 |
✖ |
|
Mainland |
Saltburn Cliffs (huntcliff) |
3,950 |
2000 |
1,110 |
2020 |
-72 |
✖ |
|
Mainland |
Sands of Forvie |
420 |
2001 |
387 |
2019 |
-8 |
✖ |
|
Mainland |
St Abb's Head NNR |
11,077 |
2000 |
4,600 |
2021 |
-58 |
✔ |
|
Mainland |
St Aldhelms Head - Durlston Head |
95 |
2000 |
17 |
2019 |
-82 |
✖ |
* Please note: Some colonies have had recent whole colony abundance counts but haven't had continuous breeding success data submitted (e.g. Farne Islands) therefore, are not included in this indicator assessment. Conversely, some colonies haven't had whole colony abundance data submitted in recent years but do have continuous breeding success data submitted (e.g. Dunbar Coast and Harbour), so can therefore be included in the indicator assessment.
Assessment method
Data used in the assessment
This indicator uses a known relationship between estimates of annual breeding success of kittiwakes and the local mean sea surface temperature in the North Sea in February and March of the previous year (see Frederiksen and others, 2004, 2007; Cook and others, 2014a) to predict what annual breeding success should be if it is in line with prevailing climatic conditions, as stated in the UK target (HM Government, 2012). A mathematical model describing this relationship was established for each kittiwake colony included in the assessment. These models were used to predict annual baseline values of breeding success, for example those expected under prevailing climatic conditions. If the observed values for kittiwake breeding success were significantly lower than the baselines, this might indicate other impacts, possibly anthropogenic.
Kittiwake data
This indicator was constructed from a time-series of annual estimates of breeding success sampled from 15 colonies along the UK North Sea coast during 2014 to 2019. Due to disruptions in seabird monitoring efforts during 2020-2022, only data up until 2019 is considered in this assessment. The Tyne colony is an aggregation of data from five colonies nesting on human-made structures in Newcastle and along the River Tyne, including the Tyne Bridge and the Baltic art gallery.
Breeding success was measured by the mean number of chicks fledged per pair or nest at a colony in any given year. Data were collected as part of the Seabird Monitoring Programme of the UK and Ireland and extracted from the Seabird Monitoring Programme database. Not all colonies in the samples were observed every year in the times-series. Missing annual observations were predicted by statistical models.
Data from 13 colonies in the Celtic Seas were also analysed, including one colony in the Isle of Man (Glen Maye to Peel) and four colonies in Ireland (Ram Head, Rockabill, Dunmore east to Red Head, and Portally). However, a significant relationship between sea surface temperature and breeding success was found in only four of these. There was also no overall significant correlation between kittiwake breeding success and sea surface temperature in the Celtic Seas, which is consistent with previous studies (Lauria and others, 2012; Cook and others, 2014a). Celtic Sea colonies were therefore not used in the indicator assessments.
An initial power analysis in 2018 indicated that at least 14 years of data are required to achieve the statistical power (Mitchell and others, 2018). This sample size was hereafter used as a minimum requirement for the analysis.
Sea surface temperature data
Data were obtained from the Hadley Centre Sea Ice and Sea Surface Temperature dataset (Rayner and others, 2003) and processed using the ncdf4 package within R (Pierce, 2023). Annual mean winter temperatures (during February and March) were calculated for the adjacent sea areas. These areas were chosen to coincide with sandeel spawning grounds (Ellis and others, 2012). Each colony was paired with temperature data from the adjacent sea area which showed the strongest relationship between breeding success and sea surface temperature.
Baseline and Regression Model
There is a strong relationship between annual breeding success and the annual mean winter sea surface temperature (measured during February and March) of the preceding year at the North Sea colonies. Frederiksen and others (2004) noted 45% of the between year variation in kittiwake breeding success was explained by the SST of the previous years winter. This relationship was used to construct a baseline, which predicts what annual mean breeding success should be if it is in line with prevailing climatic conditions (Figure 2). The baseline for this indicator is different for each colony and varies between years. If breeding success is significantly lower than the baseline, it is considered not to be in line with ‘prevailing climatic conditions’. The UK target was met if, at a significant proportion of kittiwake colonies (at least 13 out of 15, see calculations below), the threshold was exceeded in five years out of six between 2014 and 2019.

Figure 2. A stylised version of the relationship between kittiwake breeding success and sea surface temperature during February and March of the year preceding each breeding season (SST-1).
A General Linear Model was run on the breeding success data from all colonies in both sub-regions and the annual mean winter sea surface temperature data from the corresponding adjacent sea areas. The following R code was used, in which GNS refers to Greater North Sea:
KI.GNS.mm = glmer (cbind(Chicks_fledged,Plot_size*2) ~ SST
+(1|ColonyName)+(0+SST|ColonyName), weights=Plot_size, family = binomial, data=KI.GNS)
Before modelling, the values of chicks fledged per nest were divided by two (the normal clutch size of kittiwakes) to estimate the number of young fledged per egg. This was necessary because the number of chicks fledged per nest (an integer number, either 0, 1 or 2) did not follow a standard distribution, for example, a Poisson distribution would include a substantial frequency > 2, which is impossible for a bird that lays only two eggs. The estimates of chicks fledged per egg had a binomial distribution i.e. had only one of two possible outcomes, each egg will either produce a fledged chick or not, which could easily be incorporated into the model. As colonies differed greatly in size, weighting was introduced in both models to account for a different number of nests found in each colony.
There was a strong significant negative relationship between breeding success and mean winter sea surface temperature across the 29 North Sea colonies (slope = -0.56, P < 0.0001; Table 2). But there was no significant relationship for the 13 Celtic Seas colonies (Table 2).
Table 2. Parameters of General Linear Models incorporating kittiwake breeding success and mean winter sea surface temperature (SST-1) for 29 North Sea colonies.
|
Region |
Effect |
P |
|
Greater North Sea |
||
|
Intercept |
3.67 (±0.39) |
<0.0001 |
|
SST-1 |
-0.55 (± 0.13) |
<0.0001 |
The annual baseline values for each North Sea colony were predicted using the Greater North Sea model, but with colony-specific slopes and intercepts. As an example, the relationship between breeding success and mean winter sea surface temperature for the Fair Isle colony is shown in Figure 3. The slope or strength of the relationship varies between colonies, with stronger negative relationships occurring further north (Figure 4).
 Figure 3. Example of the relationship between colony-specific kittiwake annual mean breeding success and winter mean sea surface temperature, for Fair Isle colony. The red line denotes the baseline, and the black line is the lower 95% confidence limit of the relationship and is used to calculate the threshold values in this assessment.
 Figure 4. Locations of the North Sea kittiwake colonies for which there were sufficient data available to run models on the relationship between breeding success and local winter SST. The graph to right of the map indicates the strength of the effect (effect size) of mean winter sea surface temperature on breeding success at each colony. Colonies are plotted according to their latitude, aligned to the map. Grey boxes show sea areas in which annual mean winter sea surface temperature was calculated from the Hadley Centre Sea Ice and Sea Surface Temperature HadISST dataset: from top clockwise - Shetland/Orkney, East Scotland & Wee Bankie, Dogger Bank, English Channel, Bristol Channel, Liverpool Bay/Irish sea and West Scotland.
Assessment of UK target on kittiwake breeding success
The schematic in Figure 5 shows how the UK target for kittiwake breeding success is assessed.
 Figure 5. Schematic showing how the UK target for kittiwake breeding success was assessed.
Determining the indicator threshold for each colony
To assess the UK target for kittiwake breeding success, the breeding success at each colony was first assessed against the following supporting target: “Annual breeding success is not significantly lower statistically, from the level expected in the prevailing climatic conditions in five years out of six” (HM Government, 2012).
If breeding success is significantly lower than the baseline, it is considered not to be in line with ‘prevailing climatic conditions’ (see Figure 2). To determine if breeding success was significantly lower, a threshold was set for each year at each colony. This threshold was the minimum detectable decrease in breeding success from what was predicted from the baseline relationship with sea surface temperature (see Figure 2). A colony was only assessed if it had the required minimum number of years of data to be able to detect a minimum decrease in breeding success with a statistical significance of p=0.05 and with a power of 0.8. In the previous assessment it was determined that a minimum of 14 years of data were needed, using the pwr.t.test function in the R package pwr (Champely, 2017), this minimum was also adopted in this current assessment. Furthermore, in order for a colony to be included in this assessment period, data from all six assessment years 2014–2019 needed to be present. A colony was considered to have failed to achieve the supporting target if breeding success was below the threshold in more than one year between 2014 to 2019 (inclusive). This target of five years out of six was designed to allow for failures resulting from stochastic events, such as very high rainfall which can lead to hypothermia and death of chicks.
Determining the number of colonies required to be ‘above threshold’
Out of the total sample of 29 colonies, 15 had data for every year during 2014 to 2019. To achieve the UK target all colonies would be expected to achieve the supporting target or be ‘above threshold,’ during 2014 to 2019 except for a small number that statistically, would be expected to fail by chance. The number of colonies expected to fail by chance was calculated using binomial probability theory, where the outcome is one of two possible results, success or failure, (see example in Greenstreet and others (2012) for a similar application). Given that the threshold for each colony in each year was set at a value that would be attained with a probability of 0.05, the probability of annual breeding success being below the threshold by chance, would also be 0.05 (or 5 %). With p=0.05, the function dbinom in R 3.4.0 (R Core Team, 2023) was used to estimate the cumulative probability that breeding success at a colony would be below the threshold in two, or more, years out of six by chance. This probability was estimated at 0.03 (or 3%).
With p=0.03, the dbinom function in R (R Core Team, 2023) was used to estimate the number of colonies that would be expected to fail to meet the supporting target by chance, with a probability of greater than 0.05. For 15 colonies, two colonies are estimated to fail by chance. Therefore, to achieve the UK target, breeding success of kittiwakes at 13 or more colonies of the 15 assessed would need to be in line with prevailing climatic conditions in five years out of six during 2014 to 2019.
Retrospective assessment of the UK target
There were sufficient data to assess the UK target during each six-year period from 1986 to 1991 up to the most recent period of 2014 to 2019. To be included in the assessment for each period, a colony needed six consecutive annual estimates of breeding success. Therefore, the number of colonies included in the assessment varied across the assessment periods. A minimum of 17 colonies were assessed during 1987 to 1992 and a maximum of 28 colonies in 1998 to 2003 and 1999 to 2004. Statistically, up to three colonies would be expected to fail to meet their colony targets by chance with a sample size of 17 to 28 colonies. Therefore, the number of colonies during each six-year period that would be required to meet their colony targets varied depending on the number of colonies assessed and ranged from 14 to 24. The number of colonies in each regional assessment varied between nine to 13 and six to 12 for colonies in the Northern Isles (Orkney and Shetland) and the UK mainland coast bordering the North Sea, respectively. The number of colonies that would be expected to fail to meet their colony targets by chance was reduced to two when the number of colonies assessed was between seven and 16 and reduced to one when only six colonies were assessed.
Results
Latest findings
For this assessment period (2014 to 2019) the overall UK target for kittiwake breeding success was not met and the number of colonies passing the assessment has dropped from 41% (2010-2015) to 32% (2014-2019) (although this likely driven by the inclusion of additional data in this assessment period). To meet the UK target 13 of the 15 assessed kittiwake colonies needed to breed successfully in at least five years out of six. Only five of the 15 colonies followed this pattern, so overall the UK target has not been met (Figure 6). Neither the UK mainland colonies or the Northern Isles colonies (Orkney and Shetland) met their target thresholds.
For the UK mainland colonies to have passed, five out of the seven colonies assessed would have needed to breed successfully in five out of six years. Four colonies were successful in five or more years out of six (Table 3), but it did not meet the target of satisfactory breeding success under prevailing climatic conditions.
In Orkney and Shetland, kittiwake breeding success was much worse. For these colonies to have passed six out of the eight assessed would need to have bred successfully in five of the six years. However, only one colony (Hermaness) managed this (Table 3). Therefore, the Orkney and Shetland colonies did not meet the target.
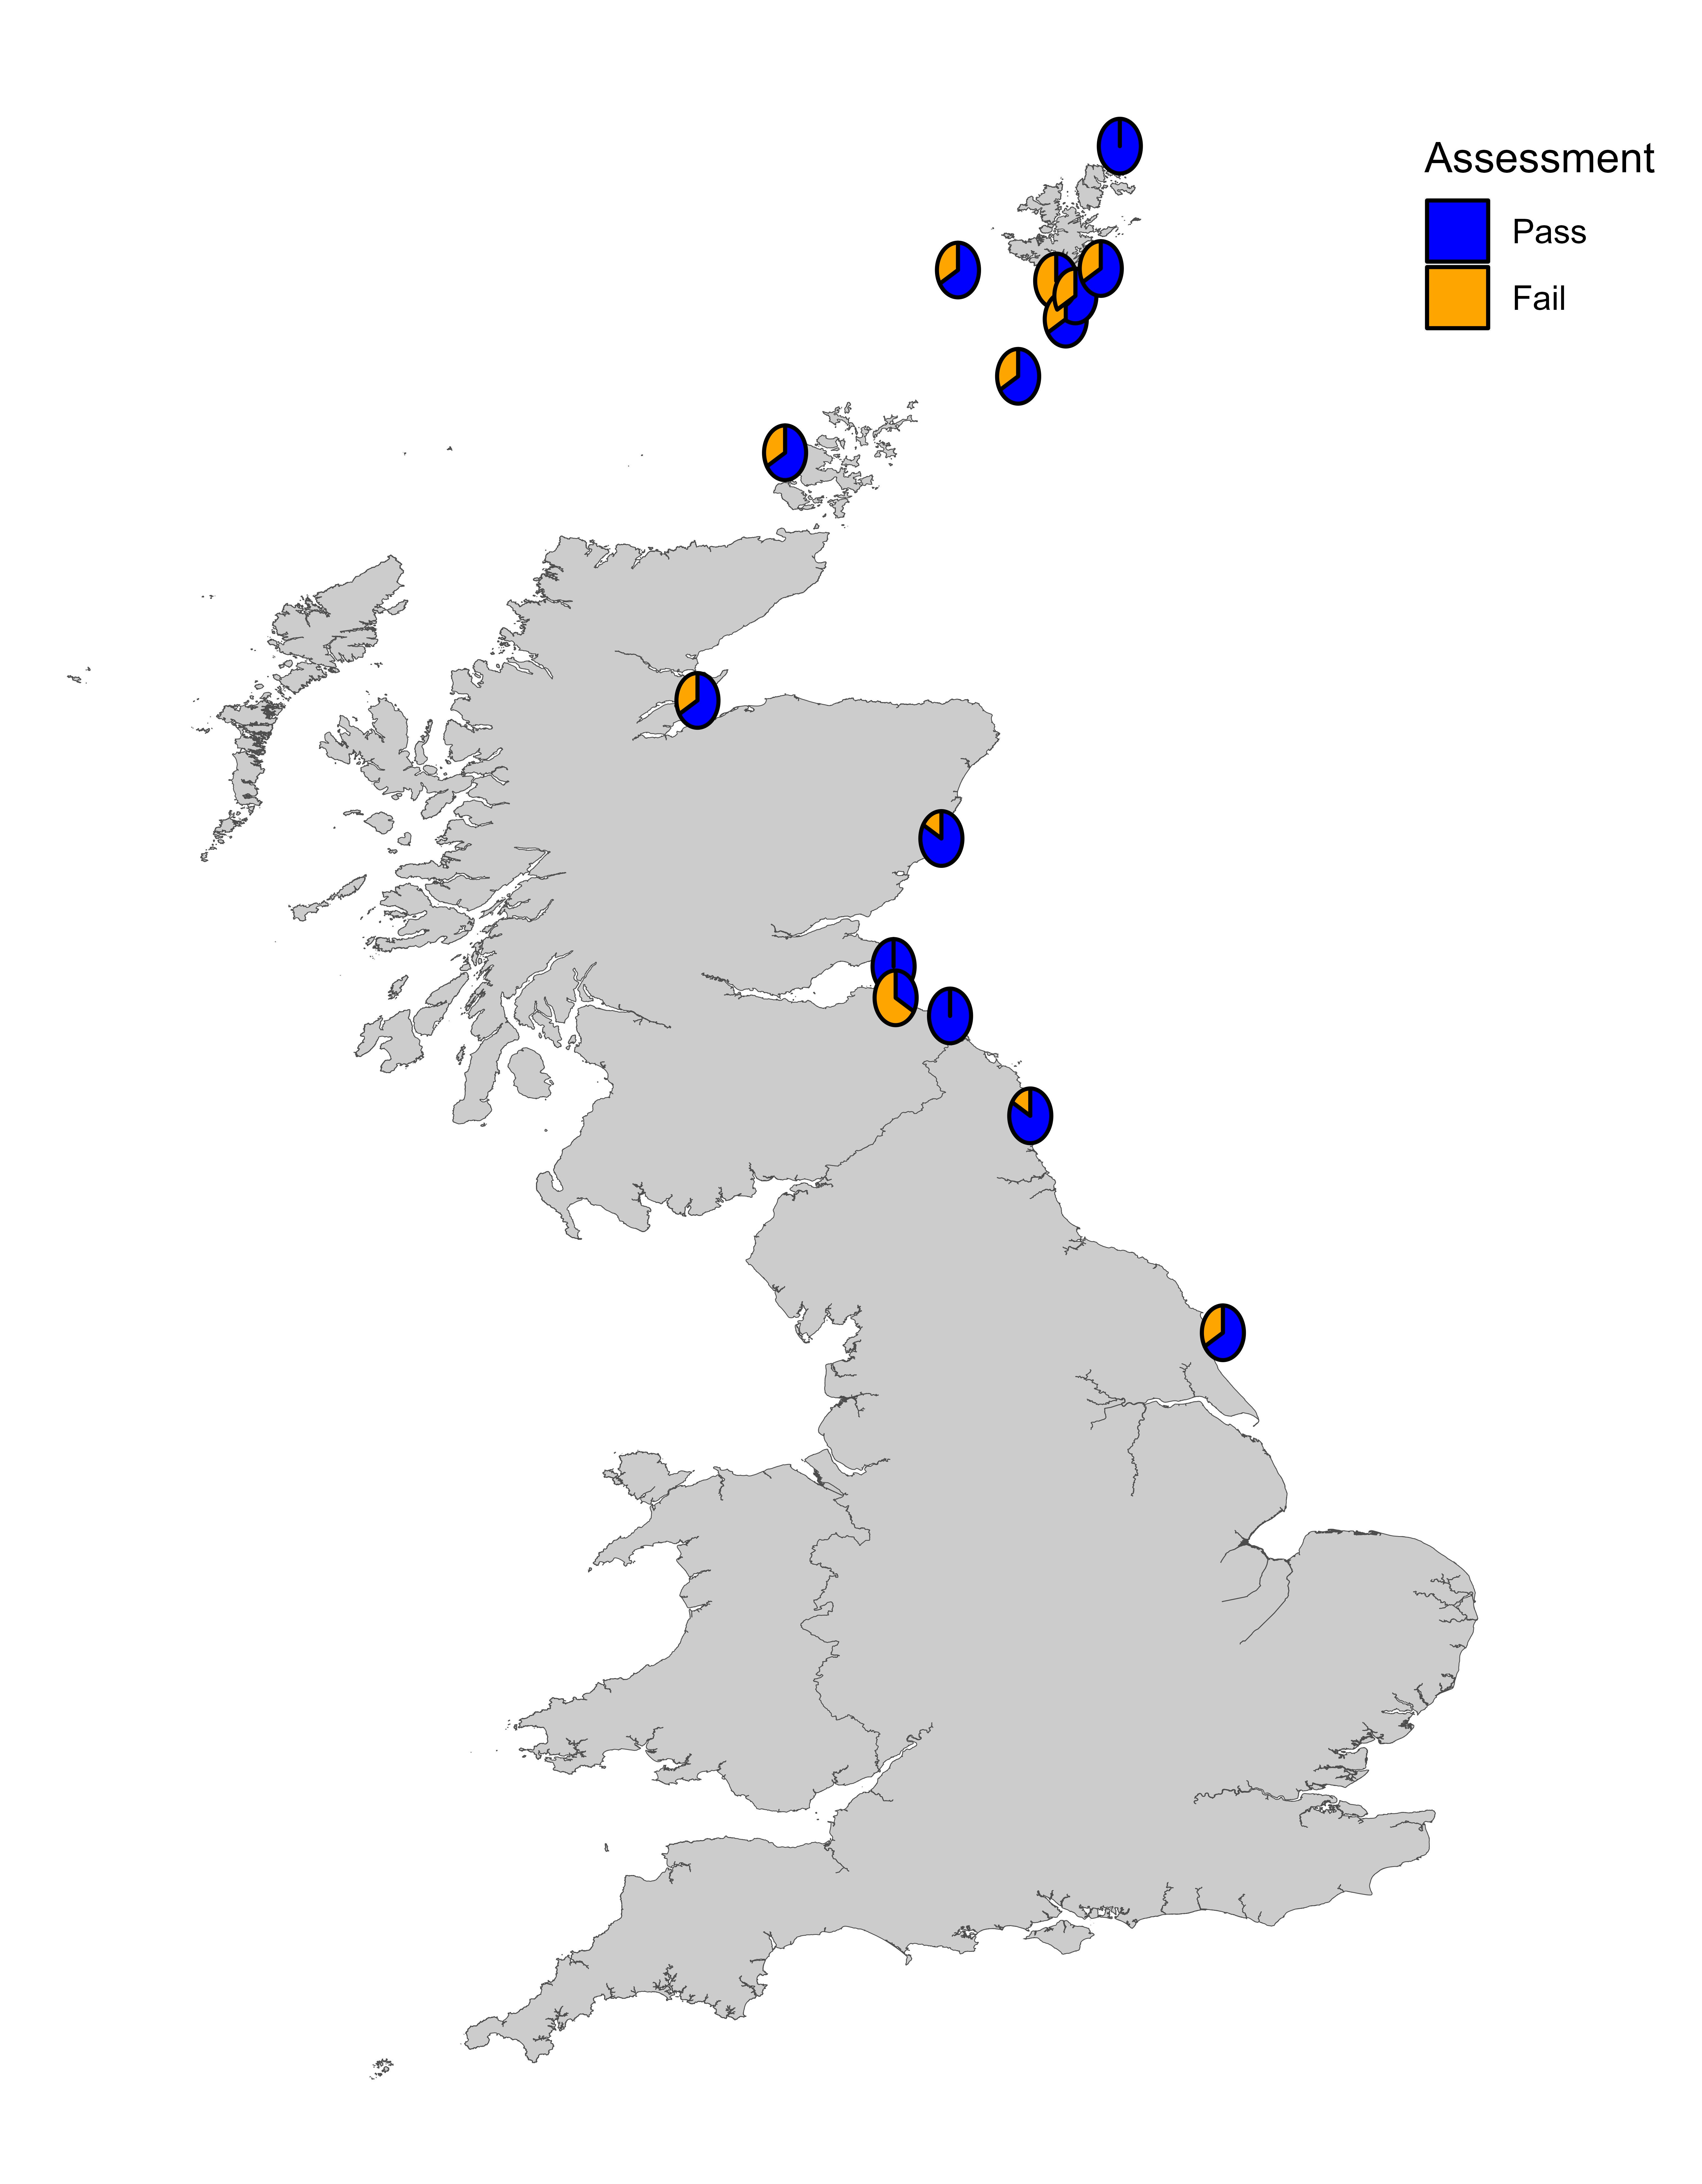 Figure 6: Proportion of years in which the target breeding success was met in each colony during the most recent 6-year assessment period (2014 to 2019), where each pie chart represents one colony. Blue relates to a successful breeding year (pass) and orange relates to an unsuccessful breeding year (fail).
Table 3. Pass rates of colonies included in this kittiwake breeding success indicator assessment period (2014-2019).
|
Region |
Colony |
Number of years passed |
Colony passed indicator? |
|
Shetland |
Fair Isle |
4 |
✖ |
|
Shetland |
Foula |
4 |
✖ |
|
Shetland |
Hermaness |
6 |
✔ |
|
Shetland |
Noness |
4 |
✖ |
|
Shetland |
Noss |
4 |
✖ |
|
Shetland |
Sumburgh Head |
4 |
✖ |
|
Shetland |
Whale Wick to Sandwick (incl. Ramna Geo) |
2 |
✖ |
|
Orkney |
Marwick Head |
4 |
✖ |
|
Mainland |
Coquet Island RSPB |
5 |
✔ |
|
Mainland |
Dunbar Coast |
2 |
✖ |
|
Mainland |
Flamborough Head and Bempton Cliffs |
4 |
✖ |
|
Mainland |
Fowlsheugh RSPB |
5 |
✔ |
|
Mainland |
Isle of May |
6 |
✔ |
|
Mainland |
North Sutor Of Cromarty/Castlecraig |
4 |
✖ |
|
Mainland |
St Abb's Head NNR |
6 |
✔ |
Trend assessment
This indicator was not considered as part of the 2012 Initial Assessment (HM Government, 2012). For the previous assessment of 2018 (assessment period 2010 to 2015), the overall target was not met as only nine out of 22 colonies assessed bred successfully in at least five out of six years.
As per the previous assessment, the above methods were repeated for each six-year period from 1986 onwards (Figure 7). Colonies on the British mainland were ‘improving’ up until 2015 and would have met target if this assessment was run for 2017 (2012-2017) or 2018 (2013-2018) (Figure 7c). Colonies in Orkney and Shetland were ‘declining’ from 1998 onwards, with only the last two years showing any pass rate since 2006 (2001-2006) (Figure 7b). During the late 1980s, failure to meet the UK target was largely confined to Shetland colonies (see Figure 7, assessment period 1991 (1986-1991) to 1994 (1989-1994)). This was mostly due to a crash in the Shetland sandeel stock at that time which was caused by a change in currents and independent of sea surface temperature. Breeding success at colonies in Shetland subsequently recovered temporarily during the early 1990s. During the 1990s, failure to meet the UK target was mainly restricted to colonies in eastern mainland Scotland that were adjacent to an area of high sandeel fishing pressure, which was subsequently closed to fishing from the year 2000 onwards (Figure 7b, assessment period 1995 to 1997). During the mid-2000s, failure to reach the UK target was widespread (Figure 7).
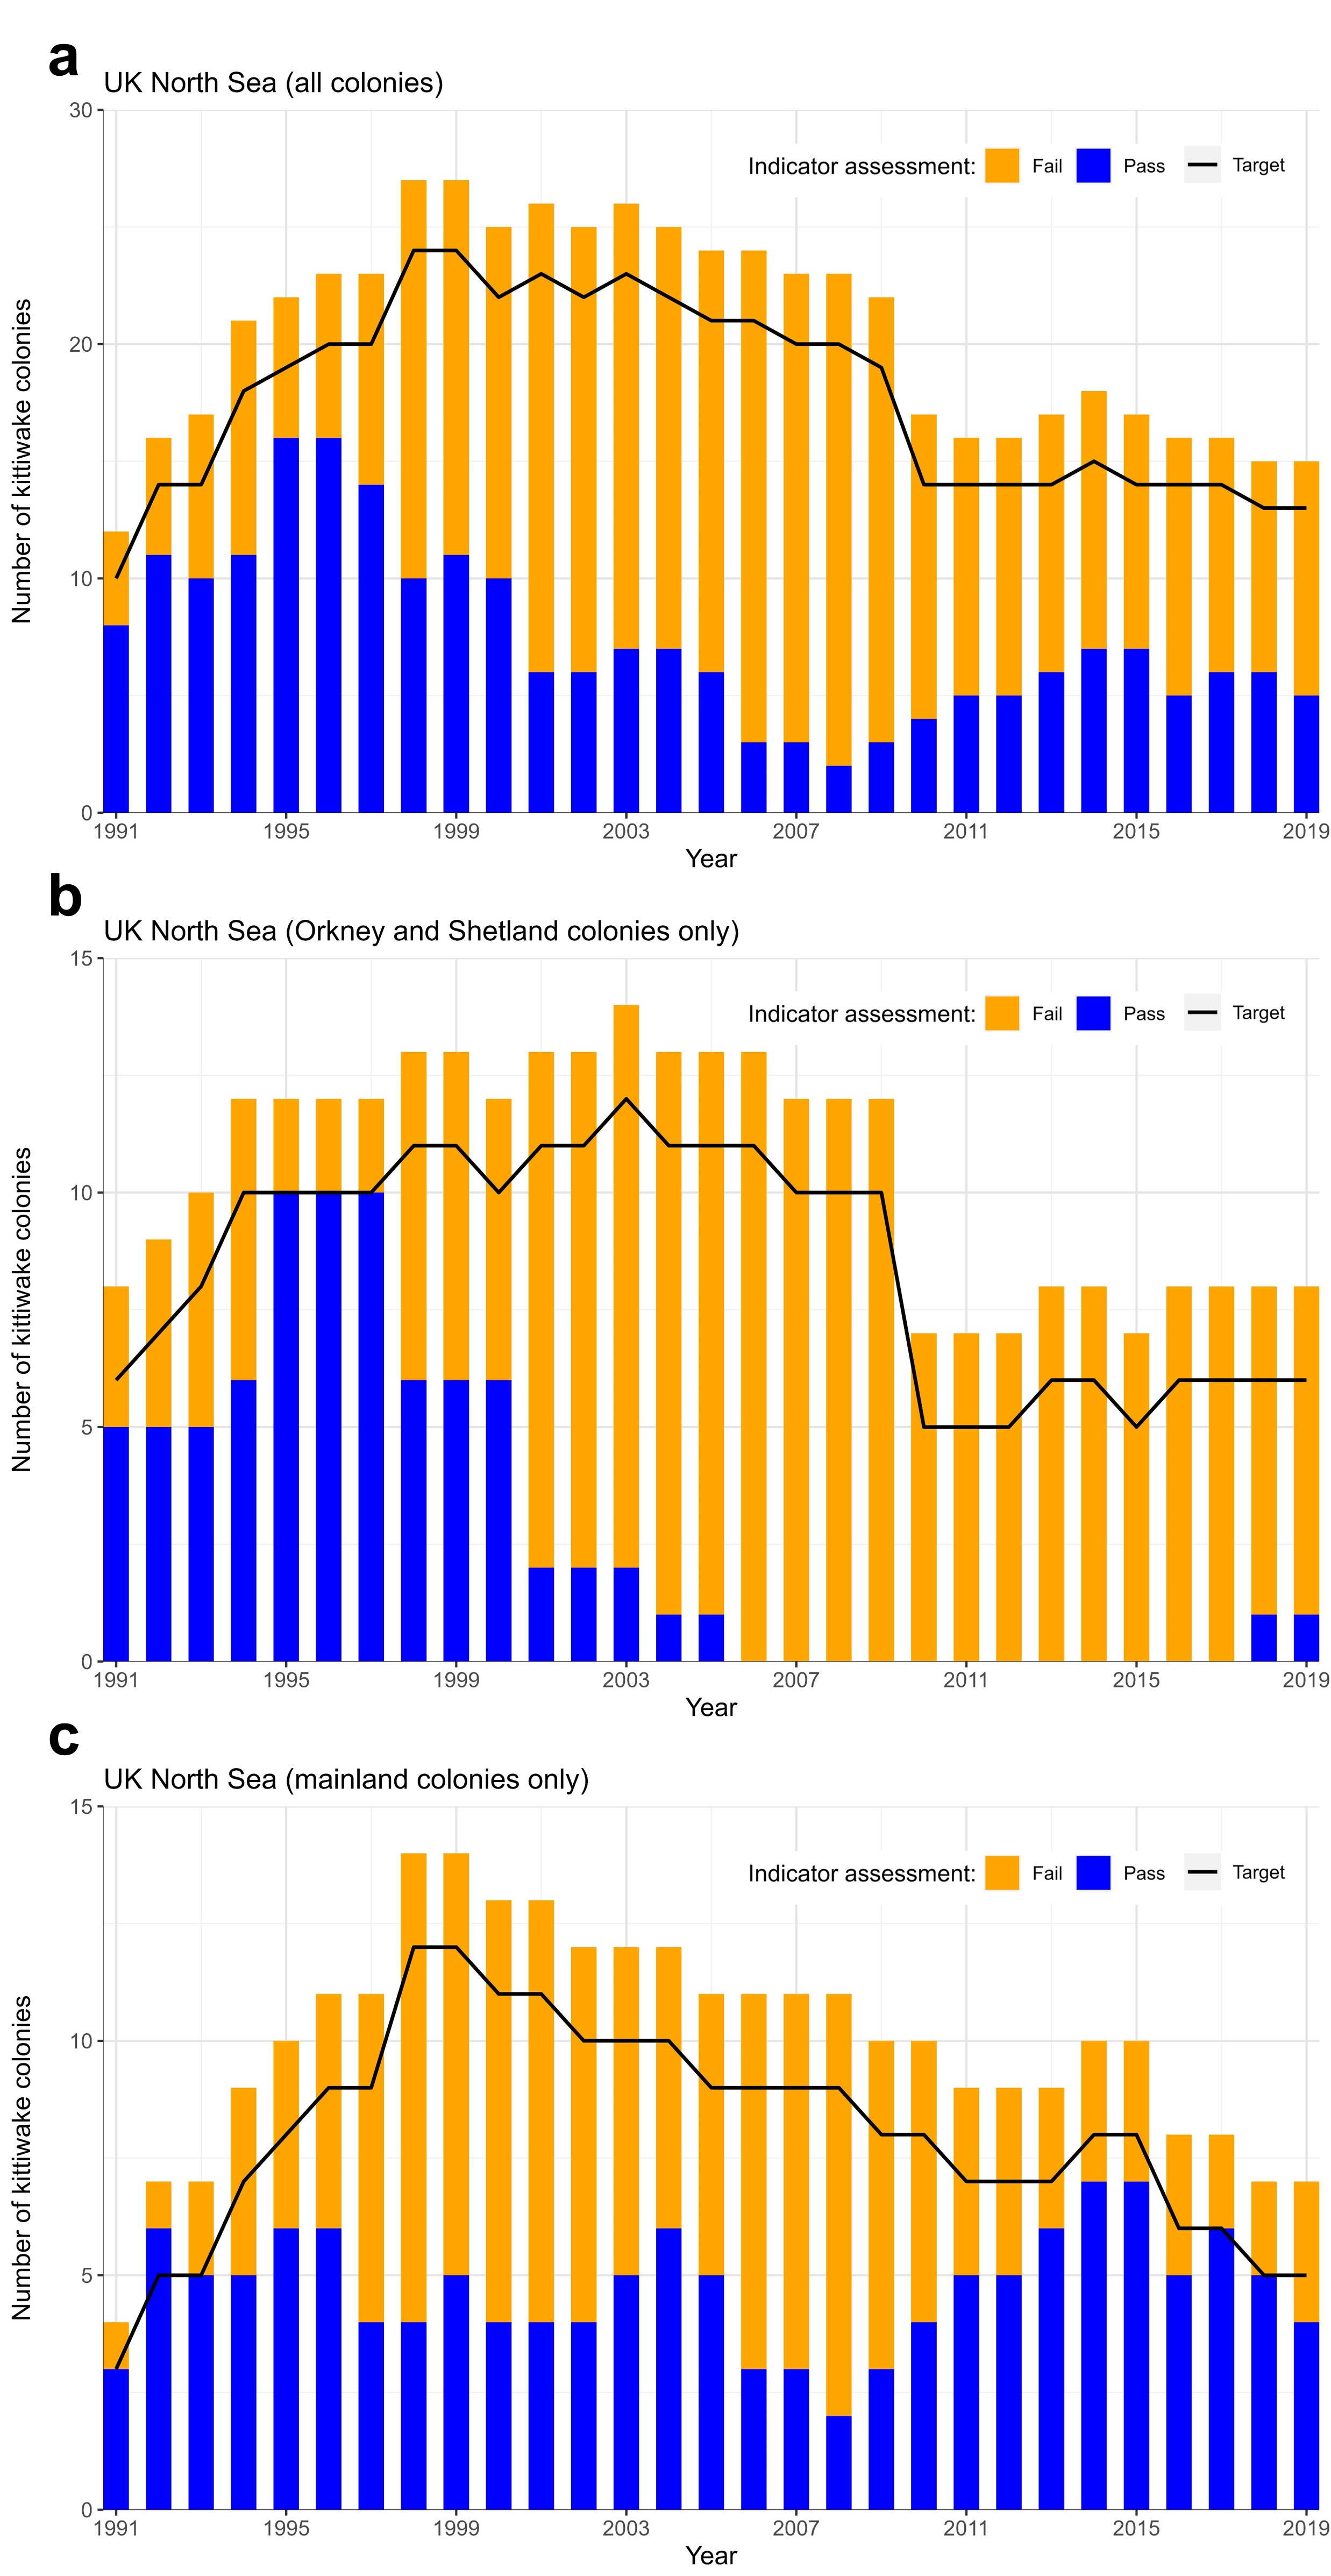 Figure 7. The proportion of assessed colonies where breeding success was in line with conditions (“pass”) and not in line with (“fail”) prevailing climatic conditions in at least 5 of the previous six years. Each annual value represents an assessment for the period of the preceding six years, for example 1991 = 1986 to 1991 inclusive. The black line is the threshold for the number of colonies ‘passing’, at which the UK target is met.
Further information
Last assessment 2018
During the last assessment (2010–2015) it was stated that nine out of the 22 colonies assessed passed, all of which were located on the UK North Sea mainland colonies, but overall, these passes were not enough for the target to be met.
When running the retrospective assessment for this current assessment (2014-2019) the number of colonies passing for period 2010-2015 had dropped to seven out of 22. This change is likely driven by the additional data feeding into the model, assuming the relationship has not been drastically changed (which does not appear to be the case), providing narrower confidence limits the lower of which is used for the threshold of each colony. During the last assessment those passing were possibly just bordering that lower limit and with model refinement, in the form of more years of data, may have dropped to below that threshold.
The indicator results across time.
Figure 8 shows how the indicator has changed through important time periods in the North Sea. These include the sandeel collapse, whilst the Wee Bankie fishery was in use and the current and last assessments post closure. All colonies, with at least one year of data within these assessment periods are shown but, not all colonies will have been included as part of the final assessment. Continuous data within the assessment period is needed to be included in the indicator. The colonies without the necessary amount of data still show a pass or fail in the years where data was present, but also include grey sections showing they were not assessed in the final assessment.
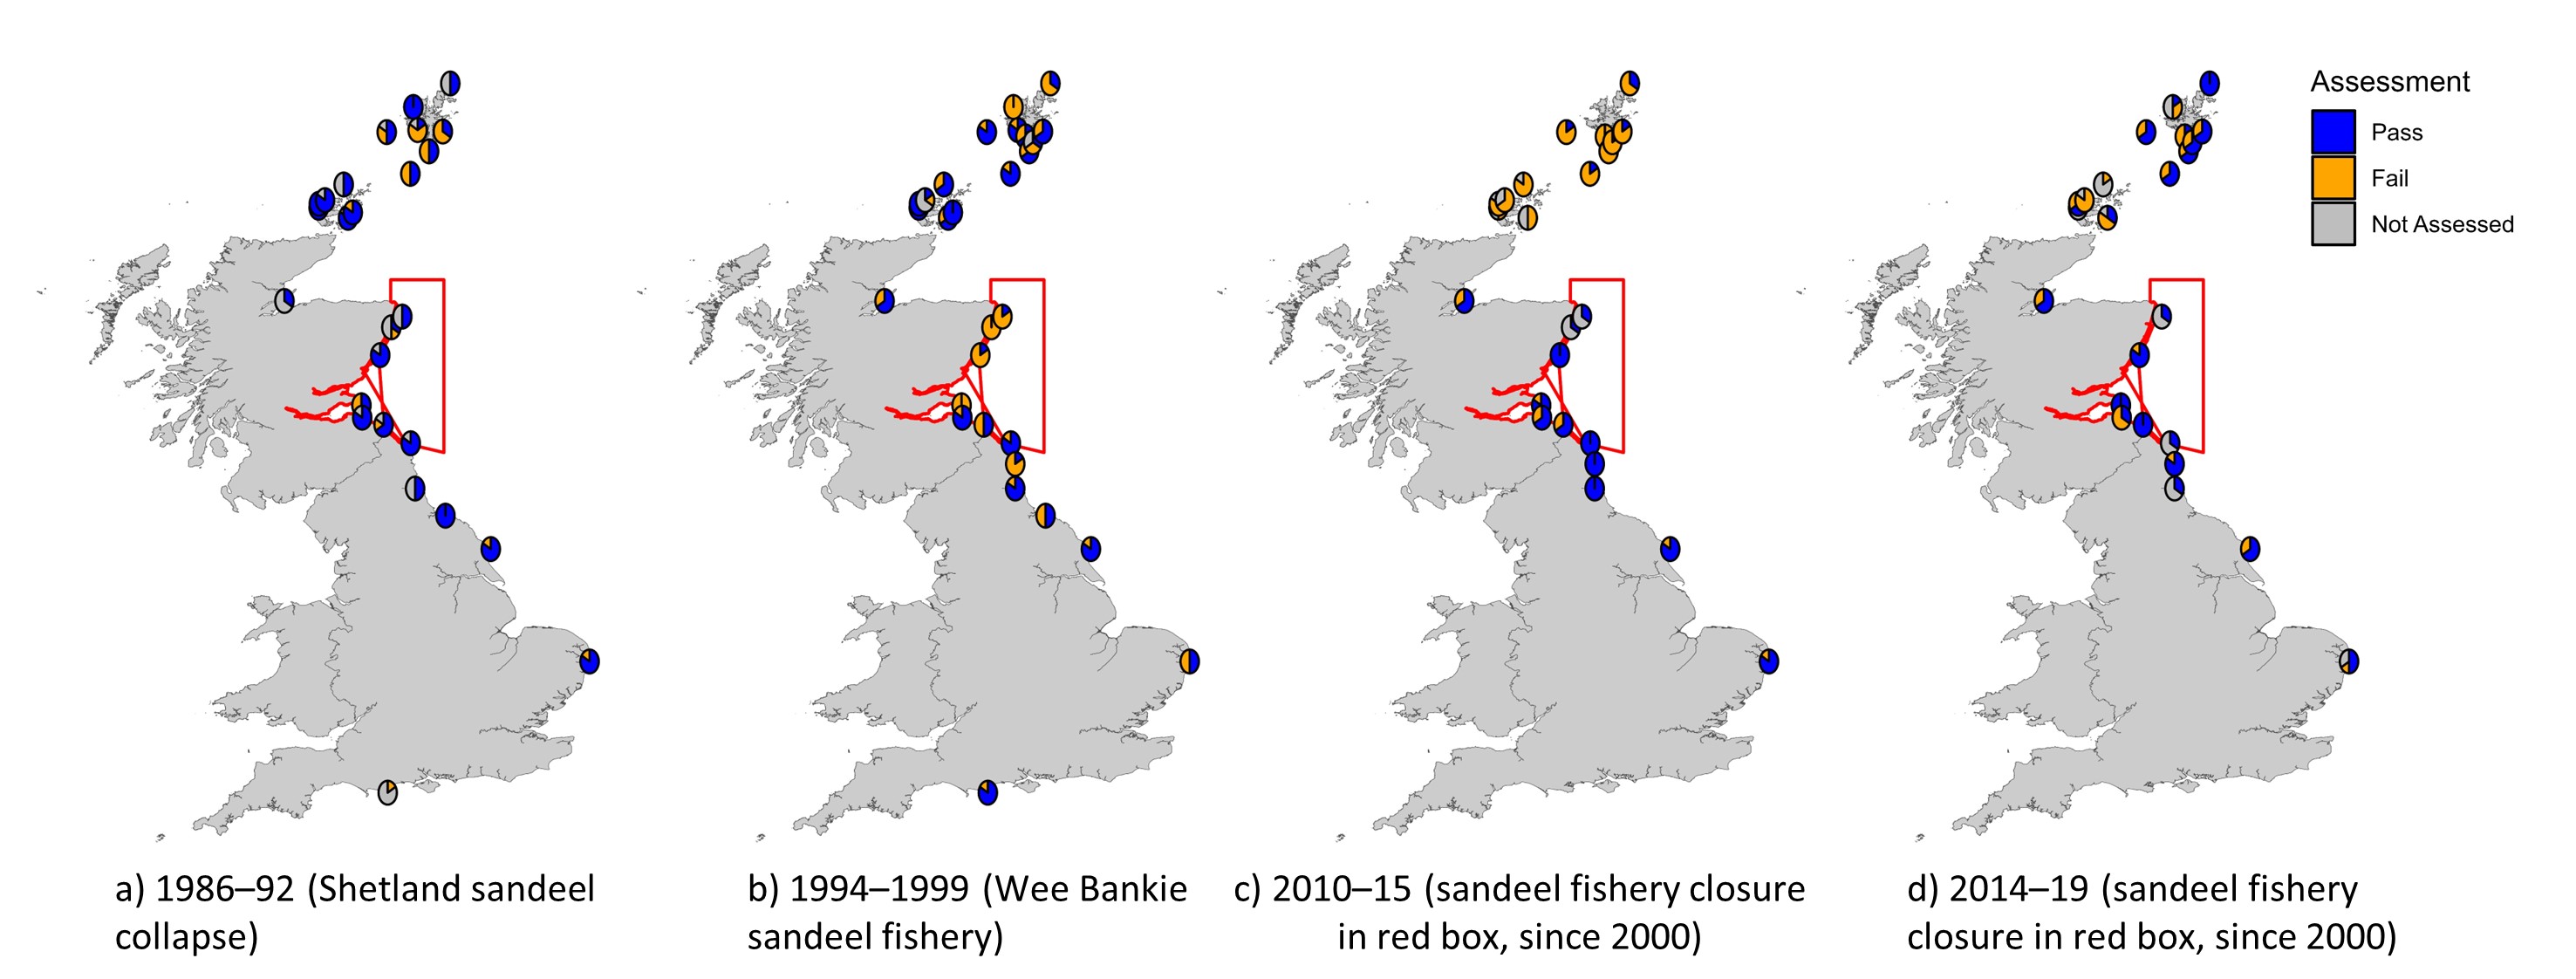
Figure 8. Proportion of years in which the target breeding success was met in each colony during the most recent 6-year assessment period d) 2014 to 2019, compared to examples of other 6-year periods: a) 1986 to 1992 during the Shetland sandeel collapse and b) 1994 to 1999 when the Wee Bankie sandeel fishery was in operation and c) during the last assessment 2010 to 2015. Pie charts: Blue denotes breeding success was as expected by prevailing climatic conditions and orange denotes that it was not. Red line denotes limits of sandeel fishing ban in place since the year 2000.
Conclusions
Only five of the 15 colonies sampled for this breeding success indicator (2014–2019) bred successfully in at least five of the six years assessed. Even with the closures of sandeel fisheries (up to the time of this assessment) this indicator assessment highlights the breeding success of kittiwakes is not improving, suggesting there may be other factors affecting this indicator.
Two colonies that passed this assessment, Hermaness and St Abb’s Head, have seen considerable declines in their breeding numbers over the last two decades (Table 1 & 3). Therefore, even within these positive stories, consideration of the wider context is necessary.

Black-legged kittiwake pairs and fledglings (photo from Ilka Win)
Though the data feeding into this indicator is of good quality and is utilising a known relationship of kittiwake breeding success and sea surface temperature (SST), the confidence in this indicator going forward may start to be limited. With the progression of climate change, both direct and indirect impacts of this pressure may become just as influential as the single aspect used in this indicator, SST.
This indicator also can only draw conclusions using North Sea colonies, finding a solution to enable the incorporation of Celtic Seas colonies will improve the confidence further.
Further information
This indicator was developed with the aim of assessing if additional anthropogenic pressures, other than climatic change, were negatively influencing kittiwake breeding success. Considering one of the possible main pressures, the industrial fishing of sandeels, is limited (or banned) in adjacent seas to many of the colonies assessed, yet the majority have still failed the assessment suggests a more complex picture. This is highlighted further when considering the opposite trend that is seemingly happening in other species with similar foraging strategies such as terns. Where kittiwakes are failing, abundance and breeding success trends for some tern species are increasing or stable. These opposing trends in species that have similar foraging strategies are worth exploring further, not only to understand the processes influencing these trends, but also to enable more targeted conservation action, addressing the key pressures acting on the different species. Such specific actions could e.g. be incorporated into the seabird conservation strategies and action plans currently being developed by the four countries in the UK.
Understanding the other underlying factors influencing kittiwake breeding success, both natural and or anthropogenic, will strengthen this indicator further. Additionally, disentangling other important relationships linked to climate change, such as frequency of stochastic events, from other anthropogenic pressures and finding a way to account for these appropriately would help to future proof this indicator.
Knowledge gaps
This indicator could be used with more confidence to inform management through improving understanding of:
-
the processes within the marine ecosystem which lead to the significant relationship between kittiwake breeding success and sea surface temperature
-
the causes of the lower-than-expected breeding success of kittiwakes in Orkney and Shetland
-
the ecosystem processes influencing kittiwake breeding success in the Celtic Seas
-
the impacts and possible increase of random or unpredictable events with a changing climate
Further information
Filling the four knowledge gaps detailed below will enable this indicator to be used with more confidence in a management framework.
Understanding the ecosystem processes driving the relationship between kittiwake breeding success and sea surface temperature
This indicator uses a statistical relationship between mean winter sea surface temperature and kittiwake breeding success to account for prevailing climatic conditions. Carroll and others (2015) found that higher breeding success at some of the colonies included in this indicator was also associated with weaker stratification in temperature within the water column before breeding and lower mean water sea surface temperature during the breeding season. Frederiksen and others (2004) first suggested that the link between temperature and kittiwake breeding success was a result of processes further down the food chain that affected the abundance and/or availability of sandeels, on which kittiwakes feed. Recently, Carroll and others (2017) found sea surface temperature to be negatively related to sandeel biomass, as well as to kittiwake breeding success. However, the processes which lead to this correlation are not understood. Arnott and Ruxton (1992) suggested warm winters lead to low sandeel recruitment, perhaps by reducing the food supplies available to larval sandeels. But recently, Eerkes-Medrano and others (2017) found that winter sea temperature in an area of the North Sea, east of the Firth of Forth was not a reliable indicator of the abundance of sandeels or of their prey (Calanus copepods in the zooplankton). Further work is needed to determine the nature of a causal link between sea temperature and the abundance of sandeels. This will help to determine whether kittiwake breeding success can be used to indicate changes at lower trophic levels.
Understanding the causes of low breeding in Orkney and Shetland
It is unclear why kittiwake breeding success has been poorer than expected across all colonies in Orkney and Shetland since the early 2000s. It is unlikely to have been due to fishing pressure since this was low or even absent due to voluntary bans during this period (ICES, 2017). In some years, extreme weather events such as heavy rain that washes nests from cliffs may also have lowered breeding success, but such events are unlikely to have caused such widespread and sustained reductions in breeding success.
At some colonies, particularly on Shetland, predation from great skuas is likely to be a major cause of poor breeding success and declines in colony size (Furness, 1997; Heubeck and others, 1999). During the 1990s predation of seabirds by skuas increased as other food sources declined, including discards and natural prey such as sandeels (Votier and others, 2004). Levels of high predation by great skuas may to continue as discards are eventually eliminated in UK waters by EC Landings Obligations.
In the late 1980s, changes in ocean currents led to low levels of sandeels in waters around Shetland and therefore, the poor breeding success of kittiwakes and other seabirds at Shetland colonies (Hamer and others, 1993; Monaghan and others, 1989; Wright & Bailey, 1993). The reductions in kittiwake breeding success during the late 1980s were evident in this indicator. At such times when sandeel availability is low, kittiwake may struggle to find alternative food source, such as sprat, which are relatively scarce around the Northern Isles (Macdonald & Napier, 2014).
Further examination of available evidence on the above impacts is required to determine their relative importance at each of the colonies included in this assessment in Orkney and Shetland. This will help to identify any possible management that may help to enhance breeding success of kittiwakes in the Northern Isles.
This indicator could not be developed for the Celtic Seas because no relationship between sea surface temperature and kittiwake breeding success could be found by this and other studies (Cook and others, 2014b; Lauria and others, 2012). This is likely because sea surface temperature is not the primary driver of food availability on the west coast of the UK as a result of the convoluted tidal currents in coastal areas. Kittiwakes in the Celtic Seas are also more reliant on other species of small fish, such as sprat and herring, that are differently affected by, or more resilient to, changes in sea surface temperature compared to sandeels. It is currently unknown what the primary drivers of change in breeding success of kittiwakes are on the west coast of the UK, or whether these operate via changes in food availability. A multi-trophic level, region-wide approach would most likely aid our understanding of the ecological processes regulating marine food webs in response to climate change.
Understanding the ecosystem processes driving kittiwake breeding success in the Celtic Seas and the west coast of the UK.
This indicator could not be developed for the Celtic Seas because no relationship between sea surface temperature and kittiwake breeding success could be found by this and other studies (Cook and others, 2014b; Lauria and others, 2012). The trends in kittiwake breeding success in the Celtic Seas region appear to be in decline (Johnston and others, 2021). There does appear to be correlation between low breeding success and the heterogeneity of foraging habitats (Johnston and others, 2021) however, understanding how or if climate change is impacting this further (possibly through increased storm frequency for example), is not well known. Additionally, it is suggested that kittiwake in the Celtic Seas may utilise a more diverse range of food sources, compared to their North Sea counterparts (Chivers and others, 2012). Having a more varied diet has been linked to more successful breeding and the availability of these different forage fish is likely a driving factor of kittiwake breeding success in this area. What is not well known is how climate change may or is influencing this availability. Both of these aspects in the Celtic Seas need further investigation to understand if the climatic influences that may, or may not be impacting them, can be suitably disentangled from the other possible anthropogenic pressures this indicator hopes to assess. A multi-trophic level and region-wide approach would most likely aid our understanding of the ecological processes regulating marine food webs in response to climate change. It may allow for regional specific models to be implemented within this indicator to allow for an overall UK assessment, rather than relying on just the North Sea relationship.
Understanding the impacts of stochastic events and their possible increase with a changing climate.
In 2021 the beginnings of a severe outbreak of Highly Pathogenic Avian Influenza (HPAI) appeared within seabird colonies across Europe. The outbreak continued into the proceeding years initially affecting mostly great skuas and northern gannets in 2022 (Cunningham and others, 2022). Other species like gulls, terns and kittiwakes seemed to be impacted in the following season, 2023. Events like this and the impacts they may have on kittiwake breeding success will need to be carefully considered in future assessments. A large proportion of the breeding great skua population was potentially lost in 2022 (Cunningham and others, 2022), which may minimise the predation experienced by kittiwake colonies in Orkney and Shetland, thus possibly improving the indicator for these colonies for a few years (see above). Conversely, in 2023, the mortality of both adult and young kittiwakes on the east coast of the UK was high, possibly due to the HPAI outbreak which may have the opposite effect as the reduced predation. The HPAI outbreak is one stochastic event that may extend across several years however, with climate change increased frequency of such disease outbreaks is a possibility (IPCC, 2022).
Similarly, to increased frequency of disease outbreaks, extreme weather events are suggested to increase with the progression of climate breakdown (IPCC, 2022). This indicator currently attempts to account for stochastic events by assuming one in six seasons is likely to fail due to such occurrences. However, this may not be appropriate for future analyses, if such incidents are to increase and not in a systematic way. Gaining a better understanding of the impact of events such as marine heatwaves and increased storm frequency have on kittiwake breeding success could help to better account for these in the assessment. This understanding would strengthen the indicator by further disentangling climate change impacts on breeding success of kittiwakes, from other anthropogenic sources of pressure.
References
Arnott, S.A., Ruxton, G.D., 2002. Sandeel recruitment in the North Sea: demographic, climatic and trophic effects. Marine Ecology Progress Series, 238, 199–210.
Carroll, M.J., Butler, A., Owen, E., Ewing, S.R., Cole, T., Green, J.A., Soanes, L.M., Arnould, J.P.Y., Newton, S.F., Baer, J., Daunt, F., Wanless, S., Newell, M.A., Robertson, G.S., Mavor, R.A., Bolton, M., 2015. Effects of sea temperature and stratification changes on seabird breeding success. Climate Research, 66, 75–89.
Carroll, M.J., Bolton, M., Owen, E., Anderson, G.Q.A., Mackley, E.K., Dunn, E.K., Furness, R.W., 2017. Kittiwake breeding success in the southern North Sea correlates with prior sandeel fishing mortality. Aquatic Conservation: Marine and Freshwater Ecosystems, 27(6), 1164–1175.
Champely, S., 2017. pwr: Basic Functions for Power Analysis. R package version 1.2-1. https://cran.r-project.org/web/packages/pwr/pwr.pdf
Chivers, L.S., Lundy, M.G., Colhoun, K., Newton, S.F., Reid, N., 2012. Diet of black-legged kittiwakes (Rissa tridactyla) feeding chicks at two Irish colonies highlights the importance of clupeids. Bird Study, 59(3), 363–367.
Cook, A.S.C.P., Dadam, D., Mitchell, I., Ross-Smith, V.H., Robinson, R.A., 2014a. Indicators of seabird reproductive performance demonstrate the impact of commercial fisheries on seabird populations in the North Sea. Ecological Indicators, 38, 1–11.
Cook, A.S.C.P., Robinson, R.A., Ross-Smith, V.H., 2014b. Development of MSFD indicators, baselines and target for seabird breeding failure occurrence in the UK (2012). JNCC Report No. 539. Joint Nature Conservation Committee, Peterborough, 84 pp.
Cunningham, E.J.A., Gamble, A., Hart, T., Humphreys, E.M., Philip, E., Tyler, G., Wood, M.J., 2022. The incursion of Highly Pathogenic Avian Influenza (HPAI) into North Atlantic seabird populations: an interim report from the 15th International Seabird Group conference. Seabird, 34, 67–73.
Ellis, J.R., Milligan, S.P., Readdy, L., Taylor, N., Brown, M.J., 2012. Spawning and nursery grounds of selected fish species in UK waters. Science Series Technical Report No. 147. Cefas, Lowestoft, UK, 56 pp.
Eerkes-Medrano, D., Fryer, R.J., Cook, K.B., Wright, P.J., 2017. Are simple environmental indicators of food web dynamics reliable: exploring the kittiwake-temperature relationship. Ecological Indicators, 75, 36–47.
Frederiksen, M., Wanless, S., Harris, M.P., Rothery, P., Wilson, L.J., 2004. The role of industrial fisheries and oceanographic change in the decline of North Sea black-legged kittiwakes. Journal of Applied Ecology, 41(6), 1129–1139.
Frederiksen, M., Wright, P.J., Harris, M.P., Mavor, R.A., Heubeck, M., Wanless, S., 2005. Regional patterns of kittiwake Rissa tridactyla breeding success are related to variability in sandeel recruitment. Marine Ecology Progress Series, 300, 201–211.
Frederiksen, M., Mavor, R.A., Wanless, S., 2007. Seabirds as environmental indicators: the advantages of combining data sets. Marine Ecology Progress Series, 352, 205–211.
Frederiksen, M., Jensen, H., Daunt, F., Mavor, R.A., Wanless, S., 2008. Differential effects of a local industrial sand lance fishery on seabird breeding performance. Ecological Applications, 18(3), 701–710.
Furness, R.W., 1997. The impact of predation by great skuas on other species with particular reference to Special Protection Areas in Shetland. Report to Scottish Natural Heritage.
Greenstreet, S.P.R., Rossberg, A.G., Fox, C.J., Le Quesne, W.J.F., Blasdale, T., Boulcott, P., Mitchell, I., Millar, C., Moffat, C.F., 2012. Demersal fish biodiversity: species-level indicators and trends-based targets for the Marine Strategy Framework Directive. ICES Journal of Marine Science, 69(10), 1789–1801.
Hamer, K.C., Monaghan, P., Uttley, J.D., Walton, P., Burns, M.D., 1993. The influence of food supply on the breeding ecology of kittiwakes Rissa tridactyla in Shetland. Ibis, 135(3), 255–263.
Heubeck, M., Mellor, R.M., Harvey, P.V., Mainwood, A.R., Riddington, R., 1999. Estimating the population size and rate of decline of kittiwakes Rissa tridactlya breeding in Shetland, 1981–97. Bird Study, 46(1), 48–61.
HM Government, 2012. Marine strategy part one: UK initial assessment and good environmental status. Department for Environment Food and Rural Affairs.
ICES, 2015. Report of the joint ICES/OSPAR working group on seabirds (JWGBIRD), 17–21 November 2014. ICES Expert Group report, ICES CM 2014/ACOM:30. International Council for the Exploration of the Sea, Copenhagen, Denmark.
ICES, 2017. Sandeel (Ammodytes spp.) in Division 4.a, Sandeel Area 7r (northern North Sea, Shetland). ICES advice on fishing opportunities, catch, and effort, Greater North Sea Ecoregion (san.sa.7r).
IPCC, 2022. Climate change 2022: impacts, adaptation and vulnerability. Contribution of Working Group II to the Sixth Assessment Report of the Intergovernmental Panel on Climate Change [Pörtner, H.-O., Roberts, D.C., Tignor, M.M.B., Poloczanska, E., Mintenbeck, K., Alegría, A., Craig, M., Langsdorf, S. Löschke, S., Möller, V., Okem, A., Rama, B. (eds.)]. Cambridge University Press. Cambridge University Press, Cambridge, UK and New York, NY, USA, 3056 pp.
Johnston, D.T., Cook, A.S.C.P., Humphreys, E.M., 2021. Assessment of the current status of black-legged kittiwake Rissa tridactyla in Wales. NRW Evidence Report No. 558. Natural Resources Wales.
Lauria, V., Attrill, M.J., Pinnegar, J.K., Brown, A., Edwards, M., Votier, S.C., 2012. Influence of climate change and trophic coupling across four trophic levels in the Celtic Sea. PLoS One, 7(10), e47408.
Macdonald, P., Napier, I., 2014. Survey trends of fish species in Shetland coastal waters. NAFC Marine Centre, Shetland, UK.
Mitchell, P.I., Newton, S.F., Ratcliffe, N., Dunn, T.E. (eds.), 2004. Seabird populations of Britain and Ireland: results of the Seabird 2000 census (1998-2002). T. & A.D. Poyser, London, 508 pp.
Mitchell, I., Cook, A., Douse, A., Foster, S., Kershaw, M., McCulloch, N., Murphy, M., Hawkridge, J., 2018. Kittiwake breeding success. UK Marine Online Assessment Tool [Online]. Available from: https://moat.cefas.co.uk/biodiversity-food-webs-and-marine-protected-areas/birds/kittiwake-breeding-success/ (Accessed 13 12 2023).
Monaghan, P., Uttley, J.D., Okil, J.D., 1989. Terns and sandeels: seabirds as indicators of changes in marine fish populations. Journal of Fish Biology, 35, 339–340.
OSPAR Commission, 2023. OSPAR Assessments [Online]. Available from: https://oap.ospar.org/en/ospar-assessments/quality-status-reports/qsr-2023/indicator-assessments/ (Accessed 13 12 2023).
Pierce, D., 2023. ncdf4: Interface to Unidata netCDF (Version 4 or Earlier) Format Data Files. R package version 1.21. https://cran.r-project.org/web/packages/ncdf4/ncdf4.pdf
R Core Team, 2023. R: a language and environment for statistical computing. R Foundation for Statistical Computing, Vienna, Austria.
Rayner, N.A., Parker, D.E., Horton, E.B., Folland, C.K., Alexander, L.V., Rowell, D.P., Kent, E.C., Kaplan, A., 2003. Global analyses of sea surface temperature, sea ice, and night marine air temperature since the late nineteenth century. Journal of Geophysical Research: Atmospheres, 108(D14), 4407.
Searle, K.R., Regan, C.E., Perrow, M.R., Butler, A., Rindorf, A., Harris, M.P., Newell, M.A., Wanless, S., Daunt, F., 2023. Effects of a fishery closure and prey abundance on seabird diet and breeding success: implications for strategic fisheries management and seabird conservation. Biological Conservation, 281, 109990.
Votier, S.C., Furness, R.W., Bearhop, S., Crane, J.E., Caldow, R.W.G., Catry, P., Ensor, K., Hamer, K.C., Hudson, A.V., Kalmbach, E., Klomp, N.I., Pfeiffer, S., Phillips, R.A., Prieto, I., Thompson, D.R., 2004. Changes in fisheries discard rates and seabird communities. Nature, 427, 727–730.
Wright, P.J., Bailey, M.C., 1993. Biology of sandeels in the vicinity of seabird colonies at Shetland. Fisheries Research Report No. 15/93. SOAFD Marine Laboratory, Aberdeen, UK.
Authors
Lead authors: Daisy Burnell1, Sarah Fenn1, Kerstin Kober1
Supporting Authors: Matthew Murphy2, Lucy Quinn3, Richard Berridge4, Justin Hart4, Aoibheann Morrison5, Claire Macnamara5, Aonghais Cook6 and Rob Robinson7
Supported by: The Marine Bird Sub-Group of the Healthy Biologically Diverse Seas Evidence Group
1 Joint Nature Conservation Committee
2 Natural Resources Wales
3 NatureScot
4 Natural England
5 Department of Agriculture, Environment and Rural Affairs
6 The Biodiversity Consultancy
7 British Trust for Ornithology
Citation:
Daisy Burnell, Sarah Fenn, Kerstin Kober, Matthew Murphy, Lucy Quinn, Richard Berridge, Justin Hart, Aoibheann Morrison, Claire Macnamara, Aonghais Cook and Rob Robinson (2024) Breeding success of kittiwake indicator assessment for the UK Marine Strategy. In: UK Marine Online Assessment Tool, available at: https://moat.cefas.co.uk/biodiversity-food-webs-and-marine-protected-areas/marine-birds/kittiwake-breeding-success/
Assessment metadata
| Assessment Type | UK Marine Strategy Assessment Part 1 (2025) – Indicator Assessment |
|---|---|
Marine Birds | |
| Point of contact email | marinestrategy@defra.gov.uk |
| Metadata date | Thursday, May 1, 2025 |
| Title | Kittiwake breeding |
| Resource abstract | |
| Linkage | TBC |
| Conditions applying to access and use | UK Government Data policy |
| Assessment Lineage | UK Marine Strategy Part 1 Assessment in 2019: |
| Dataset metadata | Please contact: marinestrategy@defra.gov.uk
|
| Dataset DOI | Contact marinestrategy@defra.gov.uk |
The Metadata are “data about the content, quality, condition, and other characteristics of data” (FGDC Content Standard for Digital Geospatial Metadata Workbook, Ver 2.0, May 1, 2000).
Metadata definitions
Assessment Lineage - description of data sets and method used to obtain the results of the assessment
Dataset – The datasets included in the assessment should be accessible, and reflect the exact copies or versions of the data used in the assessment. This means that if extracts from existing data were modified, filtered, or otherwise altered, then the modified data should be separately accessible, and described by metadata (acknowledging the originators of the raw data).
Dataset metadata – information on the data sources and characteristics of data sets used in the assessment (MEDIN and INSPIRE compliance).
Digital Object Identifier (DOI) – a persistent identifier to provide a link to a dataset (or other resource) on digital networks. Please note that persistent identifiers can be created/minted, even if a dataset is not directly available online.
Indicator assessment metadata – data and information about the content, quality, condition, and other characteristics of an indicator assessment.
MEDIN discovery metadata - a list of standardized information that accompanies a marine dataset and allows other people to find out what the dataset contains, where it was collected and how they can get hold of it.