
Marine Birds
The extent to which Good Environmental Status has been achieved
Marine Birds overall have not achieved Good Environmental Status (GES). Although there has been improvement in one of the breeding seabird indicators (presence of invasive mammals on important seabird islands) the outlook remains ‘not good’ across most of the functional groups in both the Greater North Sea and Celtic Seas regions.

Long-tailed duck (Clangula hyemalis) (Photo credit Daisy Burnell).
Progress since previous assessments
A summary of the status of each indicator used for the Marine Birds Thematic Assessment is provided in Table 1. A summary of the species group assessments is presented in Table 2. The inclusion of the non-breeding component of B6 makes comparison with the previous assessment challenging. This evidence was considered in the Convention for the Protection of the Marine Environment of the North-East Atlantic (OSPAR) Quality Status Report 2023 (QSR) using only B1 and B3 however, which suggests there has been some improvements across the groups and regions, but the overall status for each species group has not changed.
The integration used for this assessment is different from the previous UK Marine Strategy (UKMS) assessment. Figure 1 more closely resembles the previous assessment’s layout. Comparing these outputs, it would appear for both regions that abundance of non-breeding marine birds has declined, with the Greater North Sea dropping below target. Breeding abundance, for both regions has improved, though not enough to meet target. Productivity was assessed in reverse for the past assessment (breeding failure, rather than success), for both regions this looks to have declined. The improvement of the invasive mammal indicator is positive and has largely been due to the work of the Biosecurity for LIFE project.
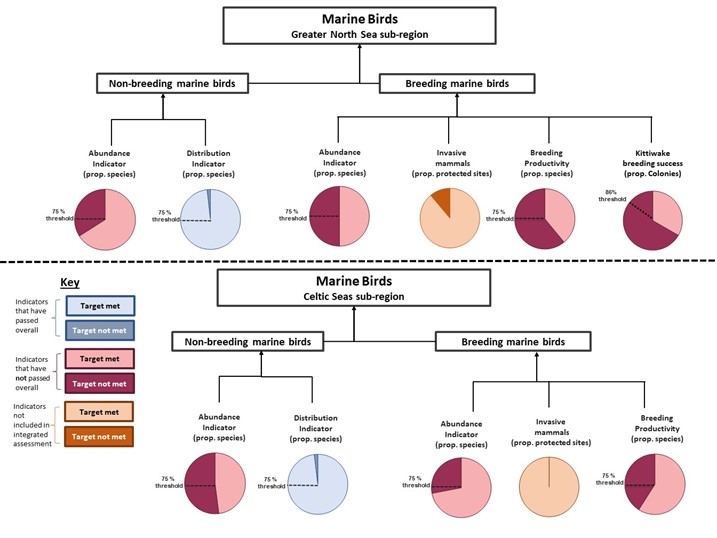
Figure 1. Schematic showing all the indicators and their targets (split into their non-breeding and breeding components) across each region, Greater North Sea (top) and Celtic Seas (bottom) and colour coded depending on whether overall they met or did not meet target overall for the region, or if they were not included in the integrated assessment.
How progress has been assessed
Assessment overview
‘Good’ GES status overall was only awarded if more than 75% of the species populations in each functional group were in ‘good’ status. Any less than 75% and the status of the group was deemed ‘not good’. For the two UK regions, Greater North Sea and Celtic Seas, ‘good’ status was given only if all bird groups were also in ‘good’ status, as per the Coordinated Environmental Monitoring Programme (CEMP) Guidelines.
Table 1. Overview of the indicator status for Marine Birds (2024)
|
Criteria 1 |
Population abundance |
|
2019 Target |
The population size of marine bird species has not declined substantially since 1992 as a result of human activities. |
|
Corresponding OSPAR QSR 2023 Indicator |
Marine bird abundance - B1 |
|
Greater North Sea |
Not met |
|
Celtic Seas |
Not met |
|
Criteria 2 |
Population demographic characteristics |
|
2019 Target |
Widespread lack of breeding success in marine birds caused by human activities should occur in no more than three years in six. |
|
Corresponding OSPAR QSR 2023 Indicator |
Marine Bird Breeding Productivity - B3 |
|
Greater North Sea |
Not met |
|
Celtic Seas |
Not met |
|
Indicator |
Kittiwake breeding success - B2 |
|
Greater North Sea |
Not met |
|
Celtic Seas |
Not used |
|
Indicator |
Invasive mammal presence on island seabird colonies - B4 |
|
Greater North Sea |
Met |
|
Celtic Seas |
Met |
|
Criteria 3 |
Distributional range |
|
2019 Target |
There is no significant change or reduction in population distribution of marine birds caused by human activities. |
|
Indicator |
Distribution of breeding and non-breeding marine birds - B6 |
|
Greater North Sea |
Met |
|
Celtic Seas |
Met |
|
Criteria 4 |
Bycatch mortality |
|
2019 Target |
The long-term viability of marine bird populations is not threatened by deaths caused by incidental bycatch in mobile and static fishing gear |
|
Indicator: |
Seabird bycatch - B5 |
|
Greater North Sea |
Not used |
|
Celtic Seas |
Not used |
Table 2. Overview of functional group status across the two UK relevant OSPAR regions: Greater North Sea and Celtic Seas.
|
Feeding Group |
Region |
No. species |
% species in good status |
Status of species group |
|
Surface |
Greater North Sea |
20 |
30 |
Not good |
|
Celtic Seas |
13 |
38 |
Not good |
|
|
Water column |
Greater North Sea |
19 |
84 |
Good |
|
Celtic Seas |
17 |
76 |
Good |
|
|
Benthic |
Greater North Sea |
9 |
67 |
Not good |
|
Celtic Seas |
8 |
63 |
Not good |
|
|
Wading |
Greater North Sea |
32 |
72 |
Not good |
|
Celtic Seas |
26 |
65 |
Not good |
|
|
Grazing |
Greater North Sea |
9 |
100 |
Good |
|
Celtic Seas |
8 |
88 |
Good |
|
|
All |
Greater North Sea |
89 |
67 |
Not good |
|
Celtic Seas |
72 |
65 |
Not good |
Detailed assessments
The overarching assessment for the status of the biodiversity of marine birds follows a similar approach to that taken by the OSPAR QSR marine bird thematic assessment and CEMP. This allows us to bring together and integrate findings from three indicators: Marine Bird Abundance (B1), Marine Bird Breeding Productivity (B3) and the non-breeding component of the Marine Bird Distribution (B6). From this, we can build a clear picture for the status of marine birds as presented here.
The confidence in the breeding component of the Marine Bird Distribution indicator (B6) was deemed too low to be used in the thematic assessment for marine birds. The Invasive Mammal indicator (B4) could not be integrated due to this assessment not being species specific.
The status for each species was assessed as ‘not good’ if at least one of the indicators failed. If a species had both breeding and non-breeding components in any of the indicators, these were assessed separately, thus counting as two elements. Species population assessments were then combined to assess the status of five functional species groups, which are:
-
Surface feeders (Table 3),
-
Water column feeders (Table 4),
-
Benthic feeders (Table 5),
-
Wading feeders (Table 6)
-
Grazing feeders (Table 7)
-
Combined assessment (Table 8)
The B6 indicator is not shown or utilised for the integrated assessment of the surface feeders functional group as there were no non-breeding surface feeding marine birds within it. However, the kittiwake breeding success indicator (B2), was considered alongside B1 and B3 for black-legged kittiwake in the Greater North Sea. The overall status for breeding black-legged kittiwake in the Greater North Sea remains ‘not good’ as the threshold for this indicator was not met.
There were no species in the benthic or grazing feeders functional groups included in the B3 indicator, hence the integrated assessments for these only include the B1 and B6 indicators. A pilot assessment of Marine Bird Bycatch (B5) was produced for QSR23, although the only UK relevant area and species with sufficient data was the Celtic Seas for Common Guillemot. Bycatch may be an issue, but an assessment was not possible as impacts cannot be attributed to specific breeding populations. Therefore, this indicator was not considered for this thematic summary.
Table 3. Surface-feeding marine birds species group indicator outcomes (B1, B3) and integrated assessment status. Breeding populations (B) and non-breeding populations (NB) are assessed separately. Blue: indicator threshold achieved or status 'good'. Red: indicator threshold not achieved or status 'not good'. OSPAR Listed species are shown in italics; * status solely derived from status assessment
|
Surface feeders |
Greater North Sea (OSPAR Region II) |
Celtic Seas (OSPAR Region III) |
|||||
|
B1 |
B3 |
Status |
B1 |
B3 |
Status |
||
|
NB |
Black-headed gull |
|
|
Good |
|
|
|
|
NB |
Common gull |
|
|
Good |
|
|
|
|
NB |
Great black-backed gull |
|
|
Not good |
|
|
|
|
NB |
European herring gull |
|
|
Not good |
|
|
|
|
NB |
Lesser black-backed gull |
|
|
Good |
|
|
|
|
NB |
Balearic Shearwater |
|
|
Not good* |
|
|
Not good* |
|
B |
Black-legged kittiwake |
|
|
Not good |
|
|
Not good |
|
B |
Black-headed gull |
|
|
Not good |
|
|
Not good |
|
B |
Common gull |
|
|
Not good |
|
|
Good |
|
B |
Great black-backed gull |
|
|
Not good |
|
|
Good |
|
B |
European herring gull |
|
|
Not good |
|
|
Not good |
|
B |
Lesser black-backed gull |
|
|
Not good |
|
|
Not good |
|
B |
Sandwich tern |
|
|
Good |
|
|
Good |
|
B |
Little tern |
|
|
Good |
|
|
Good |
|
B |
Roseate tern |
|
|
Good |
|
|
|
|
B |
Common tern |
|
|
Not good |
|
|
Not good |
|
B |
Arctic tern |
|
|
Not good |
|
|
Not good |
|
B |
Great skua |
|
|
Not good |
|
|
Good |
|
B |
Arctic skua |
|
|
Not good |
|
|
|
|
B |
Northern fulmar |
|
|
Not good |
|
|
Not good |
|
Number of species in good status |
|
|
6 |
|
|
5 |
|
|
Number of species not in good status |
|
|
14 |
|
|
8 |
|
|
Proportion of species in good status |
|
|
30% |
|
|
38% |
|
|
State of species group |
|
|
Not good |
|
|
Not good |
|
Table 4. Water column-feeding marine birds species group indicator outcomes (B1, B3, B6) and integrated assessment status. Breeding populations (B) and non-breeding populations (NB) are assessed separately. Blue: indicator threshold achieved or status 'good'. Red: indicator threshold not achieved or status 'not good'.
|
Water column feeders |
Greater North Sea |
Celtic Seas |
|||||||
|
Region II |
Region III |
||||||||
|
B1 |
B3 |
B6 |
Status |
B1 |
B3 |
B6 |
Status |
||
|
NB |
Red-throated Diver |
|
|
|
Good |
|
|
|
Good |
|
NB |
Black-throated Diver |
|
|
|
Not good |
|
|
|
Good |
|
NB |
Great Northern Diver |
|
|
|
Good |
|
|
|
Good |
|
NB |
Goosander |
|
|
|
Good |
|
|
|
Good |
|
NB |
Red-breasted merganser |
|
|
|
Good |
|
|
|
Not good |
|
NB |
Little Grebe |
|
|
|
Good |
|
|
|
Good |
|
NB |
Great crested grebe |
|
|
|
Good |
|
|
|
Not good |
|
NB |
Slavonian Grebe |
|
|
|
Good |
|
|
|
Good |
|
NB |
Black-necked Grebe |
|
|
|
Good |
|
|
|
Good |
|
NB |
Kingfisher |
|
|
|
Good |
|
|
|
Good |
|
NB |
Great cormorant |
|
|
|
Good |
|
|
|
Good |
|
NB |
European shag |
|
|
|
Good |
|
|
|
|
|
B |
Common guillemot |
|
|
|
Good |
|
|
|
Good |
|
B |
Razorbill |
|
|
|
Good |
|
|
|
Not good |
|
B |
Black guillemot |
|
|
|
Good |
|
|
|
Good |
|
B |
Atlantic puffin |
|
|
|
Not good |
|
|
|
|
|
B |
Northern gannet |
|
|
|
Good |
|
|
|
Good |
|
B |
Great cormorant |
|
|
|
Good |
|
|
|
Not good |
|
B |
European shag |
|
|
|
Not good |
|
|
|
Good |
|
Number of species in good status |
|
|
|
16 |
|
|
|
13 |
|
|
Number of species not in good status |
|
|
|
3 |
|
|
|
4 |
|
|
Proportion of species in good status |
|
|
|
84% |
|
|
|
76% |
|
|
State of species group |
|
|
|
Good |
|
|
|
Good |
|
Table 5. Benthic-feeding marine birds species group indicator outcomes (B1, B6) and integrated assessment status. Breeding populations (B) and non-breeding populations (NB) are assessed separately. Blue: indicator threshold achieved or status 'good'. Red: indicator threshold not achieved or status 'not good'.
|
Benthic feeders |
Greater North Sea |
Celtic Seas |
|||||
|
Region II |
Region III |
||||||
|
B1 |
B6 |
Status |
B1 |
B6 |
Status |
||
|
NB |
Pochard |
|
|
Good |
|
|
Good |
|
NB |
Tufted Duck |
|
|
Good |
|
|
Good |
|
NB |
Greater scaup |
|
|
Not good |
|
|
Not good |
|
NB |
Common eider |
|
|
Not good |
|
|
Good |
|
NB |
Long-tailed duck |
|
|
Good |
|
|
Not good |
|
NB |
Common goldeneye |
|
|
Good |
|
|
Not good |
|
NB |
Velvet Scoter |
|
|
Good |
|
|
Good |
|
NB |
Common Scoter |
|
|
Good |
|
|
Good |
|
B |
Common eider |
|
|
Not good |
|
|
|
|
Number of species in good status |
|
|
6 |
|
|
5 |
|
|
Number of species not in good status |
|
|
3 |
|
|
3 |
|
|
Proportion of species in good status |
|
|
67% |
|
|
63% |
|
|
State of species group |
|
|
Not good |
|
|
Not good |
|
Table 6. Wading feeding marine birds species group indicator outcomes (B1, B3, B6) and integrated assessment status. Breeding populations (B) and non-breeding populations (NB) are assessed separately. Blue: indicator threshold achieved or status 'good'. Red: indicator threshold not achieved or status 'not good'.
|
Wading feeders |
Greater North Sea |
Celtic Seas |
||||||||
|
Region II |
Region III |
|||||||||
|
B1 |
B3 |
B6 |
Status |
B1 |
B3 |
B6 |
Status |
|||
|
NB |
Common shelduck |
|
|
|
Good |
|
|
|
Not good |
|
|
NB |
Eurasian teal |
|
|
|
Good |
|
|
|
Good |
|
|
NB |
Northern pintail |
|
|
|
Good |
|
|
|
Not good |
|
|
NB |
Eurasian spoonbill |
|
|
|
Good |
|
|
|
Good |
|
|
NB |
Eurasian oystercatcher |
|
|
|
Not good |
|
|
|
Good |
|
|
NB |
Pied Avocet |
|
|
|
Good |
|
|
|
Good |
|
|
NB |
Lapwing |
|
|
|
Good |
|
|
|
Good |
|
|
NB |
Golden Plover |
|
|
|
Good |
|
|
|
Good |
|
|
NB |
Grey Plover |
|
|
|
Not good |
|
|
|
Not good |
|
|
NB |
Common ringed Plover |
|
|
|
Good |
|
|
|
Not good |
|
|
NB |
Black-tailed godwit |
|
|
|
Good |
|
|
|
Good |
|
|
NB |
Bar-tailed godwit |
|
|
|
Good |
|
|
|
Not good |
|
|
NB |
Eurasian whimbrel |
|
|
|
Good |
|
|
|
Good |
|
|
NB |
Eurasian curlew |
|
|
|
Good |
|
|
|
Not good |
|
|
NB |
Spotted redshank |
|
|
|
Not good |
|
|
|
|
|
|
NB |
Common redshank |
|
|
|
Good |
|
|
|
Good |
|
|
NB |
Common greenshank |
|
|
|
Good |
|
|
|
Good |
|
|
NB |
Ruddy turnstone |
|
|
|
Good |
|
|
|
Not good |
|
|
NB |
Red knot |
|
|
|
Not good |
|
|
|
Good |
|
|
NB |
Sanderling |
|
|
|
Good |
|
|
|
Good |
|
|
NB |
Purple sandpiper |
|
|
|
Not good |
|
|
|
Not good |
|
|
NB |
Dunlin |
|
|
|
Not good |
|
|
|
Not good |
|
|
NB |
Ruff |
|
|
|
Not good |
|
|
|
|
|
|
NB |
Jack Snipe |
|
|
|
Good |
|
|
|
Good |
|
|
NB |
Snipe |
|
|
|
Good |
|
|
|
Good |
|
|
NB |
Common sandpiper |
|
|
|
Good |
|
|
|
Good |
|
|
NB |
Little egret |
|
|
|
Good |
|
|
|
Good |
|
|
NB |
Grey Heron |
|
|
|
Good |
|
|
|
Good |
|
|
B |
Eurasian spoonbill |
|
|
|
Good |
|
|
|
|
|
|
B |
Eurasian oystercatcher |
|
|
|
Not good |
|
|
|
|
|
|
B |
Pied Avocet |
|
|
|
Not good |
|
|
|
|
|
|
B |
Common ringed Plover |
|
|
|
Good |
|
|
|
|
|
|
Number of species in good status |
|
|
|
23 |
|
|
|
17 |
||
|
Number of species not in good status |
|
|
|
9 |
|
|
|
9 |
||
|
Proportion of species in good status |
|
|
|
72% |
|
|
|
65% |
||
|
State of species group |
|
|
|
Not good |
|
|
|
Not good |
||
Table 7. Grazing feeding marine birds species group indicator outcomes (B1, B6) and integrated assessment status. Breeding populations (B) and non-breeding populations (NB) are assessed separately. Blue: indicator threshold achieved or status 'good'. Red: indicator threshold not achieved or status 'not good'.
|
Grazing feeders |
Greater North Sea |
Celtic Seas |
|||||
|
Region II |
Region III |
||||||
|
B1 |
B6 |
Status |
B1 |
B6 |
Status |
||
|
NB |
Barnacle goose |
|
|
Good |
|
|
Good |
|
NB |
Brent goose |
|
|
Good |
|
|
Good |
|
NB |
Mute Swan |
|
|
Good |
|
|
Good |
|
NB |
Eurasian wigeon |
|
|
Good |
|
|
Good |
|
NB |
Mallard |
|
|
Good |
|
|
Not good |
|
NB |
Northern shoveler |
|
|
Good |
|
|
Good |
|
NB |
Gadwall |
|
|
Good |
|
|
Good |
|
NB |
Coot |
|
|
Good |
|
|
Good |
|
B |
Barnacle goose |
|
|
Good |
|
|
|
|
Number of species in good status |
|
|
9 |
|
|
7 |
|
|
Number of species not in good status |
|
|
0 |
|
|
1 |
|
|
Proportion of species in good status |
|
|
100% |
|
|
88% |
|
|
State of species group |
|
|
Good |
|
|
Good |
|
Table 8. Overall status for each species used within the integrated assessment split by breeding and non-breeding populations and by region. Red: indicator threshold not achieved or status 'not good'. * status solely derived from status assessment.
|
Breeding |
|||
|
Species |
Greater North Sea |
Species |
Celtic Seas |
|
Black-legged kittiwake |
Not good |
Black-legged kittiwake |
Not good |
|
Black-headed gull |
Not good |
Black-headed gull |
Not good |
|
Common gull |
Not good |
Common gull |
Good |
|
Great black-backed gull |
Not good |
Great black-backed gull |
Good |
|
European herring gull |
Not good |
European herring gull |
Not good |
|
Lesser black-backed gull |
Not good |
Lesser black-backed gull |
Not good |
|
Sandwich tern |
Good |
Sandwich tern |
Good |
|
Little tern |
Good |
Little tern |
Good |
|
Roseate tern |
Good |
Common tern |
Not good |
|
Common tern |
Not good |
Arctic tern |
Not good |
|
Arctic tern |
Not good |
Great skua |
Good |
|
Great skua |
Not good |
Northern fulmar |
Not good |
|
Arctic skua |
Not good |
Common guillemot |
Good |
|
Northern fulmar |
Not good |
Razorbill |
Not good |
|
Common guillemot |
Good |
Black guillemot |
Good |
|
Razorbill |
Good |
Northern gannet |
Good |
|
Black guillemot |
Good |
Great cormorant |
Not good |
|
Atlantic puffin |
Not good |
European shag |
Good |
|
Northern gannet |
Good |
Good status |
9 |
|
Great cormorant |
Good |
Not good |
9 |
|
European shag |
Not good |
Good status (%) |
50 |
|
Common eider |
Not good |
|
|
|
Eurasian spoonbill |
Good |
|
|
|
Eurasian oystercatcher |
Not good |
|
|
|
Pied Avocet |
Not good |
|
|
|
Common ringed Plover |
Good |
|
|
|
Barnacle goose |
Good |
|
|
|
Good status |
11 |
|
|
|
Not good |
16 |
|
|
|
Good status (%) |
41 |
|
|
|
Non-breeding |
|||
|
Species |
Greater North Sea |
Species |
Celtic Seas |
|
Black-headed gull |
Good |
Balearic Shearwater |
Not good* |
|
Common gull |
Good |
Red-throated Diver |
Good |
|
Great black-backed gull |
Not good |
Black-throated Diver |
Good |
|
European herring gull |
Not good |
Great Northern Diver |
Good |
|
Lesser black-backed gull |
Good |
Goosander |
Good |
|
Balearic Shearwater |
Not good* |
Red-breasted merganser |
Not good |
|
Red-throated Diver |
Good |
Little Grebe |
Good |
|
Black-throated Diver |
Not good |
Great crested grebe |
Not good |
|
Great Northern Diver |
Good |
Slavonian Grebe |
Good |
|
Goosander |
Good |
Black-necked Grebe |
Good |
|
Red-breasted merganser |
Good |
Kingfisher |
Good |
|
Little Grebe |
Good |
Great cormorant |
Good |
|
Great crested grebe |
Good |
Pochard |
Good |
|
Slavonian Grebe |
Good |
Tufted Duck |
Good |
|
Black-necked Grebe |
Good |
Greater scaup |
Not good |
|
Kingfisher |
Good |
Common eider |
Good |
|
Great cormorant |
Good |
Long-tailed duck |
Not good |
|
European shag |
Good |
Common goldeneye |
Not good |
|
Pochard |
Good |
Velvet Scoter |
Good |
|
Tufted Duck |
Good |
Common Scoter |
Good |
|
Greater scaup |
Not good |
Common shelduck |
Not good |
|
Common eider |
Not good |
Eurasian teal |
Good |
|
Long-tailed duck |
Good |
Northern pintail |
Not good |
|
Common goldeneye |
Good |
Eurasian spoonbill |
Good |
|
Velvet Scoter |
Good |
Eurasian oystercatcher |
Good |
|
Common Scoter |
Good |
Pied Avocet |
Good |
|
Common shelduck |
Good |
Lapwing |
Good |
|
Eurasian teal |
Good |
Golden Plover |
Good |
|
Northern pintail |
Good |
Grey Plover |
Not good |
|
Eurasian spoonbill |
Good |
Common ringed Plover |
Not good |
|
Eurasian oystercatcher |
Not good |
Black-tailed godwit |
Good |
|
Pied Avocet |
Good |
Bar-tailed godwit |
Not good |
|
Lapwing |
Good |
Eurasian whimbrel |
Good |
|
Golden Plover |
Good |
Eurasian curlew |
Not good |
|
Grey Plover |
Not good |
Common redshank |
Good |
|
Common ringed Plover |
Good |
Common greenshank |
Good |
|
Black-tailed godwit |
Good |
Ruddy turnstone |
Not good |
|
Bar-tailed godwit |
Good |
Red knot |
Good |
|
Eurasian whimbrel |
Good |
Sanderling |
Good |
|
Eurasian curlew |
Good |
Purple sandpiper |
Not good |
|
Spotted redshank |
Not good |
Dunlin |
Not good |
|
Common redshank |
Good |
Jack Snipe |
Good |
|
Common greenshank |
Good |
Snipe |
Good |
|
Ruddy turnstone |
Good |
Common sandpiper |
Good |
|
Red knot |
Not good |
Little egret |
Good |
|
Sanderling |
Good |
Grey Heron |
Good |
|
Purple sandpiper |
Not good |
Barnacle goose |
Good |
|
Dunlin |
Not good |
Brent goose |
Good |
|
Ruff |
Not good |
Mute Swan |
Good |
|
Jack Snipe |
Good |
Eurasian wigeon |
Good |
|
Snipe |
Good |
Mallard |
Not good |
|
Common sandpiper |
Good |
Northern shoveler |
Good |
|
Little egret |
Good |
Gadwall |
Good |
|
Grey Heron |
Good |
Coot |
Good |
|
Barnacle goose |
Good |
Good status |
38 |
|
Brent goose |
Good |
Not good |
16 |
|
Mute Swan |
Good |
Good status (%) |
70 |
|
Eurasian wigeon |
Good |
|
|
|
Mallard |
Good |
|
|
|
Northern shoveler |
Good |
|
|
|
Gadwall |
Good |
|
|
|
Coot |
Good |
|
|
|
Good status |
49 |
|
|
|
Not good |
13 |
|
|
|
Good status (%) |
79 |
|
|
Additional information about the status the UK’s breeding seabirds can be found in the recent update to the IUCN Birds of Conservation Concern Red List assessment for marine birds.
Achievement of targets and indicators used to assess progress in 2024

Drivers, activities and pressures affecting the state of the marine environment
Marine bird biodiversity in the UK is impacted by various pressures from drivers of human activities, all of which are reflected in the QSR thematic assessment. Some of the key drivers for the UK are society’s need for food, energy and to adapt to and mitigate the effects of climate change.
The key activities that exert pressure on marine bird biodiversity in the UK are:
- Fisheries activities (Figure 2)
- Increased offshore renewable energy activities
- Aggregate extraction activities
- Coastal squeeze through coastal/flood defence support
These activities can lead to pressures such as, but not limited to:
- Increased disturbance
- Depleted prey sources
- Increased risk direct mortality
This assessment does not consider new or emerging pressures such as Highly Pathogenic Avian Influenza (HPAI), which had a devastating impact on marine bird species in the UK in 2022 and 2023. At some gannet colonies initial estimates suggest between 25% and 50% reduction in breeding abundance.

Figure 2. Fisheries activities can exert both direct and indirect pressures on marine bird abundance. Photo of common guillemot (Uria aalge) (Photo credit Justin Hart).
Impact of pressure on ecosystem services
Decline in marine bird biodiversity from increasing pressures can have adverse effects on various ecosystem services in which they play an important role. The roles marine birds play in these services in the UK are detailed in the 2023 QSR thematic assessment. Of particular concern is their role in regulating and maintaining food webs, as top predators; minimising this function has negative connotations across the wider marine ecosystem, effectively reducing biodiversity at lower levels.
Additionally, marine birds hold great cultural value in the UK. This is reflected in the vast numbers of volunteers involved in survey schemes and members to organisations like the Royal Society for the Protection of Birds (RSPB). They are also linked to positive economic value through ecotourism.
Impacts of climate change on pressures and state
Climate change was identified as one of the top three most important threats to seabirds globally by Dias et al. (2019) and an important driver for change in the UK (Pearce-Higgins et al., 2021; Mitchell et al., 2020) and more widely in the northeast Atlantic (OSPAR, 2023). The main impact of climate change is thought to be reduction in abundance and availability of small shoaling fish (e.g. sandeels, sprat) which are prey to most seabirds. Rising sea temperatures have been linked to declines in breeding success and survival rates of some seabird species. The ways in which climate change is impacting on seabirds and their prey, through changes lower down the food chain, are poorly understood and likely to be complex.
The UK-only-indicator B2 (Kittiwake Breeding Success) uses this negative relationship between kittiwake breeding success and sea temperature to determine if productivity at colonies on the UK North Sea is being affected solely by climate change or by impacts from other anthropogenic activities. The indicator showed that at the majority of colonies, breeding productivity was lower than expected from prevailing sea temperatures.
Climate change can also affect the distribution of some species. The UK-only-indicator on Marine Bird Distribution (B6), showed how species such as spoonbill and little egret, that are more associated with warmer climes, have expanded their distribution in the UK. Conversely, climate change has led to reductions in numbers of other non-breeding waterbird species.
Other direct impacts of climate change may have been evident recently; in 2021 and 2023, when large numbers of auks and shags were washed up dead or dying along the UK coast. Such ‘seabird wrecks’ are thought to be linked to extreme weather (storms and marine heatwaves), which is increasing in frequency or magnitude due to climate change.
Management actions taken
The actions we are taking to achieve GES for marine birds are set out in the UK Marine Strategy Part 3 2025: Programme of Measures. These actions contribute to the wider OSPAR-level strategic response to pressures, and the drivers of activities that lead to these, on marine birds, which are detailed in the 2023 OSPAR thematic assessment. Priority actions are highlighted below:
1. Marine bird conservation is an area of devolved policy. Although the approaches to marine bird conservation are being developed separately by England, Scotland, Wales and Northern Ireland, they aim to improve the outlook of the seabird community across the UK and beyond. These pathways are being developed through identifying pressures affecting seabirds and seeking stakeholders’ views on options for seabird conservation measures. In England, Defra is planning the next steps to work closely with stakeholders to seek their views on the recommended actions in the English Seabird Conservations and Recovery Pathway (ESCaRP) technical report, published by Natural England in 2024. A key challenge is to develop implementation options that prioritise the most urgent recommendations.
2. Bycatch Mitigation Initiative: Published in 2022, the initiative outlines how the UK aims to minimise and where possible eliminate the bycatch of sensitive marine species. This includes improving our evidence base for seabird bycatch, identifying hotspots and the reasons behind these as well as developing toolkits to support the industry in reducing seabird bycatch in UK fisheries.
3. Fisheries management: The kittiwake breeding success indicator highlights some of the historical management strategies that have taken place to minimise the pressure on seabirds from fishing of forage fish. A ban on sandeel fisheries in English waters of the North Sea was introduced in March 2024. The Scottish Government enacted the Sandeel (Prohibition of Fishing) (Scotland) Order 2024 in March 2024, which prohibits fishing for sandeels in Scottish waters and applies to all fishing boats. Licensing requirements and evaluation of fisheries activities through Habitats Regulations Appraisals (HRAs) are needed in both Scotland and Wales.
4. UK Biosecurity plans on important seabird islands: See B4 (Invasive mammal indicator) for more information.
5. Localised conservation initiatives: Bird Aware Solent, Roseate Tern LIFE, LIFE on the Edge and LIFE Raft project are but a few examples of the smaller scale initiatives that have taken place or have just started in the UK, to help manage marine bird conservation.
Next steps
Evidence challenges
-
We have a UK-wide initiative to develop conservation actions for marine birds. Each devolved administration is at a different stage with their respective policies for these.
-
We recognise the need to establish a suitable framework that enables us to monitor and assess the success of these and other measures and their implementation, alongside the strategic objectives set out in the North-East Atlantic Environment Strategy 2030 (NEAES).
Other significant challenges include:
-
Establishing a detailed picture of the extent of the impacts caused by single-point events, such as outbreaks of Highly Pathogenic Avian Influenza (HPAI) in 2021-2023, and the auk and shag wrecks in 2021 and 2023.
Operational objectives
We will contribute to the further development of the assessment of bird populations and identify the most important pressures at a regional level through OSPAR, as well as continue to support the strategic objectives set out by the 2023 QSR thematic assessment. We will continue to enhance and protect marine birds through:
-
Effective management at protected sites.
-
Increasing our understanding of climate impacts at a regional level to better enable assessments to account for these. Thus, allowing for more conclusive results on the potential impacts of additional human activities.
-
Further reducing the risks to island seabird colonies from invasive mammalian predators by evolving the invasive mammal indicator to assess effectiveness of biosecurity measures now adopted and expanding to other protected sites such as Sites of Special Scientific Interest (SSSIs).
-
Developing tools, such as an indicator, to assess the effectiveness of the Bycatch Mitigation Initiative for marine birds in the UK.
-
Improving our understanding of distributional change in marine birds through the inclusion of breeding seabird data and preferably offshore distribution data into the assessment.
-
Improving the depth and breadth of marine bird monitoring across the UK.
-
Increasing our understanding of the impacts of offshore marine renewable developments on marine birds and how they could best be mitigated or compensated for.
We will also look to further develop our understanding of the individual and cumulative impacts of human activities on marine birds in the UK. The outbreak of Highly Pathogenic Avian Influenza (HPAI) in our wild marine birds in 2021-23, will have unknown consequences on their populations and demographics in the coming years, it will be key to try and gain an understanding of these to ensure they are accounted for or properly addressed for the next assessment cycle. Similarly, with the unpredictable events, like those seen in the auk and shag wrecks in 2021 and 2023, understanding how these may influence the assessments in the future should be considered. Furthermore, investigating the frequency of these random events for all species included in these assessments will help to inform the assessments further.
Technical Detail: Good Environmental Status for the next cycle
Table 9. shows the overarching targets (characteristics) for GES, along with their criteria, individual GES targets and associated indicators for the next assessment cycle (subject to change following the UK Marine Strategy Part 1 public consultation).
Table 9. GES criteria and targets for next assessment cycle.
|
Overarching target |
|||
|
The abundance and demography of marine bird species indicate healthy populations that are not significantly affected by human activities. |
|||
|
Criteria |
2024-2030 GES targets |
Comment |
Indicators to be used |
|
Bycatch mortality |
The long-term viability of marine bird populations is not threatened by deaths caused by incidental bycatch in mobile and static fishing gear. |
No change |
|
|
Population abundance and distribution |
The population size of marine bird species has not declined substantially since 1992 as a result of human activities. |
No change |
|
|
Population demographic characteristics |
Widespread lack of breeding success in marine birds caused by human activities should occur in no more than three years in six. |
No change |
|
|
Distributional range |
There is no significant change or reduction in population distribution of marine birds caused by human activities. |
No change |
|
References
Dias, M.P., Martin, R., Pearmain, E.J., Burfield, I.J., Small, C., Phillips, R.A., Yates, O., Lascelles, B., Borborogly, P.B. and Croxall, J.P. (2019). Threats to seabirds: A global assessment. Biological Conservation 237: 525-537.
Mitchell, I., Daunt, F., Frederiksen, M. and Wade, K. (2020). Impacts of climate change on seabirds, relevant to the coastal and marine environment around the UK. MCCIP Science Review 2020 382–399.
OSPAR (2023). Marine Birds Thematic Assessment. In: OSPAR, 2023: Quality Status Report 2023. OSPAR Commission, London. Available at: https://oap.ospar.org/en/ospar-assessments/quality-status-reports/qsr-2023/thematic-assessments/marine-birds/
Pearce-Higgins, J.W., Davies, J.G. and Humphreys, E.M. (2021). Species and habitat climate change adaptation options for seabirds within the INTERREG VA area. Report to Agri-Food and Biosciences Institute and Marine Scotland Science as part of the Marine Protected Area Management and Monitoring (MarPAMM) project.
Contributors
Daisy Burnell, Bryony Baker
Acknowledgements: Matthew Murphy, Emma Philip, Richard Berridge, Justin Hart and Claire Macnamara.