
Status and trends of polychlorinated biphenyls in sediments
Since 2012, polychlorinated biphenyls concentrations in sediments are broadly similar and generally achieve the target described in the UK Marine Strategy Part One (HM Government, 2012). 92% of assessments in the Greater North Sea and 87% of assessments in the Celtic Seas have met the associated UK target. However, the most toxic dioxin-like compound (CB118) still exceeds target threshold levels in the Celtic Seas.
Background
UK Target on concentration of contaminants (polychlorinated biphenyls)
This indicator is used to assess progress against the target set out in the Marine Strategy Part One (HM Government, 2012), which requires that concentrations of the substances identified within relevant legislation and international obligations are below the concentrations at which adverse effects are likely to occur. The polychlorinated biphenyls considered are CB28, CB52, CB101, CB118, CB138, CB153, CB180.
Key pressures and impacts
In the UK Initial Assessment (HM Government, 2012) the key pressures associated with this indicator were riverine and direct inputs of legacy polychlorinated biphenyls arising from point and diffuse sources, atmospheric deposition and acute events that have settled in marine sediments. These are still relevant. Remaining sources include electrical and hydraulic equipment containing polychlorinated biphenyls, waste disposal, redistribution of historically contaminated marine sediments and by-products of thermal and chemical industrial processes (Figure 1).

Figure 1. Polychlorinated biphenyls usage in high-voltage transformers. Source: Japan Environmental Storage and Safety Corporation.
Measures taken to address the impacts
There is a robust UK legislative framework in place for controlling and reducing pollution from the main sources of contaminants (energy production, transport, urban and industrial uses), including appropriate consenting regimes and River Basin Management Plans described in the UK Marine Strategy Part Three (HM Government, 2015). However, much of the polychlorinated biphenyls in marine sediments entered the sea before many of the controls were put in place and, due to their persistence, are still present. Removing these sediments from the sea is not a practicable option.
Monitoring, assessment and regional co-operation
Areas that have been assessed
Status and trends assessments were conducted for the UK portion of the Greater North Sea and Celtic Seas Marine Strategy Framework Directive (European Commission, 2008) sub-regions, and where possible at the smaller scale of the UK biogeographic marine regions set out in Charting Progress 2 (UKMMAS, 2010).
Monitoring and assessment methods
Risk-based monitoring and assessment of the status and trends of polychlorinated biphenyl concentrations in sediments was conducted within the annual UK Clean Seas Environmental Monitoring Programme using methods and principles set out by the OSPAR Co-ordinated Environmental Monitoring Programme. The assessment analysed results of individual monitoring stations and synthesised the results to assess trends on the biogeographic regional level.
Assessment thresholds
Environmental Assessment Criteria were derived by OSPAR for the assessment of polychlorinated biphenyl concentrations in biota. Concentrations below the Environmental Assessment Criteria rarely cause any chronic effects in marine organisms.
OSPAR also has a long term ultimate objective to achieve concentrations of close to zero for man-made substances in the marine environment and whilst not a target described in the UK Marine Strategy Part One (HM Government, 2012), the status and trend results were used to examine progress towards this objective.
Regional co-operation
The UK has been a key player in the development, monitoring and assessment of the OSPAR “Polychlorinated biphenyls in sediment” common indicator. The UK results have been used in the OSPAR Intermediate Assessment (OSPAR Commission, 2017).
Further information
Polychlorinated biphenyls are very stable, which means they do not biodegrade in the environment and humans and animals cannot break them down. Some polychlorinated biphenyls can vaporise and be easily redistributed by air. They accumulate in marine animals with greater concentrations found higher up the food chain. Polychlorinated biphenyl compounds are extremely toxic to animals and humans, causing reproductive and developmental problems, damage to the immune system, interference with hormones and cancer. A sub-group is 'dioxin-like', meaning they are more toxic than other polychlorinated biphenyl compounds. Seven specific compounds (CB28, CB52, CB101, CB118, CB138, CB153, CB180) were recommended for monitoring by the European Union Community Bureau of Reference (European Commission, 2001). These were selected as indicators of wider polychlorinated biphenyl contamination due to their relatively high concentrations and toxic effects. The monitoring data are used to investigate trends in polychlorinated biphenyl concentrations and to compare concentrations particularly against the OSPAR Environmental Assessment Criteria. The Environmental Assessment Criteria values were set so that concentrations below the criteria should not cause chronic effects in sensitive marine species and present no significant risk to the environment.
Polychlorinated biphenyls (Figure 2) are industrial compounds, with multiple industrial and commercial uses. It has been estimated that globally 1.3 million tonnes of polychlorinated biphenyl compounds have been produced (Breivik and others, 2007). They have been used as coolants and lubricants in transformers, capacitors, and other electrical equipment and have also been used as plasticizers and sealing agents in products such as rubber and especially in polyvinyl chloride plastics used to coat electrical wiring, adhesives, paints, and inks. Although the usage of polychlorinated biphenyls was generally banned over 30 years ago, they still exist in old electrical equipment and environmental media to which humans can be exposed. They are expected to be present in electronic waste streams from which they can leach into the environment (Menad and others, 1998). Human populations are exposed mainly via food which is mostly from contaminated animal fats. Indoor air can also contribute to human exposure. Worldwide monitoring programs have shown that polychlorinated biphenyls are present in most samples of human milk (Pietrzak-Fiecko and others, 2005).

Figure 2. Polychlorinated biphenyls. (Source: Wikimedia Commons)
Polychlorinated biphenyls do not burn easily, are good insulators and very resistant (Bergman and others, 2012). These properties contribute greatly to polychlorinated biphenyls having become environmental contaminants which are regulated by the Stockholm Convention of Persistent Organic Pollutants adopted to European Union legislation in Regulation (EC) No 850/2004 (European Commission, 2004). The chemical inertness and heat stability properties that make polychlorinated biphenyls desirable for industry also protect them from destruction when the products in which they are used are discarded. These same properties enable residues to persist in the environment for long periods of time and to be transported worldwide when contaminated particulate matter travels through waters, precipitation, wind, and other physical forces (Jaward and others, 2004; Eckhardt and others, 2007; Gioia and others, 2008).
All polychlorinated biphenyls can induce formation of reactive oxygen species, genotoxic effects, immune suppression, an inflammatory response, and endocrine effects to various extents and through different pathways (Sepulveda and others, 2010; Lauby-Secretan and others 2013). Of the 209 polychlorinated biphenyl congeners, the most toxic are the so-called ‘dioxin-like’ polychlorinated biphenyls: the four non-ortho (CB77, 81, 126 and 169) and eight mono-ortho (CB105, 114, 118, 123, 156, 157, 167 and 189).
Due to their persistence, potential to bioaccumulate and toxicity they have been included on the OSPAR List of Chemicals for Priority Action (OSPAR Commission, 2004). OSPAR Commission (2004) presented a monitoring strategy for polychlorinated biphenyls for which contracting parties should continue to measure polychlorinated biphenyls under the OSPAR Coordinated Environmental Monitoring Programme on a mandatory basis in biota (fish and mussels) and sediments for temporal trends and spatial distribution, covering congeners 28, 52, 101, 118, 138, 153 and 180. Marine sediments, in particular those with a high organic carbon content, may accumulate hydrophobic compounds like polychlorinated biphenyls to considerably higher levels than those of the surrounding waters. The sampling strategy is defined by the purpose of the monitoring programme and the natural conditions of the region to be monitored. Typically, sampling approaches include fixed-station sampling, stratified random sampling, or stratified fixed sampling. Muddy sediments, such as those containing a high proportion of fine material, are preferable for organic contaminant monitoring, although sieving of sediments may be an alternative (OSPAR Commission, 2002).
Assessment method
This 2016 assessment of data from the Clean Seas Environment Monitoring Programme describes the trends and status of contaminant concentrations in sediment at monitoring stations around the UK. Assessments are made for many time series, each of a single contaminant at a single monitoring station. This section describes how the results of the individual time series are synthesised to assess status and trends at the biogeographic regional level. Specifically, it considers polychlorinated biphenyl concentrations in sediments. The polychlorinated biphenyl congeners assessed here were (with chemical abstracts service numbers provided in brackets): CB28 (CAS Nr. 7012-37-5), CB52 (CAS Nr. 35693-99-3), CB10 (CAS Nr. 37680-73-2), CB118 (CAS Nr. 31508-00-6), CB138 (CAS Nr. 35065-28-2), CB153 (CAS Nr. 35065-27-1) and CB180 (CAS Nr. 35065-29-3).
The regional assessment only considers coastal and offshore sampling stations and excludes estuarine stations. The results are therefore based on the monitoring data collected within the waters assessed under the Marine Strategy Framework Directive (European Commission, 2008) and are used as part of the UK’s assessment of Contaminants.
The monitoring stations where there are suitable data are shown in Figure 3, with the purple circles showing stations where there is trend and status information for at least one polychlorinated biphenyl compound, and the blue circles showing stations where there is only status information. The areas delineated by the thinner black lines are the biogeographic regions; those delineated by the thicker black lines are the Marine Strategy Framework Directive sub-regions. The number of time series in each biogeographic region is given in Tables 1 and 2.
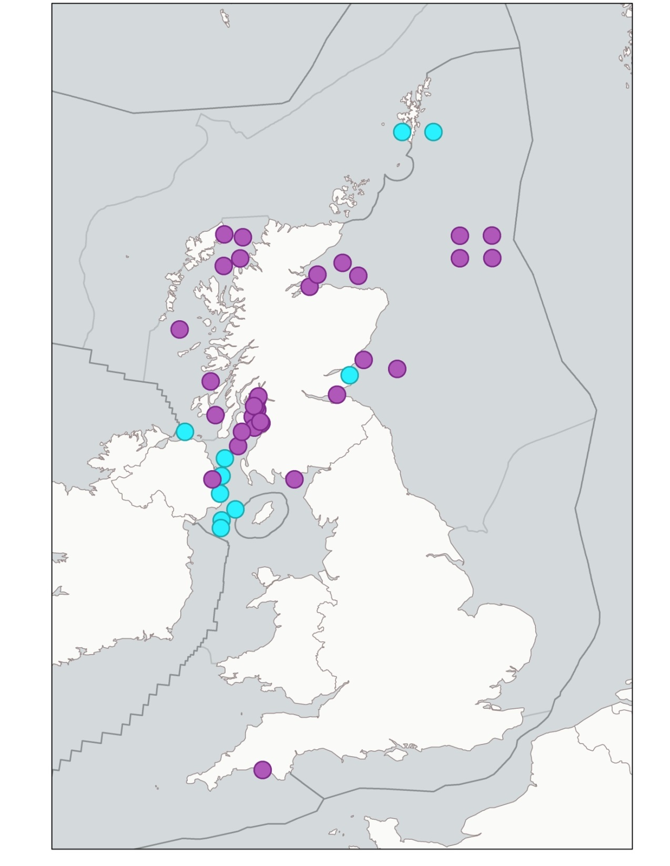
Figure 3. Trend and status (purple circles) and status only (blue circles) monitoring stations used to assess polychlorinated biphenyls concentrations in sediments.
Table 1. Number of stations used in the UK polychlorinated biphenyls in sediment trend assessment, by Marine Strategy Framework Directive sub-region.
|
Sub-region |
Biogeographic region |
CB28 |
CB52 |
CB101 |
CB118 |
CB138 |
CB153 |
CB180 |
Total |
|
Greater North Sea |
Northern North Sea |
2 |
6 |
7 |
7 |
8 |
9 |
6 |
45 |
|
Total |
2 |
6 |
7 |
7 |
8 |
9 |
6 |
45 |
|
|
Celtic Seas
|
Minches & W Scotland |
2 |
4 |
4 |
6 |
6 |
7 |
3 |
32 |
|
Irish Sea |
12 |
11 |
13 |
13 |
13 |
13 |
10 |
85 |
|
|
W Channel & Celtic Sea |
1 |
0 |
1 |
1 |
1 |
1 |
1 |
6 |
|
|
Total |
15 |
15 |
18 |
20 |
20 |
21 |
14 |
123 |
Table 2. Number of stations used in the UK polychlorinated biphenyls in sediment trend assessment, by Marine Strategy Framework Directive sub-region.
|
Sub -region |
Biogeographic region |
CB28 |
CB52 |
CB101 |
CB118 |
CB138 |
CB153 |
CB180 |
total |
|
Greater North Sea |
Northern North Sea |
13 |
13 |
13 |
13 |
13 |
13 |
13 |
91 |
|
Total |
13 |
13 |
13 |
13 |
13 |
13 |
13 |
91 |
|
|
Celtic Seas |
Scottish Continental Shelf |
1 |
1 |
1 |
1 |
1 |
1 |
1 |
7 |
|
Minches & W Scotland |
8 |
7 |
8 |
8 |
8 |
8 |
8 |
55 |
|
|
Irish Sea |
19 |
18 |
18 |
19 |
19 |
18 |
17 |
128 |
|
|
W Channel & Celtic Sea |
1 |
1 |
1 |
1 |
1 |
1 |
1 |
7 |
|
|
Total |
29 |
27 |
28 |
29 |
29 |
28 |
27 |
197 |
Areas that have been assessed
Status and trends assessments were conducted for the UK-portion of the Greater North Sea and Celtic Seas Marine Strategy Framework Directive (European Commission, 2008) sub-regions, and at the smaller scale of the 8 UK biogeographic marine regions set out in Charting Progress 2 (UKMMASS, 2010).
Monitoring and assessment methods
Polychlorinated biphenyls were monitored in sediments. Samples were taken in annual monitoring surveys based on the sampling frequencies specified in the OSPAR Joint Assessment and Monitoring Programme guideline. Sampling and chemical analysis methodologies met the relevant OSPAR requirements. Statistical assessments of status and trends were also based on OSPAR methodologies.
An individual time series of polychlorinated biphenyl concentrations is assessed for status if:
- there is at least one year with data in the period 2010 to 2015
- there are at least three years of data over the whole-time series
- a parametric model can be fitted to the data and used to estimate the mean concentration in the final monitoring year (or, occasionally, if a non-parametric test of status is applied).
The time series is also assessed for trends if, in addition:
- there are at least five years of data over the whole-time series
- a parametric model can be fitted to the data and used to estimate the trend in mean concentrations.
Information on how the individual time series are assessed for status and trends is available from the British Oceanographic Data Centre.
For the regional assessment, the results from the individual time series are combined and a summary measure of status or trend is obtained from each time series. These are then modelled, using a linear mixed model, to estimate the mean status, or the mean trend in each biogeographic region. Only biogeographic regions with at least 3 monitoring stations with good geographic spread are considered in the regional assessment. Full details of the methodology is available from the British Oceanographic Data Centre.
Assessment thresholds
Two assessment criteria are used to assess polychlorinated biphenyl concentrations in sediments (Table 3):
- Background Assessment Concentrations were developed by OSPAR for testing whether concentrations are close to zero for man-made substances. Mean concentrations significantly below the Background Assessment Concentrations are said to be close to zero.
- Environmental Assessment Criteria were developed by OSPAR and ICES for assessing the ecological significance of sediment and biota concentrations. The Environmental Assessment Criteria values were set so that hazardous substance concentrations in sediment and biota below the criteria should not cause chronic effects in sensitive marine species, including the most sensitive species, nor should concentrations present an unacceptable risk to the environment and its living resources. However, the risk of secondary poisoning is not always considered. Environmental Assessment Criteria continue to be developed for use in data assessments.
Table 3. Background Assessment Criteria and Environmental Assessment Criteria for polychlorinated biphenyls in sediment. Concentrations are expressed as μg kg-1 dw (dry weight) of sediment; Background Assessment Concentrations are normalised to 2.5% organic carbon.
|
Background Assessment Concentration (μg kg-1 dw) |
Environmental Assessment Criteria (μg kg-1 dw) |
|
|
CB28 |
0.22 |
1.7 |
|
CB52 |
0.12 |
2.7 |
|
CB101 |
0.14 |
3.0 |
|
CB118 |
0.17 |
0.6 |
|
CB138 |
0.15 |
7.9 |
|
CB153 |
0.19 |
40 |
|
CB180 |
0.10 |
12 |
Results
Findings in the 2012 UK Initial Assessment
A number of samples exceeded the thresholds and these were local in nature and close to the sources, particularly in industrialised estuaries and coasts (HM Government, 2012).
Latest findings
Of the 168 trend assessments carried out in the Celtic Seas and Greater North Sea for polychlorinated biphenyls, 11 (7%) showed a significant upward trend, while 46 (27%) showed a significant downward trend. Of the 288 status assessments carried out, 255 (89%) were below the Environmental Assessment Criteria.
Status assessment
The mean concentrations across the monitoring stations used were below the Environmental Assessment Criteria values for polychlorinated biphenyls in the Greater North Sea, the Celtic Seas and the three sampled biogeographic regions. In the Greater North Sea, 92% of the 91 status assessments were below the Environmental Assessment Criteria and met the UK threshold target. In the Celtic Seas, 87% of the 197 status assessments were below the Environmental Assessment Criteria and met the UK threshold target. Figure 4 gives an overview of the different polychlorinated biphenyl congener assessments failing the Environmental Assessment Criteria in the different biogeographic regions. CB118 was the only one that failed in one out of three sampled biogeographic regions.
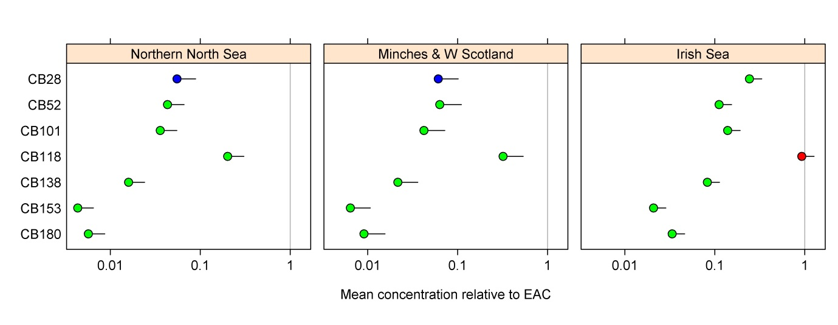
Figure 4. Status assessment: average polychlorinated biphenyl concentration in sediment in each biogeographic region, relative to Environmental Assessment Criteria (EAC) by compound (with 95% confidence limits). A value of 1 indicates the average concentration is equal to the Environmental Assessment Criteria. Blue: statistically significantly below the Background Assessment Concentration; green: statistically significantly below the Environmental Assessment Criteria: red: the estimate of the mean concentration is not significantly below the Environmental Assessment Criteria.
Trend assessment
In the Greater North Sea none of the 45 assessments show an upward trend, 62% of the assessments show no trend and 38% show a downward trend. In the Celtic Seas, out of 123 trend assessments, 9% show an upward trend, 67% show no trend and 24% show a downward trend. One (Northern North Sea) in three sampled biogeographic regions showed significant downward trends, taking the mean of all polychlorinated biphenyl congeners into consideration. Individual polychlorinated biphenyl congeners trends for each region can be seen in Figure 5.
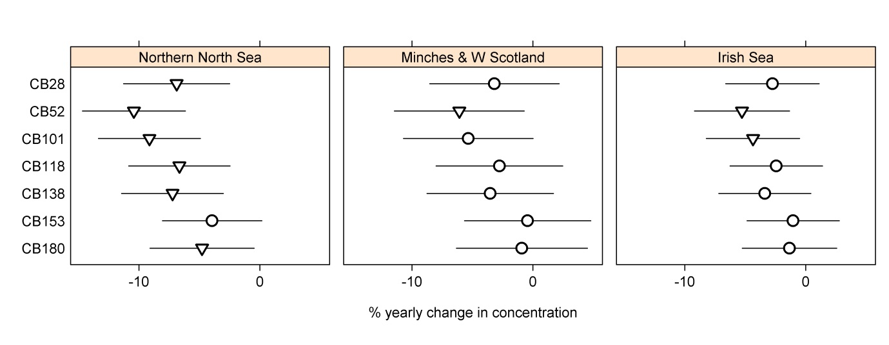
Figure 5. Trend assessment: average annual trends in polychlorinated biphenyl concentrations in sediment by biogeographic region (with 95% confidence limits). Upward trends (upwards triangle), downward trends (downwards triangle), no change (circle).
Further information
Trends in polychlorinated biphenyl concentrations were assessed in UK regions where there were at least 5 years of data, each containing at least one measurement above the detection limit. Three of the UK biogeographic regions had enough stations to undertake a regional trend assessment, one in the Greater North Sea (Northern North Sea) and two in the Celtic Seas (Minches & W Scotland, Irish Sea). Overall polychlorinated biphenyl trend by region and trend by individual compounds can be found in Figures 6 and 7. Concentrations in sediment were decreasing in only one region (Northern North Sea), with an average percentage annual decrease of around 6% and remained stable in the two other regions (Minches & Western Scotland and the Irish Sea) (Figure 6). The percentage yearly change for each polychlorinated biphenyl in each region is shown in Figure 7.
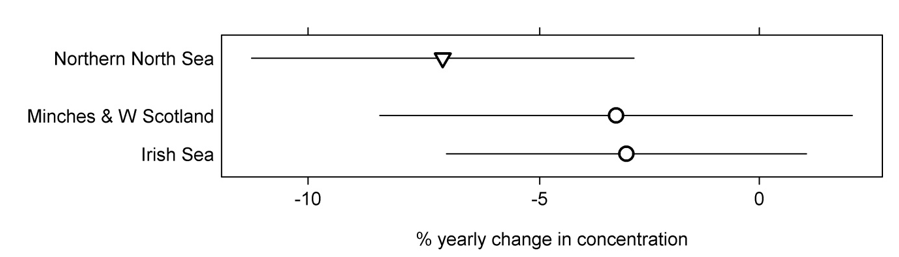
Figure 6. Trend assessment: average annual trends in polychlorinated biphenyl concentrations in sediment by biogeographic region (with 95% confidence limits). Upward trends (upwards triangle), downward trends (downwards triangle), no change (circle).
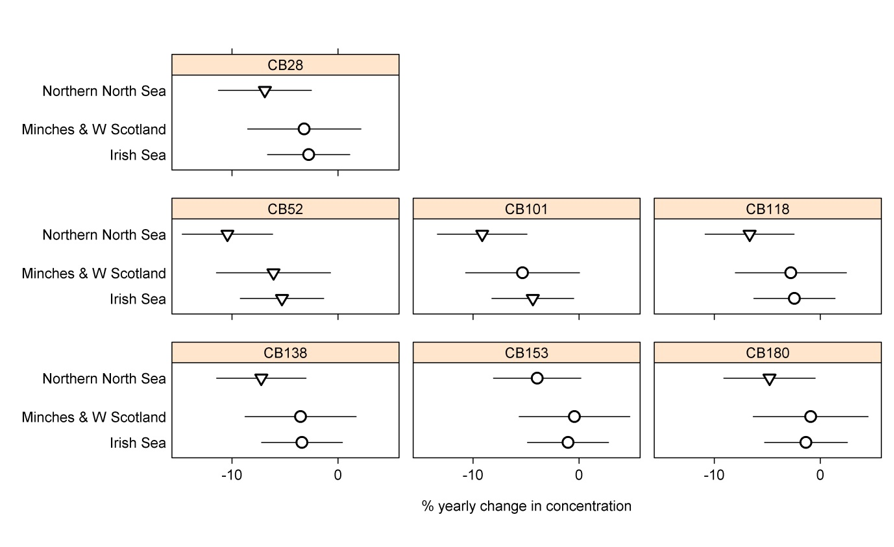
Figure 7. Trend assessment: average annual trends in individual polychlorinated biphenyl concentrations in sediment by biogeographic region (with 95% confidence limits). Upward trends (upwards triangle), downward trends (downwards triangle), no change (circle).
Polychlorinated biphenyl concentrations were compared to the OSPAR Background Assessment Concentrations and Environmental Assessment Criteria. Three of the UK biogeographic regions had enough stations to undertake a regional status assessment, one in the Greater North Sea (Northern North Sea) and two in the Celtic Seas (Minches & W Scotland, Irish Sea). More data are available for polychlorinated biphenyls in sediment, but this data was from estuarine stations and therefore excluded from the assessment.
Mean regional polychlorinated biphenyl concentrations relative to the Background Assessment Concentrations are shown in Figure 8, all regions were classed as being above background for polychlorinated biphenyls in sediment. Concentrations were lowest in the Northern North Sea and the Minches and West Scotland region in comparison to the Irish Sea. However, individual concentrations were above Background Assessment Concentrations in all regions, except for CB28 which was below Background Assessment Concentration in the Northern North Sea and the Minches and West Scotland region (Figure 9).
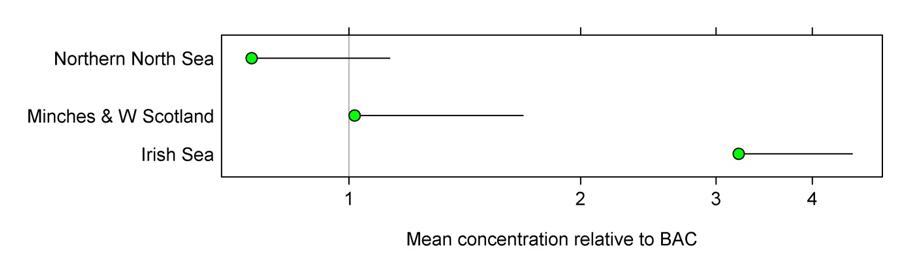
Figure 8. Status assessment: average polychlorinated biphenyl concentration in sediment in each biogeographic region, relative to the Background Assessment Concentration (with 95% confidence limits). A value of 1 indicates the average concentration is equal to the Background Assessment Concentration (BAC). Blue: statistically significantly below the Background Assessment Concentration; green: statistically significantly below the Environmental Assessment Criteria; red: the estimate of the mean concentration is not significantly below the Environmental Assessment Criteria.
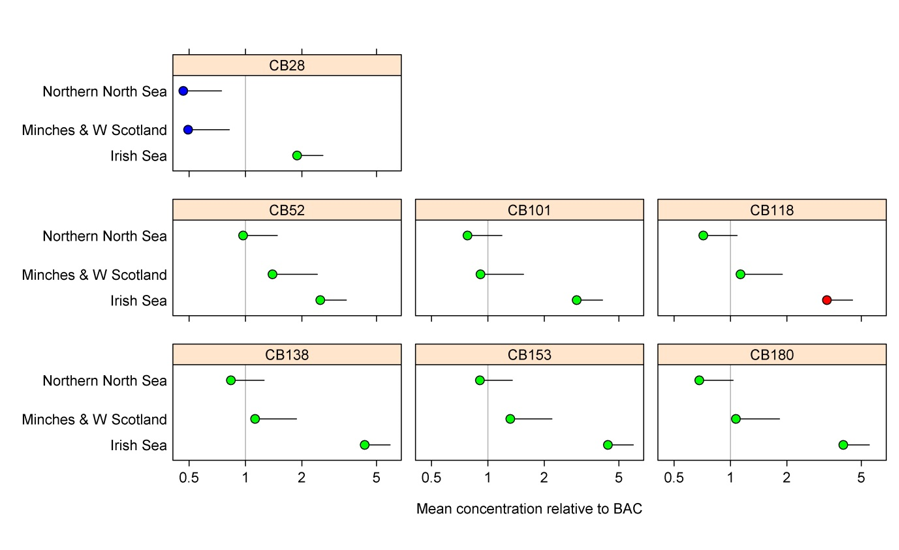
Figure 9. Status assessment: average polychlorinated biphenyl concentration in sediment in each biogeographic region, relative to the Background Assessment Concentration by compound (with 95% confidence limits). A value of 1 indicates the average concentration is equal to the Background Assessment Concentration. Blue: statistically significantly below the Background Assessment Concentration; green: significantly below the Environmental Assessment Criteria; red: the estimate of the mean concentration is not significantly below the Environmental Assessment Criteria.
Mean regional polychlorinated biphenyl concentrations relative to the Environmental Assessment Criteria for each region are shown in Figures 10 and 11 In the Greater North Sea, 8% of the 91 status assessments were above the Environmental Assessment Criteria. Concentrations were below the Environmental Assessment Criteria for all polychlorinated biphenyls in all regions, except for CB118 in the Irish Sea, potentially resulting in adverse effects. In the Celtic Seas, 13% of the 197 status assessments were above the Environmental Assessment Criteria. Mean concentrations in the final year of available data (variable by station) is given in Figure 12.
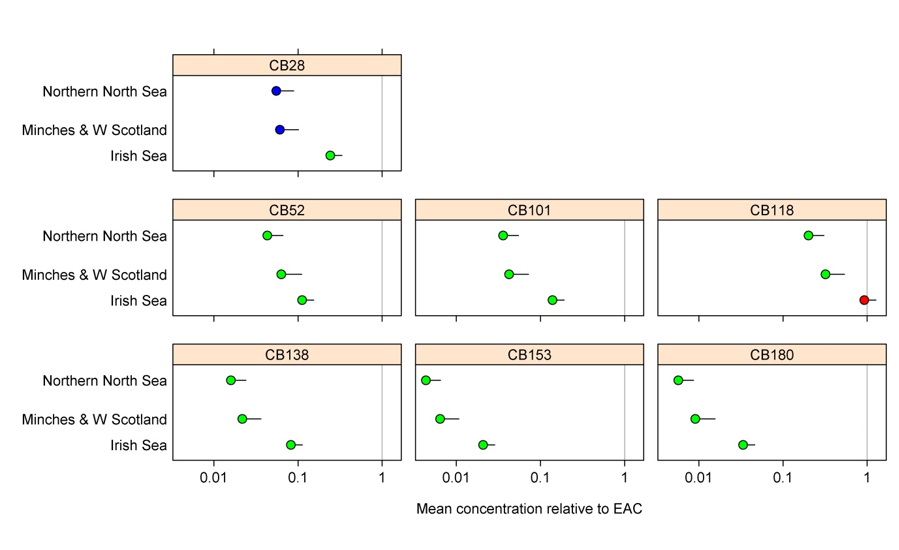
Figure 10. Status assessment: average polychlorinated biphenyl concentration in sediment in each biogeographic region, relative to Environmental Assessment Criteria by compound (with 95% confidence limits). A value of 1 indicates the average concentration is equal to the Environmental Assessment Concentrations. Blue: statistically significantly below the Background Assessment Concentration; green: statistically significantly below the Environmental Assessment Criteria; red: the estimate of the mean concentration is not significantly below the Environmental Assessment Criteria.
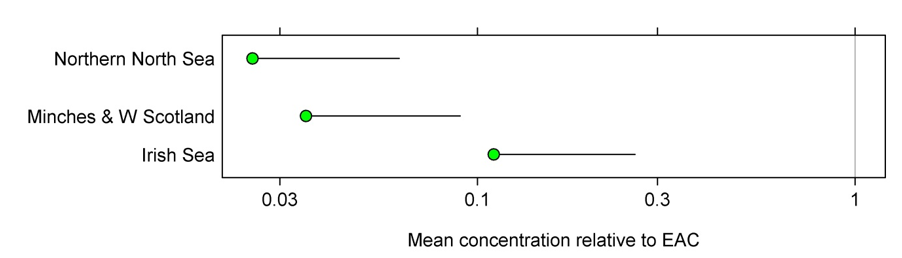
Figure 11. Status assessment; average polychlorinated biphenyl concentration in sediment in each biogeographic region, relative to Environmental Assessment Criteria (with 95% confidence limits). A value of 1 indicates the average concentration is equal to the Environmental Assessment Criteria. Blue: statistically significantly below the Background Assessment Concentration; green: statistically significantly below the Environmental Assessment Criteria; red: the estimate of the mean concentration is not significantly below the Environmental Assessment Criteria.
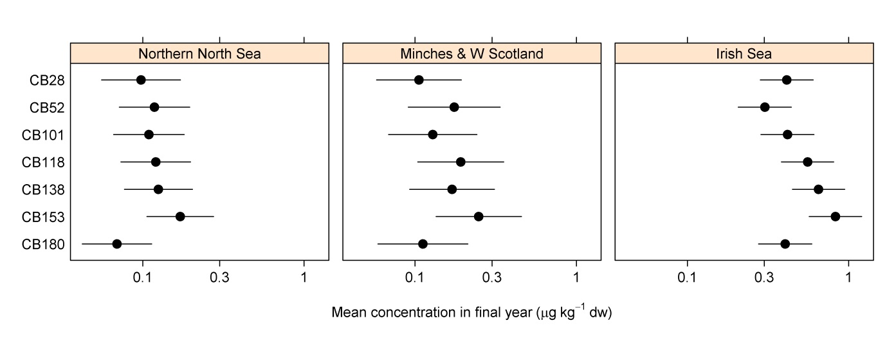
Figure 12. Average polychlorinated biphenyl concentration in sediment in each biogeographic region in the final year of available data, which varied based on station.
Conclusions
Since the UK Initial Assessment (HM Government, 2012) concentrations of polychlorinated biphenyls in sediments have not changed overall for both the Greater North Sea and the Celtic Seas. A very high percentage of stations met the UK target for this indicator. The exception is one of the most toxic polychlorinated biphenyls (CB118), which is above the environmental assessment criterion in one (Irish Sea) of the three assessed biogeographic regions, and therefore adverse effects on marine organisms may still be possible in this region.
Further information
Additional information can be found in the following publications, as well as sources cited throughout the text:
- Gioia and others, 2011: Evidence for major emissions of PCBs in the West African region.
- Gioia and others, 2013: Polychlorinated biphenyls (PCBs) in Africa: a review of environmental levels.
Knowledge gaps
There is a lack of monitoring data, particularly in the Southern North Sea, Channel and South West of England. Due to the persistence of polychlorinated biphenyls, it will take several more decades before concentrations fall below Background Assessment Concentrations. As a result, monitoring could continue for years and a risk-based approach should be applied to reduce associated costs.
Further research is required to define diffuse inputs from terrestrial sources. Applying a modelling approach could improve understanding of atmospheric transport from remaining sources.
References
Bergman A, Rydén A, Law RJ, de Boer J, Covaci A, Alaee M, Birnbaum L, Petreas M, Rose M, Sakai S, den Eede NV, van der Veen I (2012) ‘A novel abbreviation standard for organobromine, organochlorine, and organophosphorus flame retardants and some characteristics of the chemicals’ Environment International, volume: 49, pages: 57–82 (viewed on 6 December 2018)
Breivik K, Sweetman A, Pacyna JM and Jones KC (2007) ‘Towards a global historical emission inventory for selected PCB congeners—A mass balance approach 3. An Update’, Science of the Total Environment, volume 377, pages: 296–307 (viewed on 6 December 2018)
Eckhardt S, Breivik K, Mano S, Stohl A (2007) ‘Record high peaks in PCB concentrations in the Arctic atmosphere due to long-range transport of biomass burning emissions’ Atmospheric Chemistry and Physics, volume 7, pages: 4527–4536 (viewed on 6 December 2018)
European Commission (2001) ‘Communication from the Commission to the Council, the European Parliament and the Economic and Social Committee Community - Strategy for Dioxins, Furans and Polychlorinated Biphenyls’ COM/2001/0593 final, Official Journal of the European Union C 322, 17.11.2001, pages 2–18, (viewed on 6 December 2018)
European Commission (2004) ‘Regulation (EC) No 850/2004 of the European Parliament and of the Council of 29 April 2004 on persistent organic pollutants and amending Directive 79/117/EEC’ Official Journal of the European Union L158/7, pages 7 – 47 (viewed on 28 November 2018)
European Commission, (2008), ‘Directive 2008/56/EC of the European Parliament and of the Council of 17 June 2008 establishing a framework for community action in the field of marine environmental policy (Marine Strategy Framework Directive)’ Official Journal of the European Union L 164, 25.6.2008, pages 19-40 (viewed on 16 November 2018)
Gioia R, Nizzetto L, Lohmann R, Dachs J, Jones KC (2008) ‘Polychlorinated biphenyls (PCBs) in air and seawater of the Atlantic Ocean: sources, trends and processes’ Environmental Science and Technology, Volume 42, pages:1416–1422 (viewed on 16 November 2018)
Gioia R, Eckhardt S, Breivik K, Jaward FM, Prieto A, Nizzetto L, Jones KC (2011)’ Evidence for major emissions of PCBs in the West African region’ Environmental Science and Technology 45: 1349–1355 (viewed on 6 December 2018)
Gioia R, Akindele AJ, Adebusoye SA, Asante KA, Tanabe S, Buekens A, Sasco AJ (2013) ‘Polychlorinated biphenyls (PCBs) in Africa: a review of environmental levels’ Environmental Science and Pollution Research, volume 21(10), pages: 6278-89 (viewed on 6 December 2018)
HM Government (2012) ‘Marine Strategy Part One: UK Initial Assessment and Good Environmental Status’ (viewed on 5 July 2018)
HM Government (2015) ‘Marine Strategy Part Three: UK Programme of Measures’ December 2015. (viewed on 5 July 2018)
Jaward FM, Barber JL, Booij K, Dachs J, Lohmann R, Jones KC (2004) ‘Evidence for dynamic air-water coupling and cycling of persistent organic pollutants over open Atlantic Ocean’ Environmental Science and Technology, volume: 38, pages: 2617–2625 (viewed on 6 December 2018)
Lauby-Secretan B, Loomis D, Grosse Y, El Ghissassi F, Bouvard V, Benbrahim-Tallaa L, Guha N, Baan R, Mattock H, Straif K (2013) ‘Carcinogenicity of polychlorinated biphenyls and polybrominated biphenyls’ The Lancet: Oncology, volume:14(4), pages: 287–288 (viewed on 6 December 2018)
Menad N, Björkman B, Allain EG (1998) ‘Combustion of plastics contained in electric and electronic scrap.’ Resources, Conservation and Recycling, volume 24, pages: 65–85 (viewed on 6 December 2018)
OSPAR Commission (2002) ‘CEMP Guidelines for Monitoring Contaminants in Sediments’ Ospar Agreement 2002-16 (viewed on 29 November 2018)
OSPAR Commission (2004) ‘Polychlorinated Biphenyls (PCBs)’ Hazardous Substances Series. Originally published 2001, updated 2004 (viewed on 29 November 2018)
OSPAR Commission (2017) ‘Intermediate Assessment 2017’ (viewed on 16 November 2018)
Pietrzak-Fiecko R, Smoczynska K, Smoczynski SS (2005) ‘Polychlorinated biphenyls in human milk, UHT cow's milk, and infant formulas’ Polish Journal of Environmental Studies 14(2): 237–241 (viewed on 29 November 2018)
Sepulveda A, Schluep M, Renaud FG, Streicher M, Kuehr R, Hageluken C, Gerecke AC (2010) ‘A review of the environmental fate and effects of hazardous substances released from electrical and electronic equipments during recycling: examples from China and India’ Environmental Impact Assessment Review 30(1): 28-41 (viewed on 29 November 2018)
UKMMAS (2010) 'Charting Progress 2: An assessment of the state of the UK seas' Published by Defra on behalf of the UK Marine Monitoring and Assessment Strategy community (viewed on 4 January 2019)
Acknowledgements
Assessment metadata
| Assessment Type | UK Marine Strategy Framework Directive Indicator Assessment |
|---|---|
D8 | |
D8.1 Concentration of Contaminants | |
Marine Strategy Part One | |
| Point of contact email | marinestrategy@defra.gov.uk |
| Metadata date | Monday, October 1, 2018 |
| Title | Contaminant and biological effect data to support MSFD Descriptor 8 1999-2015 by CSEMP Region |
| Resource abstract | The results of the individual time series at coastal and offshore stations were synthesised to assess status and trends at the biogeographic regional level and formed the basis of eleven of the indicator assessments that comprised the UK's 2018 MSFD assessment of Descriptor 8. |
| Linkage | In addition to links provided in ‘References’ section above:OSPAR Commission (2005) ‘2005 Assessment of data collected under the Co-ordinated Environmental Monitoring Programme (CEMP)’ Publication Number 235 (viewed on 10 January 2019) OSPAR Commission (2006) ‘2005/2006 CEMP Assessment: Trends and concentrations of selected hazardous substances in the marine environment’ Publication Number 288 (viewed on 10 January 2019) OSPAR Commission (2007) ‘2006/2007 CEMP Assessment: Trends and concentrations of selected hazardous substances in the marine environment’ Publication Number 330 (viewed on 10 January 2019) OSPAR Commission (2008) ‘CEMP Assessment Manual: Co-ordinated Environmental Monitoring Programme Assessment Manual for contaminants in sediment and biota’ Publication Number 379 (viewed on 10 January 2019) OSPAR Commission (2009) ‘CEMP assessment report: 2008/2009 Assessment of trends and concentrations of selected hazardous substances in sediments and biota’ Publication Number 390 (viewed on 10 January 2019) OSPAR Commission (2009) ‘Agreement on CEMP Assessment Criteria for the QSR 2010' Agreement 2009-2 (viewed on 10 January 2019) OSPAR Commission (2016) 'OSPAR Coordinated Environmental Monitoring Programme’ Agreement 2016-1 (viewed on 10 January 2019) |
| Conditions applying to access and use | © Crown copyright, licenced under the Open Government Licence (OGL). |
| Assessment Lineage | The 2016 assessment of the UK's Clean Seas Environment Monitoring Programme described the status and trends of contaminant concentrations and biological effects measurements in biota and sediment at monitoring stations in waters around the UK. Assessments were made for a large number of time series, typically each of a single contaminant in a single species (for biota) at a single monitoring station. The results of the individual time series at coastal and offshore stations were synthesised to assess status and trends at the biogeographic regional level and formed the basis of this indicator. Data were submitted to the MERMAN database from relevant Competent Monitoring Authorities. A series of templates were populated by submitting officers and submitted to the database which has in-built data restrictions and a data filter to ensure high quality, accurate data are submitted. The data filter has formulae in-built which use Accredited Quality Control information from known standards, limits, standard deviations and/or inter laboratory calibration exercises to calculate a score. Only data that passed a threshold agreed with the national advisory bodies were used for assessments. The data for 1999 - 2015 were extracted from MERMAN. Further data checks were made and records with obvious errors were deleted or corrected. The data were standardised to agreed units and bases. The data were grouped into time series of a single contaminant in a single species at a single monitoring station. Time series with no data for the period 2010 - 2015 were excluded. The individual time series were assessed for both trends and status. The methods behind the assessments and the individual time series results are available from the British Oceanographic Data Centre. The results of the individual time series at coastal and offshore stations were then synthesised to assess status and trends at the biogeographic regional level. The methods and results are available from the British Oceanographic Data Centre. |
| Dataset metadata | https://portal.medin.org.uk/portal/start.php#details?tpc=012_Marine_Scotland_FishDAC_12111 |
| Dataset DOI |
The Metadata are “data about the content, quality, condition, and other characteristics of data” (FGDC Content Standard for Digital Geospatial Metadata Workbook, Ver 2.0, May 1, 2000).
Metadata definitions
Assessment Lineage - description of data sets and method used to obtain the results of the assessment
Dataset – The datasets included in the assessment should be accessible, and reflect the exact copies or versions of the data used in the assessment. This means that if extracts from existing data were modified, filtered, or otherwise altered, then the modified data should be separately accessible, and described by metadata (acknowledging the originators of the raw data).
Dataset metadata – information on the data sources and characteristics of data sets used in the assessment (MEDIN and INSPIRE compliance).
Digital Object Identifier (DOI) – a persistent identifier to provide a link to a dataset (or other resource) on digital networks. Please note that persistent identifiers can be created/minted, even if a dataset is not directly available online.
Indicator assessment metadata – data and information about the content, quality, condition, and other characteristics of an indicator assessment.
MEDIN discovery metadata - a list of standardized information that accompanies a marine dataset and allows other people to find out what the dataset contains, where it was collected and how they can get hold of it.
Recommended reference for this indicator assessment
Thomas Maes1, Lynda Webster2, E. E. Manuel Nicolaus1 and Rob Fryer2 2018. Trends and status of Polychlorinated biphenyls in UK sediments. UK Marine Online Assessment Tool, available at: https://moat.cefas.co.uk/pressures-from-human-activities/contaminants/pcbs-in-sediment/
1Centre for Environment, Fisheries and Aquaculture Science
2Marine Scotland