
Status and trend of cadmium, lead and mercury in sediments
Concentrations of cadmium, lead and mercury in sediment are broadly similar to those in reported in 2012 and remain below the target described in the UK Marine Strategy Part One (HM Government, 2012). The target has not been met for both UK sub-regions: 70% of assessments in the Greater North Sea and 64% of assessments in the Celtic Seas met the UK threshold.
Background
UK target on metal (cadmium, lead and mercury) contamination in UK sediments
This indicator is used to assess progress against the target set out in the Marine Strategy Part One (HM Government, 2012), which requires that concentrations of substances identified within relevant legislation and international obligations are below levels at which adverse effects are likely to occur to sea life. In this case, the proxy Environmental Assessment Criteria agreed by OSPAR (OSPAR Commission, 2017) were used as the assessment values.
Concentrations of metals (cadmium, lead and mercury) in sediments annually collected from marine and coastal waters (Figure 1) are monitored and assessed following a risk based approach according to the OSPAR’s Joint Assessment and Monitoring Programme.
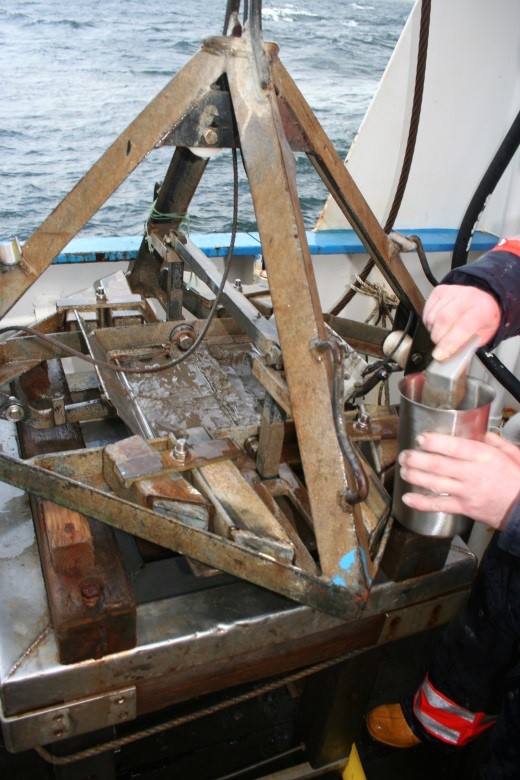
Figure 1. Sediment being collected from day grab for metal analyses.
Key pressures and impacts
In the UK Initial Assessment (HM Government, 2012) the key pressures associated with this indicator were the riverine and direct inputs of legacy metals arising from point and diffuse sources, atmospheric deposition and acute events that have entered marine sediments. These are still relevant.
Measures taken to address the impacts
There is a robust UK legislative framework in place for controlling and reducing pollution from contaminants, including appropriate consenting and monitoring programmes, which is described in the UK Marine Strategy Part Three (HM Government, 2015). However, much of the cadmium, mercury and lead in marine sediments entered the sea before many of the controls were put in place and, due to their persistence, are still present. Removing these sediments from the sea is not considered to be a practicable option.
Monitoring, assessment and regional co-operation
Areas that have been assessed
Status and trends assessments were conducted for the UK portion of the Greater North Sea and Celtic Seas Marine Strategy Framework Directive (European Commission, 2008) sub-regions, and at the smaller scale of the 8 UK biogeographic marine regions set out in Charting Progress 2 (UKMMAS, 2010).
Monitoring and assessment methods
Risk-based monitoring and assessment of the status and trends of metal concentrations in sediments was conducted within the annual UK Clean Seas Environmental Monitoring Programme using methods and principles set out by the OSPAR Coordinated Environmental Monitoring Programme. The assessment analysed results of individual monitoring stations and also synthesised these results to assess trends on the biogeographic regional level.
Assessment thresholds
The status assessments were based on comparisons of mean concentrations to specified Environmental Criteria used by OSPAR. These use the Effects Range-Low assessment criteria, which are used for assessing the ecological significance of sediment concentrations. Concentrations below the Effects Range-Low values rarely cause adverse effects in marine organisms. Effects Range-Low assessment criteria were developed for the United States Environmental Protection Agency. OSPAR also has an aspirational ultimate objective to achieve close to background levels of effect and has developed Background Assessment Concentrations for metals in sediments. Whilst not a target described in the UK Marine Strategy Part One, this assessment also examines progress towards this objective.
Regional co-operation
The UK has been played an important role in the development, monitoring and assessment of the OSPAR “metals in sediment” common indicator. The UK results have been used in the OSPAR Intermediate Assessment (OSPAR Commission, 2017).
Further information
Near shore and coastal waters are seen as some of the most productive marine ecosystems in the world and crucial to the life history and development of many aquatic organisms (Chapman and Wang, 2001; Dauvin, 2008). These important ecosystems are susceptible to pollution from anthropogenic input via direct (such as long sea wastewater treatment work outfalls, coastal industrial discharges, offshore industries, marine traffic, mariculture) and indirect sources (coastal run-off, rivers, atmospheric deposition). Organisms living and reproducing in or near these environments (Lee and others, 2006; Martin and others, 2009), are exposed to a range of pressures including concentrations of metals that have the potential to affect sensitive species at both the individual and population level (Beyer and others, 2014; Jepson and others, 2016). Metals are released into the marine environment from both anthropogenic and natural inputs and are strongly affiliated with particulate matter (Zhang and others, 2007). Sediment bound contamination has been shown to affect the water quality and resulting impacts have been documented in a range of marine invertebrate and vertebrate species (Besselink and others, 1997; Leung and others, 2005; Damiano and others 2011).
In the UK Initial Assessment (HM Government, 2012), based on the Charting Progress 2 (UKMMAS, 2010), the main anthropogenic pressures responsible for the presence of contaminants in the sea were identified as being point sources such as industrial and sewage discharges and emissions, and diffuse sources, such as agriculture, roads and households, and deposition from the atmosphere.
Within the UK, the Clean Seas Environment Monitoring Programme is one way in which our national and international commitments to monitor marine sediments in near shore and offshore marine waters are met (Nicolaus and others, 2015). The main drivers for the current programme are OSPAR Co-ordinated Environmental Monitoring Programme (OSPAR Commission, 2008) and the Joint Assessment and Monitoring Programme (OSPAR Commission, 2014) and the European Union Marine Strategy Framework Directive (European Commission, 2008).
The UK monitors the concentrations of a number of metallic elements in marine sediments, including the priority substances mercury, cadmium and lead. Arsenic, chromium, copper, nickel and zinc are also monitored, but not assessed as priority substances. All of these metals are naturally occurring in the environment. The environmental behaviour of trace metals is complex, being driven by the combination of each element’s chemical properties and environmental physico-chemical conditions (including pH, redox conditions and salinity).
The principle sources of mercury to the environment are fossil fuel combustion, non-ferrous mining, wastewaters, the chloralkali industry and volcanic emissions. Mercury accumulates in sediments where microbial activity converts it into the highly toxic methylmercury. Methylmercury is also highly bioaccumulative and biomagnifies such that it can reach harmful concentrations in top-predators.
The principle sources of cadmium to the environment are volcanic activity, non-ferrous metal mining and smelting, batteries and phosphate-containing fertilisers. In the environment, cadmium behaves similarly to the essential nutrient phosphate and can be actively taken up by algae and animals in parallel with phosphate. Cadmium tends to accumulate in the food chain but does not biomagnify.
Sources of lead to the environment include non-ferrous metal mining and smelting, batteries and shooting/fishing. Environmental lead is mainly particle bound and whilst it can be concentrated from the water column by organisms, it tends not to bioaccumulate and does not biomagnify within the food chain. Lead does, however, produce adverse effects in marine life and is an OSPAR priority hazardous substance.
The UK target is to reduce contaminant concentrations to below those concentrations at which adverse effects are likely to occur (to below Environmental Quality Standards applied within the Water Framework Directive (European Commission, 2000) and Environmental Assessment Criteria applied within OSPAR), whilst having the ultimate aim of reducing to background the concentrations of contaminants that also occur naturally. Specific measures, including a robust legislative framework and appropriate consenting and monitoring programmes, exist to control pollution by contaminants. There is good knowledge of contaminant concentrations in the marine environment, particularly in coastal and inshore areas, as a result of OSPAR programmes and the Water Framework Directive (European Commission, 2000), which require the monitoring of specific contaminants and compliance with specific concentration limits to prevent pollution.
To assess environmental concentrations of contaminants, the UK has been collaborating with OSPAR for many years to develop assessment criteria. Background Assessment Concentrations for metals were derived from deep sediment cores and are normalised to 5 % aluminium in order to allow for variation in lithography (Table 1). Concentrations below the Background Assessment Concentrations are deemed to be naturally occurring and are stated as being close to or below background concentrations.
Table 1. Assessment Criteria used to assess the concentrations of metals in sediments. Concentrations are in milligrams of metal per kilogram of sediment (dry weight). Background Assessment Concentrations are normalised to 5% aluminium.
|
|
Background Assessment Concentration |
Effects Range-Low |
|
Cadmium |
0.31 |
1.2 |
|
Lead |
38 |
47 |
|
Mercury |
0.07 |
0.15 |
Currently OSPAR has not agreed upper limits or Environmental Assessment Criteria for metals in sediments, therefore Effects Range-Low values were used by OSPAR as proxy Environmental Assessment Criteria (Table 1). The US National Oceanic and Atmospheric Administration developed Effects Range values that are intended as informal (non-regulatory) guidelines to aid in ranking areas warranting further investigation as to the actual occurrence of adverse effects such as toxicity (NOAA, 1999). The Effects Range-Low value is defined as the lower tenth percentile of the data set of concentrations in sediments which were associated with biological effects, and adverse effects on organisms are expected to be rarely observed when concentrations fall below this limit. Effects Range-Low values do not represent threshold values below which there will be no impacts from contaminants (O’Connor, 2004), and are expressed without normalisation of concentrations to allow for grainsize or lithographic effects. As OSPAR compares normalised sediment concentrations with Effects Range-Low values, OSPAR assessments are conservative and liable to be more protective than the tenth percentile would otherwise suggest. Therefore, the philosophy between the Effects Range-Low values and OSPAR Environmental Assessment Criteria and Water Framework Directive Environmental Quality Standards are similar, providing a good level of confidence for the assessment of metal levels in sediments.
Assessment method
This assessment of data from the Clean Seas Environment Monitoring Programme describes the trends and status of contaminant concentrations in sediment at monitoring stations around the UK. Assessments are made for many time series, each of a single contaminant at a single monitoring station. This section describes how the results of the individual time series are synthesised to assess status and trends at the biogeographic regional level. Specifically, it considers metal concentrations in sediments, where the metals are cadmium, lead and mercury (with Chemical Abstracts Service numbers: 7440-43-9, 7439-92-1 and 7439-97-6, respectively).
The regional assessment only considers coastal and offshore stations and excludes estuarine stations. The results are, therefore, based on the monitoring data collected within the waters assessed under the Marine Strategy Framework Directive (European Commission, 2008) and are used as part of the UK’s assessment of contaminants.
All monitoring stations where there are suitable data are shown in Figure 2, with the purple circles showing stations where there is trend information for at least one metal, and the blue circles showing stations where there is only status information. The number of time series in each biogeographic region is given in Table 2.
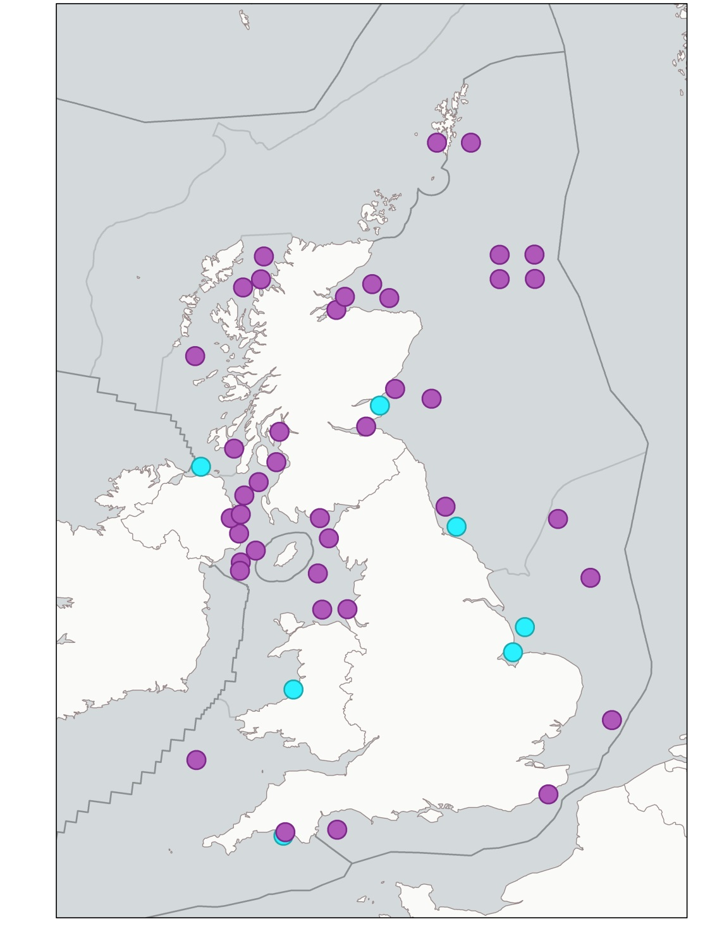
Figure 2. Trend and status (purple) and status only (blue) monitoring stations used to assess metal concentrations in sediment. The areas delineated by the thinner black lines are the biogeographic regions and those delineated by the thicker black lines are the Marine Strategy Framework Directive (European Commission, 2008) sub-regions.
Table 2. Number of time series in each biogeographic region used in the assessment of status and tends.
|
|
|
Status |
Trends |
||||
|
Region |
Sub-region |
Cadmium |
Lead |
Mercury |
Cadmium |
Lead |
Mercury |
|
Greater North Sea |
Northern North Sea |
15 |
15 |
14 |
9 |
13 |
11 |
|
Southern North Sea |
5 |
5 |
3 |
3 |
3 |
2 |
|
|
E Channel |
2 |
2 |
2 |
2 |
2 |
2 |
|
|
Celtic Sea |
Irish Sea |
16 |
16 |
15 |
11 |
15 |
15 |
|
Minches and West Scotland |
6 |
5 |
6 |
4 |
5 |
5 |
|
|
Scottish Continental Shelf |
1 |
1 |
1 |
1 |
1 |
0 |
|
|
W Channel and Celtic Sea |
3 |
3 |
3 |
2 |
2 |
2 |
|
Areas that have been assessed
Status and trends assessments were conducted for the UK portion of the Greater North Sea and Celtic Seas Marine Strategy Framework Directive (European Commission, 2008) sub-regions, and at the smaller scale of the 8 UK biogeographic marine regions set out in Charting Progress 2 (UKMMAS, 2010).
Cadmium, mercury and lead were monitored in muddy sediments. Samples were collected during annual monitoring surveys based on the sampling frequencies specified in the OSPAR Joint Assessment and Monitoring Programme guideline. Generally, it is recommended to carry out sampling on a yearly basis, but some stations are monitored less frequently. Sampling and chemical analysis methodologies met the relevant OSPAR requirements. Statistical assessments of status and trends were also based on OSPAR methodologies.
An individual time series of metal concentrations is assessed for status if:
- there is at least one year with data in the period 2010 to 2015
- there are at least three years of data over the whole time series
- a parametric model can be fitted to the data and used to estimate the mean concentration in the final monitoring year (or, occasionally, if a non-parametric test of status is applied).
The time series is also assessed for trends if, in addition:
- there are at least five years of data over the whole time series
- a parametric model can be fitted to the data and used to estimate the trend in mean concentrations.
Information on how the individual time series are assessed for status and trends is available from the British Oceanographic Data Centre.
For the regional assessment, the results from the individual time series are combined and a summary measure of status or trend is obtained from each time series. These are then modelled, using a linear mixed model, to estimate the mean status, or the mean trend in each biogeographic region. Only biogeographic regions with at least 3 monitoring stations with good geographic spread are considered in the regional assessment. Full details of the methodology is available from the British Oceanographic Data Centre.
Assessment thresholds for concentrations of metals in sediments
Two assessment criteria are used to assess metal concentrations in sediments:
- Background Assessment Concentration: were developed by OSPAR for testing whether concentrations are near background. Mean concentrations significantly below the Background Assessment Concentration are said to be near background,
- Effects Range-Low values: were developed by the US National Oceanic and Atmospheric Administration to aid in ranking areas that warrant further investigation as to the actual occurrence of adverse effects such as toxicity (NOAA, 1999). These values are used by OSPAR in the absence of satisfactory Environmental Assessment Criteria to assess the ecological hazard posed by metals in sediments.
Results
Findings in the 2012 UK Initial Assessment
Metal concentrations in number of sediment samples exceeded their corresponding threshold values. However, these exceedances were local in nature and close to the sources, particularly in industrialised coastal areas (HM Government, 2012).
Latest Findings
Status assessment
Of the 139 status assessments, 93 (44 for cadmium, 22 for lead and 27 for mercury) were below the Effects Range-Low values (Table 3). The mean concentrations across the monitoring stations used failed the proxy Environmental Assessment Criteria (exceeded the Effects Range-Low values) for lead in 3 biogeographic regions (1 in the Greater North Sea and 2 in the Celtic Seas). Neither cadmium nor lead failed any of the regional assessments. For the Greater North Sea, 9% of cadmium, 45% of lead and 37% of mercury (corresponding to 2, 10 and 7 stations, respectively) exceeded the proxy Environmental Assessment Criteria concentrations at the monitoring stations (Figures 3 and 4). For the Celtic Seas, 8% of cadmium, 60% of lead and 40% of mercury (corresponding to 2, 15 and 10 stations, respectively) exceeded the proxy Environmental Assessment Criteria concentrations at the monitoring stations (Figures 3 and 4). The concentrations of cadmium, lead and mercury in sediments were generally above background levels. Overall, there is high confidence in these assessments. However, because we used proxy Environmental Assessment Criteria in the form of Effects Range-Lows values there is less confidence regarding the extent that these limits give a realistic picture of adverse effects on the marine environment.
Table 3. Number of time series with each trend and status by biogeographic region and Marine Strategy Framework Directive (MSFD) sub-region.
|
MSFD sub-region |
biogeographic region |
Status assessment |
Cadmium |
Lead |
Mercury |
total |
Trend assessment |
Cadmium |
Lead |
Mercury |
total |
|
Greater North Sea |
Northern North Sea |
blue |
10 |
11 |
9 |
30 |
upward trend |
0 |
0 |
0 |
0 |
|
green |
5 |
1 |
1 |
7 |
no trend |
8 |
12 |
9 |
29 |
||
|
red |
0 |
3 |
4 |
7 |
downward trend |
1 |
1 |
2 |
4 |
||
|
Southern North Sea |
blue |
0 |
0 |
0 |
0 |
upward trend |
0 |
0 |
0 |
0 |
|
|
green |
3 |
0 |
1 |
4 |
no trend |
3 |
3 |
2 |
8 |
||
|
red |
2 |
5 |
2 |
9 |
downward trend |
0 |
0 |
0 |
0 |
||
|
E Channel |
blue |
0 |
0 |
0 |
0 |
upward trend |
0 |
1 |
0 |
1 |
|
|
green |
2 |
0 |
1 |
3 |
no trend |
2 |
1 |
2 |
5 |
||
|
red |
0 |
2 |
1 |
3 |
downward trend |
0 |
0 |
0 |
0 |
||
|
total |
blue |
10 |
11 |
9 |
30 |
upward trend |
0 |
1 |
0 |
1 |
|
|
green |
10 |
1 |
3 |
14 |
no trend |
13 |
16 |
13 |
42 |
||
|
red |
2 |
10 |
7 |
19 |
downward trend |
1 |
1 |
2 |
4 |
||
|
Scottish Continental Shelf |
blue |
0 |
1 |
1 |
2 |
upward trend |
0 |
0 |
0 |
0 |
|
|
green |
1 |
0 |
0 |
1 |
no trend |
1 |
1 |
0 |
2 |
||
|
red |
0 |
0 |
0 |
0 |
downward trend |
0 |
0 |
0 |
0 |
||
|
Minches & W Scotland |
blue |
5 |
3 |
4 |
12 |
upward trend |
1 |
0 |
0 |
1 |
|
|
green |
0 |
2 |
1 |
3 |
no trend |
3 |
5 |
4 |
12 |
||
|
red |
1 |
0 |
1 |
2 |
downward trend |
0 |
0 |
1 |
1 |
||
|
Celtic Seas |
Irish Sea |
blue |
11 |
3 |
4 |
18 |
upward trend |
0 |
1 |
0 |
1 |
|
green |
4 |
1 |
5 |
10 |
no trend |
10 |
10 |
9 |
29 |
||
|
red |
1 |
12 |
6 |
19 |
downward trend |
1 |
4 |
6 |
11 |
||
|
W Channel & Celtic Sea |
blue |
1 |
0 |
0 |
1 |
upward trend |
0 |
1 |
0 |
1 |
|
|
green |
2 |
0 |
0 |
2 |
no trend |
2 |
1 |
2 |
5 |
||
|
red |
0 |
3 |
3 |
6 |
downward trend |
0 |
0 |
0 |
0 |
||
|
total
|
blue |
17 |
7 |
9 |
33 |
upward trend |
1 |
2 |
0 |
3 |
|
|
green |
7 |
3 |
6 |
16 |
no trend |
16 |
17 |
15 |
48 |
||
|
red |
2 |
15 |
10 |
27 |
downward trend |
1 |
4 |
7 |
12 |
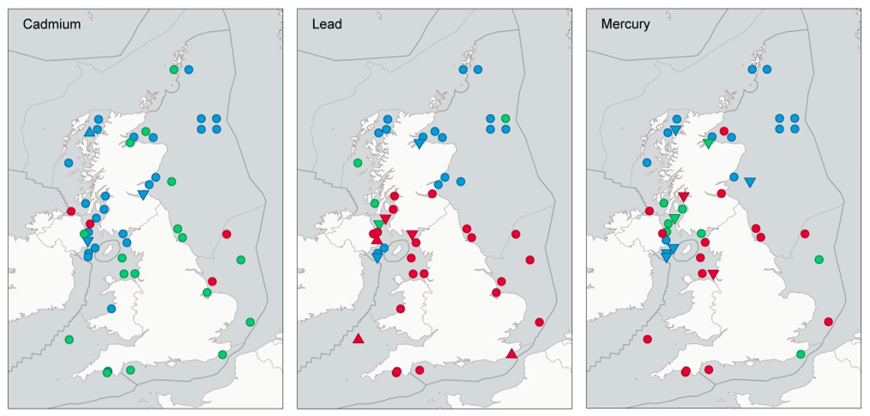
Figure 3. Sampling stations that have passed and failed the relevant proxy Environmental Assessment Criteria (exceeded Effects Range-Low values) for cadmium, lead and mercury. Blue: mean concentration significantly (p < 0.05) below the Background Assessment Concentration; green: mean concentration significantly ( p< 0.05) below the Effects Range-Low value; red: mean concentration not significantly below the Effects Range-Low; downward triangle: mean concentration significantly decreasing (p < 0.05); circle: no significant change in mean concentration (p > 0.05); upward triangle: mean concentration significantly increasing (p < 0.05).
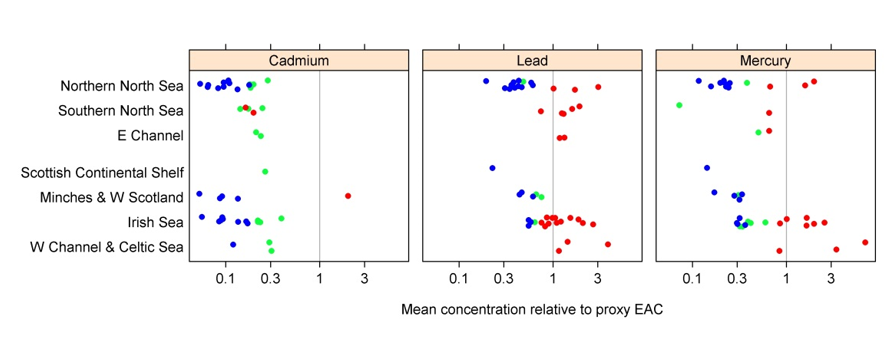
Figure 4. Individual time series proxy Environmental Assessment Criteria (EAC) (Effects Range-Low values) status assessment in 7 of 8 UK biogeographic sub-regions. Blue: mean concentration significantly (p < 0.05) below the Background Assessment Concentration; green: mean concentration significantly ( p< 0.05) below the Effects Range-Low value; red: mean concentration not significantly below the Effects Range-Low; downward triangle: mean concentration significantly decreasing (p < 0.05); circle: no significant change in mean concentration (p > 0.05); upward triangle: mean concentration significantly increasing (p < 0.05).
Trend assessment
Of the 110 trend assessments in the Celtic Seas and Greater North Sea for cadmium, lead and mercury, 4 (4%) showed a significant upward trend and 16 (15%) showed a significant downward trend (Table 3). Overall, most regions show a stable situation, with no significant downward trends for cadmium or lead in any of the sampled biogeographic regions, while mercury showed significant decreases in all 3 sampled biogeographic regions (Northern North Sea, Minches and West Scotland, and the Irish Sea).
Further information
The regional trend assessment shows that mercury has decreased significantly in the Northern North Sea, Minches and West Scotland, and in the Irish Sea (Figure 5). No trend assessments could be carried out at the other 5 biogeographic regions around the UK due to a lack of data. The 4 biogeographic regions analysed for cadmium and lead stayed static. Although on average, no trends were observed within specific regions, 4 individual time series (1 for cadmium and 3 for lead) showed significant upward trends (Table 4).
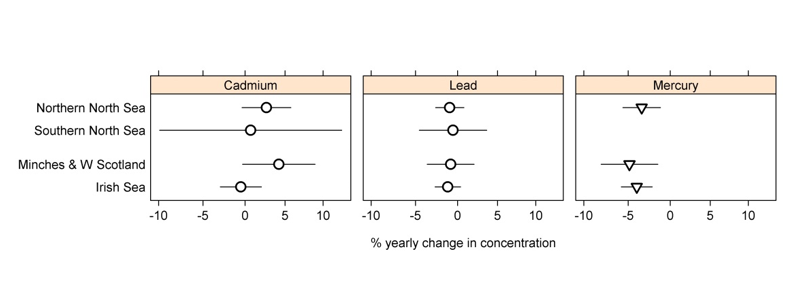
Figure 5. Trends in the 4 UK biogeographic sub-regions for which sufficient data are available to assess. Most sub-regions show static trends (circles), only mercury in the Northern North Sea, the Minches and West Scotland and the Irish Sea shows decreasing trends (downward triangle).
Table 4. Stations where a significant upward trend was observed
|
Determinant |
Station |
Marine Strategy Framework Directive region |
Biogeographic region |
|
Lead |
EastChan_ECInterE_se02 |
Greater North Sea |
E Channel |
|
Lead |
IrishSea_StrangfordLoughS_se01 |
Celtic Seas |
Irish Sea |
|
Cadmium |
MinchMalin_TheMinchSouth_se01 |
Celtic Seas |
Minches & W Scotland |
|
Lead |
Severn_SeOpenSeaW_se01 |
Celtic Seas |
W Channel & Celtic Sea |
The status assessment shows, that in total, 19 out of 63 assessments were above the mean concentrations of the proxy Environmental Assessment Criteria (Effects Range-Low values) concentrations for cadmium, lead and mercury in the Greater North Sea. For the Celtic Seas, this was the case for 27 out of 76 assessments (Table 3). For the Greater North Sea, 2 stations for cadmium, 10 for lead and 7 for mercury exceeded the proxy Environmental Assessment Criteria. For the Celtic Seas, 2 stations for cadmium, 15 for lead and 10 for mercury exceeded the proxy Environmental Assessment Criteria (Table 3). Table 5 gives an overview of the individual stations failing the proxy Environmental Assessment Criteria (42 of 46 assessments are shown as 4 were assessed with a low power non-parametric test and are not included in the overview). All the lead and mercury assessments failed in the Western Channel and Celtic Sea area. Failures for lead was also observed at all sampled sites in the Southern North Sea and Eastern Channel (Figure 6). On a positive note, all assessments in the Scottish Continental Shelf were below the Effects Range-Low values for cadmium and below the Background Assessment Concentration for lead and mercury. The concentrations of cadmium, lead and mercury in sediments were generally above background levels.
Table 5. Individual stations exceeding upper metals assessment criteria (Effects Range-Low values) in sediments; with exceedances for individual metals marked by ‘X’.
|
Station |
Marine Strategy Framework Directive region |
Biogeographic region |
Cadmium |
Lead |
Mercury |
|
Firth_of_Forth_(inner)_seSF |
Greater North Sea |
Northern North Sea |
X |
X |
|
|
TyneTees_TTInter_se01 |
Greater North Sea |
Northern North Sea |
X |
X |
|
|
TyneTees_TTInter_se02 |
Greater North Sea |
Northern North Sea |
X |
X |
|
|
HumWash_HWInter_se01 |
Greater North Sea |
Southern North Sea |
X |
X |
|
|
HumWash_HWOpenSeaNE_se01 |
Greater North Sea |
Southern North Sea |
X |
X |
X |
|
HumWash_HWOpenSeaS_se01 |
Greater North Sea |
Southern North Sea |
X |
||
|
HumWash_Owash_se01 |
Greater North Sea |
Southern North Sea |
X |
||
|
Anglia_AnOpenSea_se02 |
Greater North Sea |
Southern North Sea |
X |
||
|
EastChan_ECInterE_se02 |
Greater North Sea |
E Channel |
X |
||
|
EastChan_ECInterW_se02 |
Greater North Sea |
E Channel |
|
X |
X |
|
WestChan_Plymco_se01 |
Celtic Seas |
W Channel & Celtic Sea |
X |
X |
|
|
WestChan_PlymOuter_se04 |
Celtic Seas |
W Channel & Celtic Sea |
X |
X |
|
|
Severn_SeOpenSeaW_se01 |
Celtic Seas |
W Channel & Celtic Sea |
X |
X |
|
|
CardBay_CBInter_se01 |
Celtic Seas |
Irish Sea |
X |
||
|
IrishSea_Cumbria_se01 |
Celtic Seas |
Irish Sea |
X |
X |
|
|
IrishSea_IrSIntermediateE_se01 |
Celtic Seas |
Irish Sea |
X |
X |
|
|
IrishSea_IrSOpenSea_se04 |
Celtic Seas |
Irish Sea |
X |
X |
|
|
IrishSea_LiverpoolBay_se02 |
Celtic Seas |
Irish Sea |
X |
X |
|
|
IrishSea_BelfastLoughInnr_se01 |
Celtic Seas |
Irish Sea |
X |
X |
|
|
IrishSea_BelfastLoughOutr_se01 |
Celtic Seas |
Irish Sea |
X |
||
|
IrishSea_StrangfordLoughS_se01 |
Celtic Seas |
Irish Sea |
X |
||
|
Solway_Firth_seSF |
Celtic Seas |
Irish Sea |
X |
||
|
Firth_of_Clyde_(inner)_seSF |
Celtic Seas |
Irish Sea |
X |
X |
|
|
Firth_of_Clyde_(middle)_seSF |
Celtic Seas |
Irish Sea |
X |
||
|
Firth_of_Clyde_(outer)_seSF |
Celtic Seas |
Irish Sea |
X |
||
|
MinchMalin_MMSIntermediat_se01 |
Celtic Seas |
Minches & W Scotland |
X |
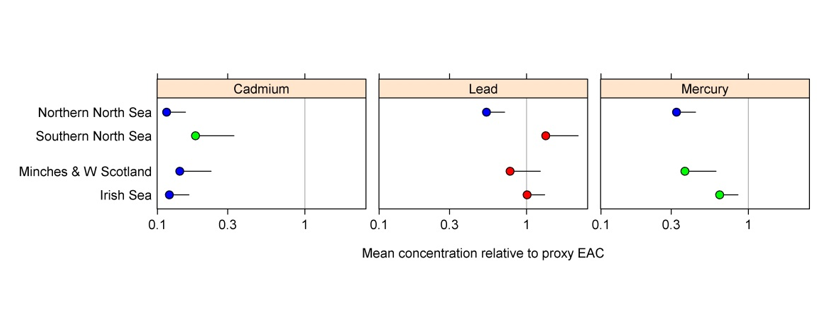
Figure 6. Mean concentrations of cadmium, lead and mercury relative to Effects Range-Low concentration. Blue: mean concentration significantly (p < 0.05) below the Background Assessment Concentration; green: mean concentration significantly (p < 0.05) below the Effects Range-Low value; red: mean concentration not significantly below the Effects Range-Low value.
Conclusions
Since the Initial Assessment (HM Government, 2012) the concentrations of metal contaminations in UK sediments have not changed overall. The highest metal concentrations are generally in the Southern North Sea and Irish Sea, and the lowest concentrations in the Northern North Sea and Minches and West Scotland.
Overall, the lead and mercury assessments do not show that concentrations are below levels that cause harm and therefore the target for this indicator has not been met. There is, however, low confidence in this assessment due to limited data availability, the limited geographic coverage of sampling, and the use of proxy upper-level assessment criteria.
Further information
Concentrations of cadmium, lead and mercury are stable or declining at most sampling stations.
Cadmium concentrations are above harmful concentrations at only 4 out of 48 sites, compared to 25 out of 47 for lead and 17 out of 44 for mercury. Similarly, for cadmium, only one station in Minches and West Scotland showed a significant upward trend. The target described in the Marine Strategy Part One (HM Government, 2012) was met for cadmium in both the Celtic Seas and the Greater North Sea.
The possibility of adverse effects occurring because of the lead concentrations in sediments cannot be discounted for 3 of the 4 assessed UK regions and the target described in Marine Strategy Part One (HM Government, 2012) has, therefore, not been met for lead.
Mercury concentrations are generally decreasing and 3 UK regions already meet the target described in the Marine Strategy Part One (HM Government, 2012). However, mercury concentrations may remain higher than are acceptable in some regions and there is insufficient data to demonstrate that the target is being met more widely.
Mercury concentrations are below the Effects Range-Low and are decreasing in the 3 regions for which sufficient data is available to allow a robust assessment to be conducted (in the Northern North Sea (which is already at background), the Minches and West Scotland, and the Irish Sea). This decrease likely reflects increased controls on mercury emissions from industry that have resulted in a strong decrease in UK emissions to air since 1990 (NIEA, 2016a) and from riverine inputs. Concentrations at a few individual sampling stations exceed the Effects Range-Low values for mercury, particularly in southern areas (such as Southern North Sea, Eastern Channel, the Western Channel and Celtic Sea), although a limited dataset precludes evaluating if these Effects Range-Low value exceedances reflect local issues, or whether the contamination is sufficiently widespread that those UK regions are at significant risk from mercury contamination of sediments. The largest source of mercury to the environment is currently from fossil fuel combustion. With the UK planning to close its remaining coal-fuelled power stations by 2025, the progressive reduction in UK mercury emissions can be expected to continue. Riverine data also show a progressive reduction in UK inputs of mercury to the seas. With no confidence that concentrations of mercury are below Effects Range-Low levels in the Southern North Sea or the Eastern Channel (regions where higher contaminant concentrations are often found) the UK Greater North Sea has not met the target described in the UK Marine Strategy Part One (HM Government, 2012).
The assessment indicates that the possibility of adverse effects occurring because of the lead concentrations in sediments cannot be discounted for 3 of the 4 assessed UK regions and that, therefore, the UK target for lead has not been met for UK waters in either the Celtic Seas or the Greater North Sea. This is despite a 98% reduction in UK lead emissions to air since 1990 (NIEA, 2016b), mostly due to the phase out of leaded petrol, as well as reductions in emissions from industry and coal-fuelled power generation. However, sediment deposition rates and sediment transport dynamics mean that there will be a significant lag period between the introduction of control measures and reductions in surficial sediment concentrations and, therefore, metals-contaminated surficial sediments will remain an environmental hazard into the future.
Due to insufficient data, a robust assessment of the concentrations of metals in sediments could not be obtained for most UK regions. Nonetheless, with lead failing to meet the goal of concentrations below Effects Range-Low levels in 3 out of the 4 UK biogeographic regions and a total of 46 assessments failing the Effects Range-Low for either cadmium, lead or mercury, the target for this indicator has not yet been met. Although confidence in this conclusion is low. Current UK emissions to air and water are decreasing, but the long residence times of contaminated surficial sediments means that significant concentrations of toxic metals will remain in surficial sediments well into the future.
Knowledge gaps
Due to a shortage of data, concentrations of cadmium, lead or mercury could be compared to Background Assessment Concentrations and Effects Range-Lows for only 4 of the 8 UK biogeographic marine regions. Although sampling stations are present in most other regions they are either close to point sources and not believed to be representative of the wider area or had too few data points to allow a regional trend analysis to be conducted. There is a lack of suitable Environmental Assessment Criteria for metals in sediment. Effects Range-Lows values are used, but they are derived for the North American situation and were not developed following European methodology, which reduces the confidence to use them as assessment criteria.
There is a lack of ecotoxicological data for developing new assessment criteria based on the EU Water Framework Directive (European Commission, 2000) or OSPAR Environmental Assessment Criteria (EAC) principles, to replace the current Effects Range-Low (ERL) criteria. There are too few monitoring sites in Arctic Waters for an area assessment to be carried out.
References
Besselink HT, Denison MS, Hahn ME, Vethaak AD, Koeman JH, Brouwer A (1997) ‘High induction of cytochrome P4501A activity without changes in retinoid and thyroid hormone levels in flounder (Platichthys flesus) exposed to 2,3,7,8-tetraachlorodibenzo-p-dioxin’ Environmental Toxicology Chemistry 16: 816-823 (viewed on 30 November 2018)
Beyer J, Peterson K, Song Y, Ruus A, Grung M, Bakke T, Tollefsen KE (2014) ‘Environmental risk assessment of combined effects in aquatic ecotoxicology: a discussion paper’ Marine Environmental Research 96:81-91(viewed on 30 November 2018)
Chapman PM, Wang, F (2001) ‘Assessing sediment contamination in estuaries’ Environmental Toxicology Chemistry 20:3-22 (viewed on 30 November 2018)
Dauvin JC (2008) ‘Effects of heavy metal contamination on the macrobenthic fauna in estuaries: The case of the Seine estuary’ Marine Pollution Bulletin 57:160-169 (viewed on 30 November 2018)
Damiano, S, Papetti P, Menesatti P (2011) ‘Accumulation of heavy metals to assess the health status of swordfish in a comparative analysis of Mediterranean and Atlantic areas’ Marine Pollution Bulletin 62: 1920-1925 (viewed on 30 November 2018)
European Commission (2000) ‘Directive 2000/60/EC of the European Parliament and of the Council establishing a framework for the Community action in the field of water policy’ Official Journal of the European Union L 327, 22.12.2000, pages 1–73 (viewed on 16 November 2018)
European Commission (2008) ‘Directive 2008/56/EC of the European Parliament and of the Council of 17 June 2008 establishing a framework for community action in the field of marine environmental policy (Marine Strategy Framework Directive)’ Official Journal of the European Union L 164, 25.6.2008, pages 19-40 (viewed on 16 November 2018)
HM Government (2012) ‘Marine Strategy Part One: UK Initial Assessment and Good Environmental Status’ (viewed on 5 July 2018)
HM Government (2015) ‘Marine Strategy Part Three: UK Programme of Measures’ December 2015 (viewed on 5 July 2018)
Jepson P, Deaville R, Barber JL, Aguilar A, Borrell A, Murphy S, Barry J, Brownlow A, Barnett J, BerrowS, Cunningham A, Davison N, ten Doeschate M, Esteban R, Ferreira M, Foote AD, Genov T, Gimenez J, Loveridge J, Llavona A, Maxwell DL, Papachlimitzou A, Penrose R, Perkins MW, Smith B, de Stephanis R, Tregenza N, Verborgh P, Fernandez A, Law RJ (2016) ‘PCB pollution continues to impact populations of orcas and other dolphins in European waters’ Scientific Reports 6: 18573. doi: 10.1038/srep18573 (viewed on 30 November 2018)
Lee O, Danilowicz BS, Dickey-Collas M (2006) ‘Temporal and spatial variability in growth and condition of dab (Limanda limanda) and sprat (Sprattus sprattus) larvae in the Irish Sea’ Fisheries Oceanography 15: 490-507 (viewed on 30 November 2018)
Leung KMY, Bjørgesæter A, Gray JS, Li WK, Lui GCS, Wang Y, Lam PKS (2005) ‘Deriving sediment quality guidelines from field-based species sensitivity distributions’ Environmental Toxicology Chemistry 39:5148-5156 (viewed on 30 November 2018)
Martin CS, Carpentier A, Vaz S, Coppin F, Curet L, Dauvin J-C, Delavenne J, Dewarumez J-M, Dupuis L, Engelhard G, Ernande B, Foveau A, Garcia C, Gardel L, Harrop S, Just R, Koubbi P, Lauria V, Meaden GJ, Morin J, Ota Y, Rostiaux E, Smith R, Spilmont N, Vérin Y, Villanueva C, Warembourg C (2009) ‘The Channel habitat atlas for marine resource management (CHARM): an aid for planning and decision-making in an area under strong anthropogenic pressure’ Aquatic Living Resources, 22: 499-508 (viewed on 10 January 2019)
Nicolaus EEM, Law RJ, Wright SR, Lyons BP (2015) 'Spatial and temporal analysis of the risks posed by polycyclic aromatic hydrocarbon, polychlorinated biphenyl and metal contaminants in sediments in UK estuaries and coastal waters’ Marine Pollution Bulletin, 95: 469-479 (viewed on 10 January 2019)
NIEA (2016a) ‘Pollutant information: Mercury' National Atmospheric Emissions Inventory (viewed 2 September 2016)
NIEA (2016b) ‘Pollutant information: Lead' National Atmospheric Emissions Inventory (viewed 2 September 2016)
NOAA (1999) ‘Sediment Quality Guidelines developed for the National Status and Trends Program’ National Oceanic and Atmospheric Administration, US Department of Commerce, United States of America, 12 pages (viewed on 30 November 2018)
O’Connor TP (2004) ‘The sediment quality guideline, ERL, is not a chemical concentration at the threshold of sediment toxicity’ Marine Pollution Bulletin, 49, 383–385 (viewed on 30 November 2018)
OSPAR Commission (2008) ‘Co-ordinated Environmental Monitoring Programme – Assessment manual for contaminants in sediment and biota ISBN 978-1-906840-20-4’ Publication Number Number 379/2008 (viewed on 30 November 2018)
OSPAR Commission (2014) ‘OSPAR Joint Assessment and Monitoring Programme (JAMP) 2014 – 2021’ Ospar Agreement 2014-02 (viewed on 27 November 2018)
UKMMAS (2010) 'Charting Progress 2: An assessment of the state of the UK seas' Published by Defra on behalf of the UK Marine Monitoring and Assessment Strategy community (viewed on 4 January 2018)
Zhang LP, Xin Y, Huan F, Jing YH, Ouyang T, Yu XT (2007) ‘Heavy metal contamination in western Xiamen Bay sediments and its vicinity’ China Marine Pollution Bulletin 54:974–982 (viewed on 30 November 2018)
Acknowledgements
Assessment metadata
| Assessment Type | UK Marine Strategy Framework Directive Indicator Assessment |
|---|---|
D8 | |
D8.2 Effects of Contaminants | |
Marine Strategy Part One | |
| Point of contact email | marinestrategy@defra.gov.uk |
| Metadata date | Saturday, September 1, 2018 |
| Title | Status and trend of cadmium, lead and mercury in sediments |
| Resource abstract | Concentrations of cadmium, lead and mercury in sediment are broadly similar to those in 2012 and remain below the target described in the UK Marine Strategy Part One. |
| Linkage | Please see links provided in ‘References’ section above. |
| Conditions applying to access and use | © Crown 2018 copyright Defra, licenced under the Open Government Licence (OGL). |
| Assessment Lineage | The 2016 assessment of the UK's Clean Seas Environment Monitoring Programme described the status and trends of contaminant concentrations and biological effects measurements in biota and sediment at monitoring stations in waters around the UK. Assessments were made for a large number of time series, typically each of a single contaminant in a single species (for biota) at a single monitoring station. The results of the individual time series at coastal and offshore stations were synthesised to assess status and trends at the biogeographic regional level and formed the basis of this indicator. Data were submitted to the MERMAN database from relevant Competent Monitoring Authorities. A series of templates were populated by submitting officers and submitted to the database which has in-built data restrictions and a data filter to ensure high quality, accurate data are submitted. The data filter has formulae in-built which use Accredited Quality Control information from known standards, limits, standard deviations and/or inter laboratory calibration exercises to calculate a score. Only data that passed a threshold agreed with the national advisory bodies were used for assessments. The data for 1999 - 2015 were extracted from MERMAN. Further data checks were made and records with obvious errors were deleted or corrected. The data were standardised to agreed units and bases and normalised to 5% aluminium. The data were grouped into time series of a single contaminant at a single monitoring station. The results of the individual time series at coastal and offshore stations were then synthesised to assess status and trends at the biogeographic regional level. The methods and results available from the British Oceanographic Data Centre. |
| Dataset metadata | https://portal.medin.org.uk/portal/start.php#details?tpc=012_Marine_Scotland_FishDAC_12111 |
| Dataset DOI |
The Metadata are “data about the content, quality, condition, and other characteristics of data” (FGDC Content Standard for Digital Geospatial Metadata Workbook, Ver 2.0, May 1, 2000).
Metadata definitions
Assessment Lineage - description of data sets and method used to obtain the results of the assessment
Dataset – The datasets included in the assessment should be accessible, and reflect the exact copies or versions of the data used in the assessment. This means that if extracts from existing data were modified, filtered, or otherwise altered, then the modified data should be separately accessible, and described by metadata (acknowledging the originators of the raw data).
Dataset metadata – information on the data sources and characteristics of data sets used in the assessment (MEDIN and INSPIRE compliance).
Digital Object Identifier (DOI) – a persistent identifier to provide a link to a dataset (or other resource) on digital networks. Please note that persistent identifiers can be created/minted, even if a dataset is not directly available online.
Indicator assessment metadata – data and information about the content, quality, condition, and other characteristics of an indicator assessment.
MEDIN discovery metadata - a list of standardized information that accompanies a marine dataset and allows other people to find out what the dataset contains, where it was collected and how they can get hold of it.
Recommended reference for this indicator assessment
E.E. Manuel Nicolaus1, Brett Lyons1, Alison Miles2, Craig D. Robinson3, Lynda Webster3 and Rob Fryer3 2018. Time trend and status for metals (Cadmium, Lead and Mercury) in sediments. UK Marine Online Assessment Tool, available at: https://moat.cefas.co.uk/pressures-from-human-activities/contaminants/metals-in-sediment/
1Centre for Environment, Fisheries and Aquaculture Science.
2Environment Agency
3Marine Scotland