
Status and trend of cadmium, lead and mercury in fish and shellfish
Since 2012, concentrations of cadmium, lead and mercury in biota are broadly stable and generally achieve the target described in the UK Marine Strategy Part One (HM Government, 2012). 96% of assessments at 37 sampling stations monitored in the Greater North Sea, and 99% of assessments at 58 sampling stations monitored in the Celtic Seas met the individual target thresholds.
Background
UK target on metal (cadmium, lead and mercury) concentrations in UK biota
This indicator is used to assess progress against the target set out in the Marine Strategy Part One (HM Government, 2012), which requires that concentrations of substances identified within relevant legislation and international obligations are below levels at which adverse effects are likely to occur to sea life. In this case, proxy Environmental Assessment Criteria agreed by OSPAR (OSPAR Commission, 2017) have been used.
Key pressures and impacts
In the UK Initial Assessment (HM Government, 2012) the key pressures associated with this indicator were riverine and direct inputs of legacy metals arising from point and diffuse sources, atmospheric deposition and acute events that have entered marine sediments which can then accumulate in fish and mussels (biota). These are still relevant.
Measures taken to address the impacts
There is a robust UK legislative framework in place for controlling and reducing pollution from contaminants, including appropriate consenting and monitoring programmes, which is described in the UK Marine Strategy Part Three (HM Government, 2015). However, much of the cadmium, mercury and lead in marine sediments entered the sea before many of the controls were put in place and, due to their persistence, are still present. Removing these sediments from the sea is not considered to be a practicable option.
Monitoring, assessment and regional co-operation
Areas that have been assessed
Status and trends assessments were conducted for the UK portion of the Greater North Sea and Celtic Seas Marine Strategy Framework Directive (European Commission, 2008a) sub-regions, and at the smaller scale of the 8 UK biogeographic marine regions set out in Charting Progress 2 (UKMMAS, 2010).
Monitoring and assessment methods
Risk-based monitoring and assessment of the status and trends of concentrations of metals in fish and mussels was conducted within the annual UK Clean Seas Environmental Monitoring Programme using methods and principles set out by the OSPAR Coordinated Environmental Monitoring Programme. The assessment analysed results of individual monitoring stations and also synthesised these results to assess trends on the biogeographic regional level.
Assessment thresholds
OSPAR Environmental Assessment Criteria (which indicate whether harm is caused to marine life) are not available for this indicator. The concentrations of cadmium, mercury and lead in biota were assessed against OSPAR “proxy Environmental Assessment Criteria” (OSPAR Commission, 2017) based on the food standards for humans set out in Regulation (EC) No 1881/2006 (European Commission, 2006a). However, a failure of the OSPAR Proxy Environmental Assessment Criteria (OSPAR Commission, 2017) does not result in any breach of food standards.
OSPAR also has an aspirational ultimate objective to achieve close to background levels of effect and has developed Background Assessment Concentrations for metals in sediments. Whilst not a target described in the UK Marine Strategy Part One, this assessment also examines progress towards this objective.
Regional co-operation
The UK has been played an important role in the development, monitoring and assessment of the OSPAR “metals in sediment” common indicator. The UK results have been used in the OSPAR Intermediate Assessment (OSPAR Commission, 2017).
Further information
Near shore and coastal waters are seen as some of the most productive marine ecosystems in the world and crucial to the life history and development of many aquatic organisms (Chapman and Wang, 2001; Dauvin, 2008). These important ecosystems are susceptible to pollution from anthropogenic input via direct (such as long sea wastewater treatment work outfalls, coastal industrial discharges, offshore industries, marine traffic, mariculture) and indirect sources (coastal run-off, rivers, atmospheric deposition). Organisms living and reproducing in or near these environments (Lee and others, 2006; Martin and others, 2009), are exposed to a range of pressures including concentrations of metals that have the potential to affect sensitive species at both the individual and population level (Beyer and others, 2014; Jepson and others, 2016). Metals are released into the marine environment from both anthropogenic and natural inputs and are strongly affiliated with particulate matter (Zhang and others, 2007). In the UK Initial Assessment (HM Government, 2012), based on the Charting Progress 2 (UKMMAS, 2010), the main anthropogenic pressures responsible for the presence of contaminants in the sea were identified as being point sources such as industrial and sewage discharges and emissions, and diffuse sources, such as agriculture, roads and households, and deposition from the atmosphere.
Sediment bound contamination has also been shown to affect water quality and resulting impacts have been documented in a range of marine invertebrate and vertebrate species due to bioaccumulation (Besselink and others, 1997; Leung and others, 2005; Damiano and others 2011).
Within the UK, the Clean Seas Environment Monitoring Programme is one way, in which our national and international commitments to monitor marine biota in nearshore and offshore marine waters are met (Nicolaus and others, 2015). The main drivers for the current programme are the OSPAR Co-ordinated Environmental Monitoring Programme and the Joint Assessment and Monitoring Programme (OSPAR Commission, 2008) and the EU Marine Strategy Framework Directive (European Commission, 2008a). Additional programmes include the Water Framework Directive (European Commission, 2000) and the Environmental Quality Standards Directive (European Commission, 2008b).
The UK monitors concentrations of a number of metallic elements in marine organisms, including the priority substances: cadmium, lead and mercury. All of them are naturally occurring in the environment. The environmental behaviour of trace metals is complex and driven by the combination of each element’s chemical properties and environmental physico-chemical conditions (including pH, redox conditions, salinity).
The principle sources of mercury to the environment are fossil fuel combustion, non-ferrous mining wastewaters, the chloralkali industry and volcanic emissions. Mercury accumulates in sediments where microbial activity converts it into the highly toxic methylmercury. Methylmercury is also highly bioaccumulative and biomagnifies such that it can reach harmful concentrations in top-predators.
The principle sources of cadmium to the environment are volcanic activity, non-ferrous metal mining and smelting, batteries, and phosphate-containing fertilisers. In the environment, cadmium behaves similarly to the essential nutrient phosphate and can be actively taken up by algae and animals in parallel with phosphate. Cadmium tends to accumulate in the food chain but does not biomagnify.
Sources of lead to the environment include non-ferrous metal mining and smelting, batteries and shooting/fishing. Environmental lead is mainly particle bound and whilst it can be concentrated from the water column by organisms, it tends not to bioaccumulate and does not biomagnify within the food chain.
Several other metallic elements such as copper and zinc are monitored by the UK. However, these are essential micronutrients, and organisms have good mechanisms for controlling their internal concentrations unless exposed to very high concentrations that are rarely reached in the marine environment.
The UK is committed to reducing contaminant concentrations to below those concentrations at which adverse effects are likely to occur (for example, below Environmental Quality Standards applied within the Water Framework Directive (European Commission, 2000) or Priority Substances Directive 2013/39/EU (European Commission, 2013) and Environmental Assessment Criteria applied within OSPAR). There is an additional aim to reducing contaminants to the background concentrations of contaminants at which they occur naturally. Specific measures, including a robust legislative framework which controls pollution from contaminants like the River Basin Management Plans and appropriate consenting and monitoring programmes has been put in place. There is good knowledge of cadmium, mercury and lead concentrations in the marine environment, particularly in coastal and inshore areas, because of OSPAR and the Water Framework Directive (European Commission, 2000), which require the monitoring of specific contaminants and compliance with specific concentration limits to prevent pollution.
To assess environmental concentrations of contaminants, the UK has been collaborating with OSPAR for many years to develop assessment criteria. OSPAR, for example, developed Background Assessment Concentrations for metals by adding measurement and field variability to low metal levels observed in the OSPAR area. Concentrations less than the Background Assessment Concentrations are deemed to be naturally occurring, stated as close to or below background concentration. Currently, there are no agreed ecotoxicologically-based upper concentration limits (such as OSPAR Environmental Assessment Criteria) for cadmium, mercury and lead. OSPAR, therefore, used the maximum permitted concentrations in the European Commission food standards Regulation (EC) No 1881/2006 (European Commission, 2006b). This sets maximum levels for foodstuffs placed on the market as a temporary proxy Environmental Assessment Criteria in for their Quality Status Report 2010 and Intermediate Assessment (OSPAR Commission, 2017). This regulation includes maximum concentrations for cadmium and lead in bivalve molluscs and for mercury in fish muscle. OSPAR also uses the bivalve mollusc European Commission food standards values when assessing concentrations in fish liver (OSPAR Commission, 2009). In this assessment, the limits in the European Commission Regulation (EC) No 1881/2006 (European Commission, 2006b) were also used as a temporary “proxy” Environmental Assessment Criteria using OSPAR guidelines to carry out a spatial assessment. OSPAR also evaluated the use of the Environmental Quality Standard for mercury in muscle tissue and concluded that: Environmental Quality Standard in biota (for fish 20 µg kg-1 wet weight) is below the Background Assessment Concentration (for fish 35 µg kg-1 wet weight) and therefore not appropriate. Furthermore, the use of a trophic magnification factor and trophic level is not appropriate as it increases the uncertainty on the assessment to an unacceptable level.
It is recognised that using European Commission food limits which are designed to protect humans is not ideal for assessing whether sea life is adversely impacted by cadmium, lead and mercury. Efforts are being made within OSPAR to address this situation.
Assessment method
This assessment of data from the Clean Seas Environment Monitoring Programme describes the trends and status of contaminant concentrations in biota at monitoring stations around the UK. Assessments are made for many time series, each of a single contaminant in a single species at a single monitoring station. This section describes how the results of the individual time series are synthesised to assess status and trends at the biogeographic regional level. Specifically, it considers metal concentrations in biota (Blue mussels sampled in coastal areas; common dab, plaice and flounder sampled in nearshore and open water stations) specifically cadmium, lead and mercury (with Chemical Abstracts Service numbers: 7440-43-9, 7439-92-1 and 7439-97-6, respectively).
The regional assessment only considers coastal and offshore stations and excludes estuarine stations. The results are therefore based on the monitoring data collected within the waters assessed under the Marine Strategy Framework Directive (European Commission, 2008a) and are used as part of the UK’s assessment of contaminants.
All monitoring stations where there are suitable data are shown in Figure 1, with the magenta circles showing stations where there is trend and status information for at least one metal, and the blue circles showing stations where there is only status information. The number of time series in each biogeographic region is given in Table 1.
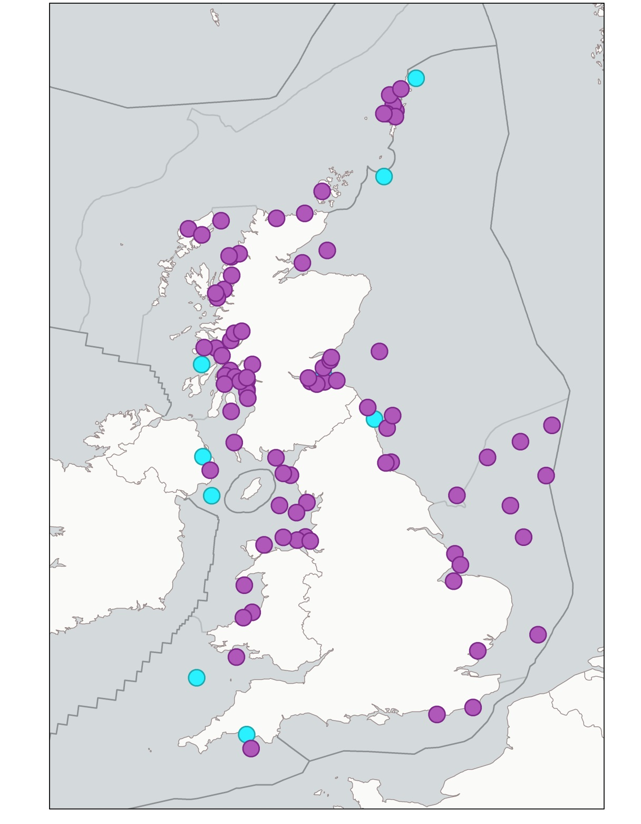
Figure 1. Trend and status (purple) and status only (blue) monitoring stations used to assess metal concentrations in biota. The areas delineated by the thinner black lines are the biogeographic regions; those delineated by the thicker black lines are the Marine Strategy Framework Directive (European Commission, 2008a) sub-regions.
Table 1. Number of time series in each biogeographic region used in the assessment of status and tends.
|
|
|
Status |
Trends |
||||
|
Region |
Sub-region |
Cadmium |
Lead |
Mercury |
Cadmium |
Lead |
Mercury |
|
Greater North Sea |
Northern North Sea |
27 |
27 |
27 |
19 |
19 |
21 |
|
Southern North Sea |
11 |
10 |
11 |
11 |
10 |
11 |
|
|
E Channel |
2 |
2 |
2 |
2 |
2 |
2 |
|
|
Celtic Seas |
Irish Sea |
30 |
30 |
30 |
27 |
26 |
27 |
|
Minches and West Scotland |
18 |
18 |
18 |
16 |
16 |
16 |
|
|
Scottish Continental Shelf |
8 |
8 |
8 |
7 |
8 |
7 |
|
|
W Channel and Celtic Sea |
4 |
4 |
4 |
2 |
2 |
2 |
|
Cadmium, mercury and lead were monitored in mussels and fish. Samples were taken in annual monitoring surveys based on the sampling frequencies specified in the OSPAR Joint Assessment and Monitoring Programme guideline. Sampling and chemical analysis methodologies met the relevant OSPAR requirements. Statistical assessments of status and trends were also based on OSPAR methodologies.
An individual time series of metal concentrations is assessed for status if:
- there is at least one year with data in the period 2010 to 2015
- there are at least three years of data over the whole-time series
- a parametric model can be fitted to the data and used to estimate the mean concentration in the final monitoring year (or, occasionally, if a non-parametric test of status is applied).
The time series is also assessed for trends if, in addition:
- there are at least five years of data over the whole-time series
- a parametric model can be fitted to the data and used to estimate the trend in mean concentrations.
Information on how the individual time series are assessed for status and trends is available from the British Oceanographic Data Centre.
For the regional assessment, the results from the individual time series are combined and a summary measure of status or trend is obtained from each time series. These are then modelled, using a linear mixed model, to estimate the mean status, or the mean trend in each biogeographic region. Only biogeographic regions with at least 3 monitoring stations with good geographic spread are considered in the regional assessment. Full details of the methodology is available from the British Oceanographic Data Centre.
Assessment thresholds for concentrations of metals in biota
Two assessment criteria are used to assess metal concentrations in biota (Table 2):
- Background Assessment Concentrations: developed by OSPAR for testing whether concentrations are near background. Mean concentrations significantly below the Background Assessment Concentration are said to be near background.
- European Commission food standards, as temporary proxy Environmental Assessment Criteria (OSPAR Commission, 2017). These are the maximum permitted concentrations of EC Food Regulation 1881/2006 (European Commission, 2006b) used in the absence of any satisfactory Environmental Assessment Criteria for assessing the ecological significance of biota concentrations.
Cadmium and lead are monitored in fish liver, for which no food standard exists. Concentrations in fish liver are naturally higher than in fish muscle, so the food standards for fish muscle are not used. Instead the food standards for shellfish are used as a proxy.
Table 2. Assessment Criteria used and their chemical abstracts service numbers (CAS) to assess metal concentrations in fish and shellfish. BAC: Background Assessment Concentration, EAC: Environmental Assessment Criteria, in this case proxy values. BACs are expressed in μg per kg dry weight for mussels and oysters, and μg per kg wet weight for fish. EACs are in μg per kg wet weight.
|
|
|
BAC |
EAC |
||
|
|
CAS number |
mussels |
oysters |
fish |
all species |
|
Cadmium (Cd) |
7440-43-9 |
960 |
3000 |
26 |
1000 |
|
Lead (Pb) |
7439-92-1 |
1300 |
1300 |
26 |
1500 |
|
Mercury (Hg) |
7439-97-6 |
90 |
180 |
35 |
500 |
Results
Findings in the 2012 UK Initial Assessment
Concentrations of metal in biota exceed the threshold values in a number of samples. These exceedances were localized in nature and close to the sources, particularly in industrialised coastal areas (HM Government, 2012).
Latest findings
Of the 253 trend assessments carried out in the Celtic Seas and Greater North Sea for cadmium, mercury and lead, 44 (17%) showed a significant upward trend while 29 (11%) showed a significant downward trend. Of the 299 status assessments, concentrations of metals in biota at 7 stations (2%) were above the Environmental Assessment Criteria (five for cadmium and two for lead).
Status assessment
The mean concentrations across the monitoring stations used in this assessment were below the proxy Environmental Assessment Criteria (OSPAR Commission, 2017) values for cadmium, mercury and lead in the Greater North Sea, the Celtic Sea and the 8 UK biogeographic regions (Figure 2).
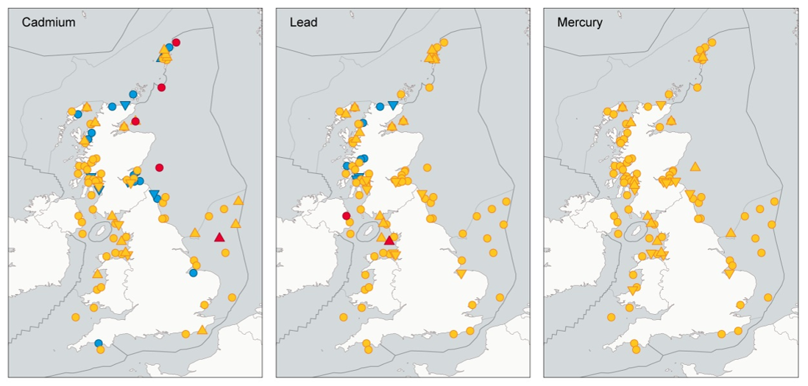
Figure 2. Sampling stations that have passed and failed the relevant proxy Environmental Assessment Criteria for cadmium, lead and mercury. Status assessment colour code: Blue: mean concentration significantly (p < 0.05) below the Background Assessment Concentration; orange: mean concentration significantly (p < 0.05) below the proxy Environmental Assessment Criteria; red: mean concentration not significantly below the proxy Environmental Assessment Criteria. Trend assessment: downward triangle: mean concentration significantly decreasing (p < 0.05); circle: no significant change in mean concentration (p > 0.05); upward triangle: mean concentration significantly increasing (p < 0.05).
For the Greater North Sea, all assessments were below the threshold except for 5 stations (13%) for cadmium. For the Celtic Seas all the assessments were below the threshold except for 2 stations (3%) for lead (Figures 2 and 3). The concentrations of cadmium, mercury and lead in biota were generally above background levels.
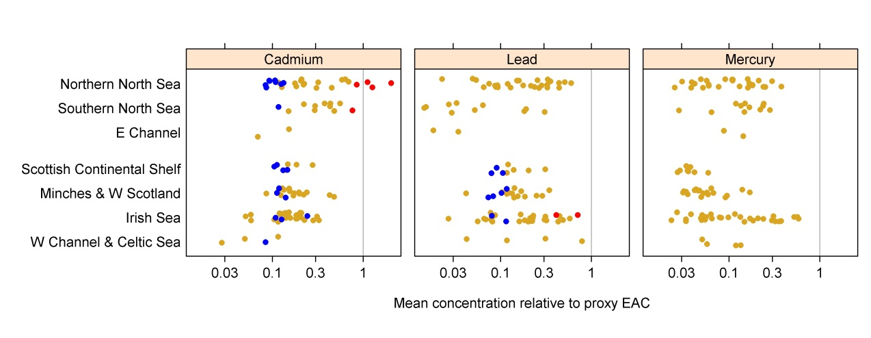
Figure 3. Individual proxy Environmental Assessment Criteria (EAC) status assessment in 7 of 8 UK biogeographic sub-regions. Blue: mean concentration significantly (p < 0.05) below the Background Assessment Concentration; orange: mean concentration significantly (p < 0.05) below the proxy Environmental Assessment Criteria; red: mean concentration not significantly below the proxy Environmental Assessment Criteria.
Overall, there is high confidence in these assessments. However, because this proxy Environmental Assessment Criteria relates to concentrations that cause adverse effects to human health over a lifetime exposure, there is limited confidence regarding the extent that these limits give a realistic picture of the adverse effects on sea life.
Trend assessment
Most regions show a stable situation, with no significant downward trends for cadmium, mercury or lead in any of the sub-regions. However, there are significant upward trends for cadmium in the Southern North Sea, and for mercury and lead in the Minches and West Scotland which, whilst still below the proxy Environmental Assessment Criteria, will need appropriate investigation.
Further information
In total, of the 253 trend assessments for cadmium, mercury and lead at 86 stations in the Celtic Seas and Greater North Sea, 44 (17%) showed a significant upward trend while 29 (11%) showed a significant downward trend. Of the 299 status assessment for cadmium, mercury and lead at up to 95 stations, 7 (2%) were above the proxy Environmental Assessment Criteria (5 for cadmium and 2 for lead) (Table 3; Figure 2).
The regional trend assessment shows that cadmium in the southern North Sea and mercury and lead in the Minches and West Scotland have increased significantly over the most recent assessment time scale (Figure 4). Concentrations at all other UK regions stayed static. A total of 44 assessments for different fish and shellfish showed significant upward trends in metal concentrations (Table 4). The stations IrishSea_BalcaryPoint_fi01, MinchMalin_TheMinchNorth_fi02 and MorayF_MoFOpenSea_fi01 showed significant upward trends for all 3 metals in plaice, while the station IrishSea_IrSIntermediateE_fi04 showed significant upward trends for all 3 metals in dab. This was also the case for blue mussel at station EShetland_CatFirth_sh01.
Table 3. Number of time series with each trend and status by biogeographic region and Marine Strategy Framework Directive (European Commission, 2008a) sub-region.
|
Trend Assessment |
Status Assessment |
||||||||||
|
MSFD sub-region |
biogeographic region |
Trend Assessment |
Cadmium |
Lead |
Mercury |
total |
Status Assessment |
Cadmium |
Lead |
Mercury |
total |
|
Greater North Sea |
Northern North Sea |
upward trend |
4 |
4 |
4 |
12 |
blue |
8 |
0 |
0 |
8 |
|
no trend |
12 |
13 |
13 |
38 |
orange |
15 |
27 |
27 |
69 |
||
|
|
downward trend |
3 |
2 |
4 |
9 |
red |
4 |
0 |
0 |
4 |
|
|
Southern North Sea |
upward trend |
3 |
0 |
0 |
3 |
blue |
1 |
0 |
0 |
1 |
|
|
no trend |
8 |
9 |
10 |
27 |
orange |
9 |
10 |
11 |
30 |
||
|
|
downward trend |
0 |
1 |
1 |
2 |
red |
1 |
0 |
0 |
1 |
|
|
E Channel |
upward trend |
1 |
0 |
0 |
1 |
blue |
0 |
0 |
0 |
0 |
|
|
no trend |
1 |
2 |
2 |
5 |
orange |
2 |
2 |
2 |
6 |
||
|
|
downward trend |
0 |
0 |
0 |
0 |
red |
0 |
0 |
0 |
0 |
|
|
total |
upward trend |
8 |
4 |
4 |
16 |
blue |
9 |
0 |
0 |
9 |
|
|
no trend |
21 |
24 |
25 |
70 |
orange |
26 |
39 |
40 |
105 |
||
|
|
|
downward trend |
3 |
3 |
5 |
11 |
red |
5 |
0 |
0 |
5 |
|
Celtic Seas |
Scottish Continental Shelf |
upward trend |
3 |
2 |
0 |
5 |
blue |
4 |
3 |
0 |
7 |
|
no trend |
3 |
5 |
6 |
14 |
orange |
4 |
5 |
8 |
17 |
||
|
|
downward trend |
1 |
1 |
1 |
3 |
red |
0 |
0 |
0 |
0 |
|
|
Minches & W Scotland |
upward trend |
3 |
4 |
2 |
9 |
blue |
3 |
4 |
0 |
7 |
|
|
no trend |
13 |
12 |
14 |
39 |
orange |
15 |
14 |
18 |
47 |
||
|
|
downward trend |
0 |
0 |
0 |
0 |
red |
0 |
0 |
0 |
0 |
|
|
Irish Sea |
upward trend |
4 |
4 |
6 |
14 |
blue |
3 |
2 |
0 |
5 |
|
|
no trend |
18 |
16 |
17 |
51 |
orange |
27 |
26 |
30 |
83 |
||
|
|
downward trend |
5 |
4 |
6 |
15 |
red |
0 |
2 |
0 |
2 |
|
|
W Channel & Celtic Sea |
upward trend |
0 |
0 |
0 |
0 |
blue |
1 |
0 |
0 |
1 |
|
|
no trend |
2 |
2 |
2 |
6 |
orange |
3 |
4 |
4 |
11 |
||
|
|
downward trend |
0 |
0 |
0 |
0 |
red |
0 |
0 |
0 |
0 |
|
|
total |
upward trend |
10 |
10 |
8 |
28 |
blue |
11 |
9 |
0 |
20 |
|
|
no trend |
36 |
35 |
39 |
110 |
orange |
49 |
49 |
60 |
158 |
||
|
|
downward trend |
6 |
7 |
5 |
18 |
red |
0 |
2 |
0 |
2 |
|
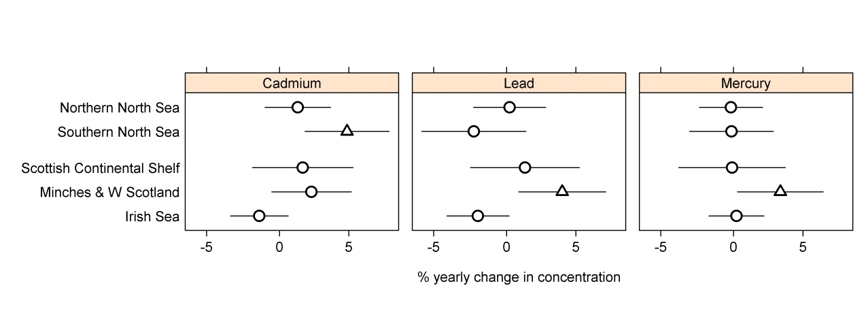
Figure 4. Trends in the 5 UK biogeographic sub-regions for which sufficient data were available to complete the assessment. Most sub-regions show static trends (circles), only cadmium in the Southern North Sea and mercury and lead in the Minches and West Scotland show increasing trends (upward triangle).
Table 4. Stations where a significant upward trend was observed within a specific species (indicated by ‘X’).
|
Region |
Station |
Species |
Cadmium |
Lead |
Mercury |
|
Greater North Sea |
|
|
|
|
|
|
Northern North Sea |
EScotland_EScOpenSea_fi01 |
Limanda limanda |
|
|
X |
|
Northern North Sea |
EShetland_CatFirth_sh01 |
Mytilus edulis |
X |
X |
X |
|
Northern North Sea |
EShetland_DalesVoeSouth_sh01 |
Mytilus edulis |
|
X |
|
|
Northern North Sea |
MorayF_MoFOpenSea_fi01 |
Pleuronectes platessa |
X |
X |
X |
|
Northern North Sea |
MorayF_MorayFirthOffshor_fi01 |
Pleuronectes platessa |
X |
X |
|
|
Northern North Sea |
TyneTees_TTOpenSeaS_fi01 |
Limanda limanda |
X |
|
X |
|
Southern North Sea |
HumWash_HWOpenSeaNE_fi01 |
Limanda limanda |
X |
|
|
|
Southern North Sea |
HumWash_HWOpenSeaNE_fi04 |
Limanda limanda |
X |
|
|
|
Southern North Sea |
HumWash_HWOpenSeaS_fi01 |
Limanda limanda |
X |
|
|
|
E Channel |
EastChan_ECInterE_fi01 |
Limanda limanda |
X |
|
|
|
Celtic Seas |
|
|
|
|
|
|
Scottish Continental Shelf |
WShetland_OlnaFirth_sh01 |
Mytilus edulis |
X |
|
|
|
Scottish Continental Shelf |
WShetland_RonasVoe_sh01 |
Mytilus edulis |
X |
X |
|
|
Scottish Continental Shelf |
WShetland_VailaSound_sh01 |
Mytilus edulis |
X |
X |
|
|
Minches & W Scotland |
MinchMalin_BroadfordBay_sh01 |
Mytilus edulis |
X |
|
|
|
Minches & W Scotland |
MinchMalin_LittleLBroom_sh01 |
Mytilus edulis |
X |
|
X |
|
Minches & W Scotland |
MinchMalin_LochCarronOutr_sh01 |
Mytilus edulis |
|
X |
|
|
Minches & W Scotland |
MinchMalin_LochLeurbost_sh01 |
Mytilus edulis |
|
X |
|
|
Minches & W Scotland |
MinchMalin_LochTorridon_sh01 |
Mytilus edulis |
|
X |
|
|
Minches & W Scotland |
MinchMalin_TheMinchNorth_fi02 |
Pleuronectes platessa |
X |
X |
X |
|
Irish Sea |
CardBay_CBInter_fi01 |
Limanda limanda |
X |
|
|
|
Irish Sea |
Clyde_FirthCInnerDunoon_sh01 |
Mytilus edulis |
|
|
X |
|
Irish Sea |
Clyde_LargsChannel_sh01 |
Mytilus edulis |
|
|
X |
|
Irish Sea |
IrishSea_BalcaryPoint_fi01 |
Pleuronectes platessa |
X |
X |
X |
|
Irish Sea |
IrishSea_IrSIntermediateE_fi03 |
Limanda limanda |
|
X |
X |
|
Irish Sea |
IrishSea_IrSIntermediateE_fi04 |
Limanda limanda |
X |
X |
X |
|
Irish Sea |
IrishSea_IrSOpenSea_fi04 |
Limanda limanda |
|
X |
|
|
Irish Sea |
IrishSea_LiverpoolBay_fi02 |
Limanda limanda |
X |
|
X |
Status assessment
The overall status assessment shows that on average none of the measured metals (cadmium, mercury and lead) were above the proxy Environmental Assessment in any of the UK sub-regions (Figure 5) and therefore the UK target described in the Marine Strategy Part One (HM Government, 2012) has been met for both the UK Celtic Seas and the UK Greater North Sea, although confidence in that conclusion is low due to the lack of ecotoxicologically-based Environmental Assessment Criteria values for assessing environmental health of sea life. Four stations in the Northern North Sea and one in the Southern North Sea were not significantly below the proxy Environmental Assessment Criteria for cadmium in dab and plaice liver and two stations in the Irish Sea exceeded the proxy Environmental Assessment Criteria limits for lead in dab and the blue mussel (Table 5).
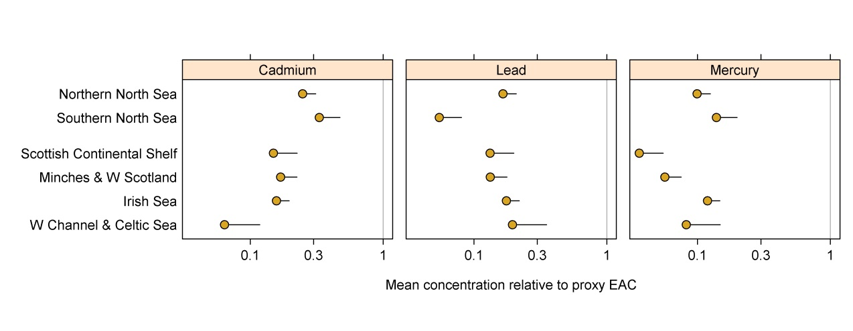
Figure 5. Status assessment in 6 of 8 UK biogeographic sub-regions. All sub-regions show concentrations significantly below the proxy Environmental Assessment Criteria (EAC) limits.
Table 5. Specific stations where the metals cadmium and lead were not significantly below the proxy Environmental Assessment Criteria in the last sampled year for specific metals (shown by ‘X’).
|
Region |
Station |
Species |
Year |
Cadmium |
Lead |
Mercury |
|
Greater North Sea |
|
|
|
|
|
|
|
Northern North Sea |
EScotland_EScOpenSea_fi01 |
Limanda limanda |
2015 |
X |
|
|
|
Northern North Sea |
EShetland_EShIntermediate_fi01 |
Limanda limanda |
2012 |
X |
|
|
|
Northern North Sea |
MorayF_MoFOpenSea_fi01 |
Limanda limanda |
2014 |
X |
|
|
|
Northern North Sea |
Fladen_FlaOpenSea_fi02 |
Pleuronectes platessa |
2013 |
X |
|
|
|
Southern North Sea |
HumWash_HWOpenSeaS_fi01 |
Limanda limanda |
2015 |
X |
|
|
|
Celtic Seas |
|
|
|
|
|
|
|
Irish Sea |
IrishSea_BelfastLoughInnr_sh01 |
Mytilus edulis |
2010 |
|
X |
|
|
Irish Sea |
IrishSea_IrSIntermediateE_fi04 |
Limanda limanda |
2012 |
|
X |
|
Conclusions
Since the UK Initial Assessment (HM Government, 2012) the concentrations of cadmium, mercury and lead in biota have not changed overall for either the Greater North Sea or the Celtic Seas. A very high percentage of stations met the UK target described in the Marine Strategy Part One (HM Government, 2012) for this indicator. A small number of increasing concentrations were observed in several areas which, whilst meeting the target described in the UK Marine Strategy Part One (HM Government, 2012) need further investigation. Further work is planned to develop a more appropriate assessment threshold or to better demonstrate the effects of the metals on sea life. Another option would be to set an overall trend target in the absence of an ecotoxicological assessment criteria.
Further information
Since the UK Initial Assessment (HM Government, 2012), the concentrations of metal contamination have not changed overall. Significant upward trends were observed within two biogeographic regions: in the Southern North Sea for cadmium and Minches and West Scotland for mercury and lead. The increases do not cause any concern in the Minches and West Scotland as the concentrations are still below the OSPAR proxy Environmental Assessment Criteria, but will be investigated for cause. Mercury increased significantly at 12 stations spread over 3 biogeographic regions. Nicolaus and others (2016a) already observed a significant mercury increase up to 2013 at TyneTees_TTOpenSeaS_fi01 (Amble), which the data up to 2015 used in this assessment is ongoing. Results published by the Environment Agency (2015), showed increases of mercury in mussels sampled at the Tees and Tyne sites from 2011 to 2014, which may be linked to the increases observed in fish reported in this assessment. Nicolaus and others (2016a) also observed an increase in cadmium at Amble, which, with newly added data, is now confirmed to be significant.
Currently, it is difficult to draw definite conclusions about the causes of increasing metal concentrations observed at some sites, but possible reasons include fish migration from nearshore areas where they bioaccumulate the determinands. Another possibility is that contaminants moved with sediment transport or increased due to atmospheric transport.
Cadmium is currently exceeding the proxy Environmental Assessment Criteria at 4 stations in the Northern North Sea and at one station in the Southern North Sea, while lead is currently failing the assessment at 2 stations in the Irish Sea. No failures were observed for mercury. Failures might be observed if species of higher trophic levels were sampled. Nicolaus and others (2016b) observed mercury increases with size in one of the UK’s top predator marine fish species, where the proxy Environmental Assessment Criteria was exceeded. The report published by the Environment Agency (2015) observed Environmental Quality Standards failures in multiple estuaries around England and Wales which may contribute to increases in mercury concentrations further from the coast. The UK government agencies are carrying out further investigations on the significant increases at the various sampled locations and at the sites where the status exceeds the set assessment criteria.
Knowledge gaps
Further work is needed to develop a more appropriate marine assessment threshold for this indicator, based on environmental limits relevant to sea life.
Further information
The assessment criteria are based on recognised background concentrations and on human food limits, not on ecotoxicologically-based environmental limits. Under the Water Framework Directive (European Commission, 2000), the EU has derived an Environmental Quality Standard for mercury in fish; however, this is lower than the accepted background concentrations and its derivation and implementation should be re-examined. Currently there is also ongoing work within the Environmental Quality Standards Directive (European Commission, 2008b) to develop assessment criteria, but it is still not decided how these may relate to coastal and offshore monitoring. Environmental Assessment Criteria for assessing metals in mussels and for cadmium and lead in fish should be developed in order to assess whether the current concentrations are causing environmental harm. This will require additional toxicological information from marine species to be obtained. The reasons for the increasing concentrations of cadmium in the North Sea and of lead to the west of Scotland should be investigated.
References
Besselink HT, Denison MS, Hahn ME, Vethaak AD, Koeman JH, Brouwer A (1997) ‘High induction of cytochrome P4501A activity without changes in retinoid and thyroid hormone levels in flounder (Platichthys flesus) exposed to 2,3,7,8-tetraachlorodibenzo-p-dioxin’ Environmental Toxicology Chemistry 16: 816-823 (viewed on 30 November 2018)
Beyer J, Peterson K, Song Y, Ruus A, Grung M, Bakke T, Tollefsen KE (2014) ‘Environmental risk assessment of combined effects in aquatic ecotoxicology: a discussion paper’ Marine Environmental Research 96: 81-91(viewed on 30 November 2018)
Chapman PM, Wang F (2001) ‘Assessing sediment contamination in estuaries’. Environmental Toxicology Chemistry 20: 3-22 (viewed on 30 November 2018)
Dauvin JC (2008) ‘Effects of heavy metal contamination on the macrobenthic fauna in estuaries: The case of the Seine estuary’ Marine Pollution Bulletin 57: 160-169 (viewed on 30 November 2018)
Damiano S, Papetti P, Menesatti P (2011) ‘Accumulation of heavy metals to assess the health status of swordfish in a comparative analysis of Mediterranean and Atlantic areas’ Marine Pollution Bulletin 62: 1920-1925 (viewed on 30 November 2018)
European Commission (2000) ‘Directive 2000/60/EC of the European Parliament and of the Council establishing a framework for the Community action in the field of water policy’ Official Journal of the European Union L 327, 22.12.2000, pages 1–73 (viewed on 16 November 2018)
European Commission (2006a) ‘Commission Regulation (EC) No 1881/2006 of 19 December 2006 setting maximum levels for certain contaminants in foodstuffs (Text with EEA relevance)’ Official Journal of the European Union L 364, 20.12.2006, pages 5–24 (viewed on 29 November 2018)
European Commission (2006b) ‘Commission Regulation (EC) No 1881/2006 of 19 December 2006 setting maximum levels for certain contaminants in foodstuffs (Text with EEA relevance)’ Official Journal of the European Union, L 364, 20.12.2006, pages 5–24 (viewed on 30 November 2018)
European Commission (2008a) ‘Directive 2008/56/EC of the European Parliament and of the Council of 17 June 2008 establishing a framework for community action in the field of marine environmental policy (Marine Strategy Framework Directive)’ Official Journal of the European Union L 164, 25.6.2008, pages 19-40 (viewed on 16 November 2018)
European Commission (2008b) ‘Directive 2008/105/EC of the European Parliament and of the Council of 16 December 2008 on environmental quality standards in the field of water policy, amending and subsequently repealing Council Directives 82/176/EEC, 83/513/EEC, 84/156/EEC, 84/491/EEC, 86/280/EEC and amending Directive 2000/60/EC of the European Parliament and of the Council’ Official Journal of the European Union (viewed on 29 November 2018)
European Commission (2013) ‘Directive 2013/39/EU of the European Parliament and of the Council of 12 August 2013 amending Directives 2000/60/EC and 2008/105/EC as regards priority substances in the field of water policy Text with EEA relevance’ Official Journal of the European Union L 226, 24.8.2013, pages 1–17 (viewed on 30 November 2018)
Environment Agency (2015) ‘Mercury and mercury compounds: background data and predicted future emissions’ (viewed on 30 November 2018)
HM Government (2012) ‘Marine Strategy Part One: UK Initial Assessment and Good Environmental Status’ (viewed on 5 July 2018)
HM Government (2015) ‘Marine Strategy Part Three: UK Programme of Measures’ December 2015 (viewed on 5 July 2018)
Jepson P, Deaville R, Barber JL, Aguilar A, Borrell A, Murphy S, Barry J, Brownlow A, Barnett J, BerrowS, CunninghamA, Davison N, ten Doeschate M, Esteban R, Ferreira M, Foote AD, Genov T, Gimenez J, Loveridge J, Llavona A, Maxwell DL, Papachlimitzou A, Penrose R, Perkins MW, Smith B, de Stephanis R, Tregenza N, Verborgh P, Fernandez A, Law RJ (2016) ‘PCB pollution continues to impact populations of orcas and other dolphins in European waters’ Scientific Reports 6: 18573. doi: 10.1038/srep18573 (viewed on 30 November 2018)
Lee O, Danilowicz BS, Dickey-Collas M (2006) ‘Temporal and spatial variability in growth and condition of dab (Limanda limanda) and sprat (Sprattus sprattus) larvae in the Irish Sea’ Fisheries Oceanography 15: 490-507 (viewed on 30 November 2018)
Leung KMY, Bjørgesæter A, Gray JS, Li WK, Lui GCS, Wang Y, Lam PKS (2005) ‘Deriving sediment quality guidelines from field-based species sensitivity distributions’ Environmental Toxicology Chemistry 39:5148-5156 (viewed on 30 November 2018)
Martin CS, Carpentier A, Vaz S, Coppin F, Curet L, Dauvin J-C, Delavenne J, Dewarumez J-M, Dupuis L, Engelhard G, Ernande B, Foveau A, Garcia C, Gardel L, Harrop S, Just R, Koubbi P, Lauria V, Meaden GJ, Morin J, Ota Y, Rostiaux E, Smith R, Spilmont N, Vérin Y, Villanueva C, Warembourg C (2009) ‘The Channel habitat atlas for marine resource management (CHARM): an aid for planning and decision-making in an area under strong anthropogenic pressure’ Aquatic Living Resource 22: 499-508 (viewed on 30 November 2018)
Nicolaus EEM, Law RJ, Wright SR, Lyons BP (2015) ‘Spatial and temporal analysis of the risks posed by polycyclic aromatic hydrocarbon, polychlorinated biphenyl and metal contaminants in sediments in UK estuaries and coastal waters’ Marine Pollution Bulletin 95: 469-479 (viewed on 30 November 2018)
Nicolaus EEM, Wright SR, Bolam TPC, Barber JL, Bignell JP, Lyons BP (2016a) ‘Spatial and temporal analysis of the risks posed by polychlorinated biphenyl and metal contaminants in dab (Limanda limanda) collected from waters around England and Wales’ Marine Pollution Bulletin 112: 399-405 (viewed on 30 November 2018)
Nicolaus EEM, Bendall VA, Bolam TPC, Maes T, Ellis JR (2016b) ‘Concentrations of mercury and other elements in porbeagle shark Lamna nasus’ Marine Pollution Bulletin 112: 406-410 (viewed on 30 November 2018)
OSPAR Commission (2008) ‘Co-ordinated Environmental Monitoring Programme – Assessment manual for contaminants in sediment and biota ISBN 978-1-906840-20-4’ Publication Number 379/2008 (viewed on 30 November 2018)
OSPAR Commission (2009) ‘Background Document on Assessment Criteria used for assessing CEMP Monitoring Data for the Concentrations of Hazardous Substances in Marine Sediments and Biota in the Context of QSR 2010’ OSPAR Publication 461/2009 ISBN 978-1-907390-08-1 (viewed on 03 December 2018)
OSPAR Commission (2014), ‘OSPAR Joint Assessment and Monitoring Programme (JAMP) 2014 – 2021’ Ospar Agreement 2014-02 (viewed on 27 November 2018)
UKMMAS (2010) 'Charting Progress 2: An assessment of the state of the UK seas' Published by Defra on behalf of the UK Marine Monitoring and Assessment Strategy community (viewed on 4 January 2018)
Zhang LP, Xin Y, Huan F, Jing YH, Ouyang T, Yu XT (2007) ‘Heavy metal contamination in western Xiamen Bay sediments and its vicinity’ China Marine Pollution Bulletin 54: 974–982 (viewed on 30 November 2018)
Acknowledgements
Assessment metadata
| Assessment Type | UK Marine Strategy Framework Directive Indicator Assessment |
|---|---|
D8 | |
D8.2 Effects of Contaminants | |
Marine Strategy Part One | |
| Point of contact email | marinestrategy@defra.gov.uk |
| Metadata date | Saturday, September 1, 2018 |
| Title | Status and trend of cadmium, lead and mercury in fish and shellfish |
| Resource abstract | Since 2012, concentrations of cadmium, lead and mercury in biota are broadly similar and generally achieve the target described in the UK Marine Strategy Part One. |
| Linkage | Please see links provided in ‘References’ section above. |
| Conditions applying to access and use | © Crown copyright, licenced under the Open Government Licence (OGL). |
| Assessment Lineage | The 2016 assessment of the UK's Clean Seas Environment Monitoring Programme described the status and trends of contaminant concentrations and biological effects measurements in biota and sediment at monitoring stations in waters around the UK. Assessments were made for a large number of time series, typically each of a single contaminant in a single species (for biota) at a single monitoring station. The results of the individual time series at coastal and offshore stations were synthesised to assess status and trends at the biogeographic regional level and formed the basis of this indicator. Data were submitted to the MERMAN database from relevant Competent Monitoring Authorities. A series of templates were populated by submitting officers and submitted to the database which has in-built data restrictions and a data filter to ensure high quality, accurate data are submitted. The data filter has formulae in-built which use Accredited Quality Control information from known standards, limits, standard deviations and/or inter laboratory calibration exercises to calculate a score. Only data that passed a threshold agreed with the national advisory bodies were used for assessments. The data for 1999 - 2015 were extracted from MERMAN. Further data checks were made and records with obvious errors were deleted or corrected. The data were standardised to agreed units and bases. The data were grouped into time series of a single contaminant in a single species at a single monitoring station. Time series with no data for the period 2010 - 2015 were excluded. The individual time series were assessed for both trends and status. The methods behind the assessments and the individual time series results are available from the British Oceanographic Data Centre. The results of the individual time series at coastal and offshore stations were then synthesised to assess status and trends at the biogeographic regional level. The methods and results are available from the British Oceanographic Data Centre. |
| Dataset metadata | https://portal.medin.org.uk/portal/start.php#details?tpc=012_Marine_Scotland_FishDAC_12111 |
| Dataset DOI |
The Metadata are “data about the content, quality, condition, and other characteristics of data” (FGDC Content Standard for Digital Geospatial Metadata Workbook, Ver 2.0, May 1, 2000).
Metadata definitions
Assessment Lineage - description of data sets and method used to obtain the results of the assessment
Dataset – The datasets included in the assessment should be accessible, and reflect the exact copies or versions of the data used in the assessment. This means that if extracts from existing data were modified, filtered, or otherwise altered, then the modified data should be separately accessible, and described by metadata (acknowledging the originators of the raw data).
Dataset metadata – information on the data sources and characteristics of data sets used in the assessment (MEDIN and INSPIRE compliance).
Digital Object Identifier (DOI) – a persistent identifier to provide a link to a dataset (or other resource) on digital networks. Please note that persistent identifiers can be created/minted, even if a dataset is not directly available online.
Indicator assessment metadata – data and information about the content, quality, condition, and other characteristics of an indicator assessment.
MEDIN discovery metadata - a list of standardized information that accompanies a marine dataset and allows other people to find out what the dataset contains, where it was collected and how they can get hold of it.
Recommended reference for this indicator assessment
E.E. Manuel Nicolaus1, Brett Lyons1, Alison Miles2, Craig D. Robinson3, Lynda Webster3 and Rob Fryer3 2018. Time trend and status for Cadmium, Mercury and Lead in fish and shellfish. UK Marine Online Assessment Tool, available at: https://moat.cefas.co.uk/pressures-from-human-activities/contaminants/metals-in-biota/
1Centre for Environment, Fisheries and Aquaculture Science
2Environment Agency
3Marine Scotland