
Abundance and distribution of coastal bottlenose dolphins
In UK waters there are around 700 coastal bottlenose dolphins living in four groups. The UK target of ‘no statistically significant decrease in abundance’ was met in the Greater North Sea and for the largest group in the Celtic Seas. No assessment has been possible for the other two smaller Celtic Seas groups.
Background
UK Target on changes in the abundance and distribution of coastal bottlenose dolphins
This indicator is used to assess progress against the following target, which is set in the UK Marine Strategy Part One (HM Government, 2012):
“At the scale of the Marine Strategy Framework Directive Sub-Regions, abundance of cetaceans is not decreasing as a result of human activity: in all of the indicators monitored, there should be no statistically significant decrease in abundance of marine mammals caused by human activities.”
Key pressures and impacts
Some bottlenose dolphins (Figure 1) live in very close proximity to the coast, where they are exposed to higher levels of human activity than other cetacean species. The main pressures come from persistent organic pollutants such as polychlorinated biphenyls (known as PCBs), and from underwater noise from anthropogenic sources including seismic surveys, pile driving, military sonar, and shipping. Bottlenose dolphins can also be disturbed by wildlife-watching vessels and be injured in collisions with vessels.
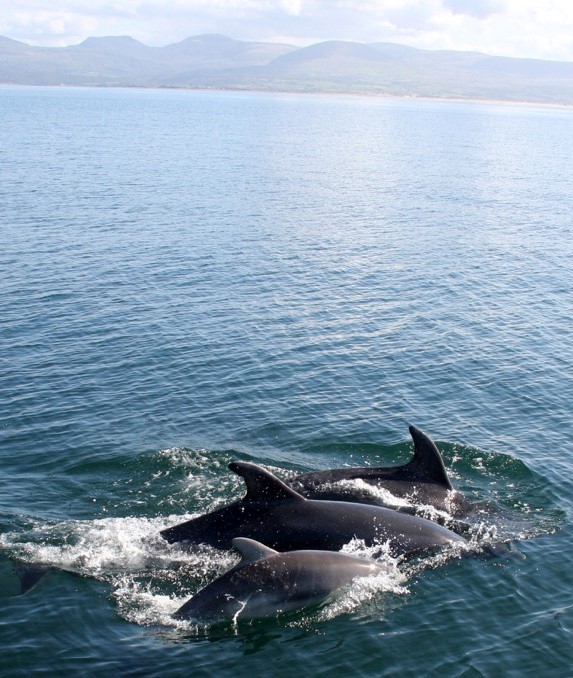
Figure 1. Bottlenose dolphins in Cardigan Bay (Wales) (photo courtesy of Peter Evans, Sea Watch Foundation).
Measures taken to address the impacts
Measures to protect cetaceans are set out in the UK Marine Strategy Part Three (HM Government, 2015). These include many national, European, and international conventions, agreements and regulations, which also establish broad parameters for monitoring. The Special Areas of Conservation in the Moray Firth and Cardigan Bay were designated primarily to protect the two largest groups of coastal bottlenose dolphins in UK waters.
Monitoring, assessment, and regional cooperation
Areas that have been assessed
In European waters, bottlenose dolphins consist of a large, wide-ranging offshore population and much smaller coastal groups (see assessment units in Figure 2). In UK waters, there are around 700 coastal bottlenose dolphins living in four groups. One of these occurs in the Greater North Sea sub-region (East Coast Scotland), which incorporates the Moray Firth Special Area of Conservation. The other three occur in the Celtic Seas Sub-Region: Coastal South West England, the West Coast of Scotland, and Coastal Wales. The latter incorporates both the Cardigan Bay and the Pen Llyn a’r Sarna Special Area of Conservation.
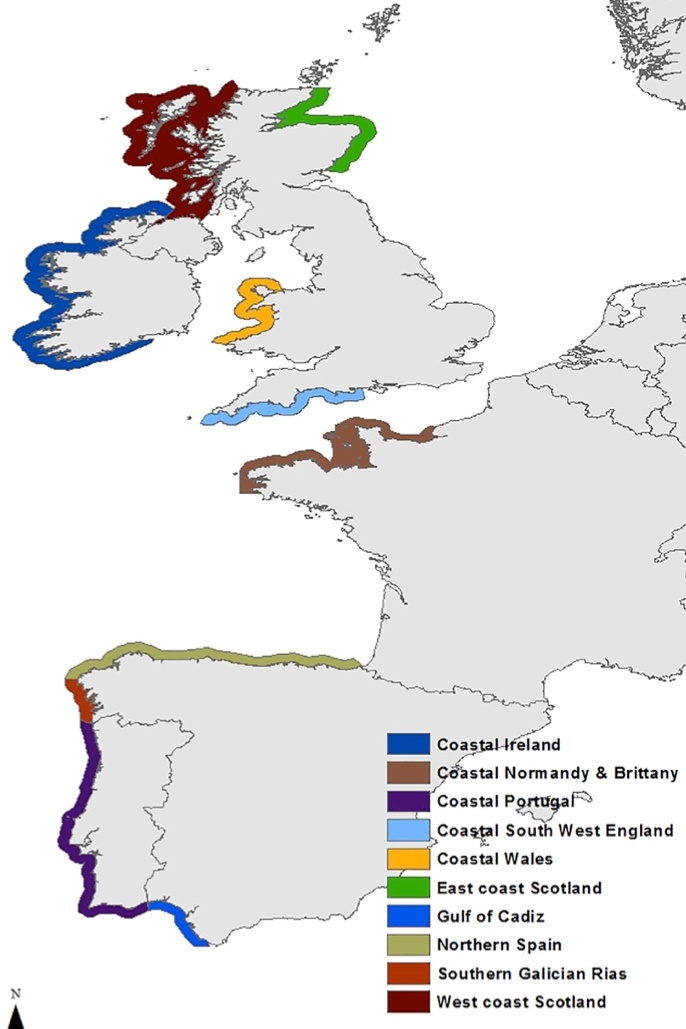
Figure 2. Coastal bottlenose dolphin assessment units for European Atlantic waters. Map produced by the Joint Nature Conservation Committee; contains data from the UK Hydrographic Office.
Monitoring and Assessment methods
The numbers of dolphins within the East Coast Scotland and Coastal Wales groups are monitored through a combination of photo-identification and line-transect survey techniques which enable changes to be tracked.
Assessment thresholds
The UK target of ‘no statistically significant decrease in abundance’ was considered to be achieved if there was no decrease of greater than 5% over a ten-year period. This assessment required at least four abundance estimates from different years within a ten-year period.
Regional cooperation
The results of this UK assessment have contributed to the OSPAR Intermediate Assessment (OSPAR Commission, 2017).
stuff
Further information
While high mobility of the species facilitates interaction and gene flow over large distances (Hoelzel, 1998; Querouil and others, 2007), bottlenose dolphins also display fine-scale genetic population structure resulting from localized adaptations over small spatial scales (Ansmann and others, 2012). Genetic differentiation between neighbouring populations regularly occurs and may be related to habitat borders (Natoli and others, 2005; Bilgmann and others, 2007; Wiszniewski and others, 2009), sex-biased linked dispersal (Möller and Beheregaray, 2004; Bilgmann and others, 2007; Wiszniewski and others, 2010), niche specialisation (Louis and others, 2014a), anthropogenic activities (Chilvers and Corkeron, 2001), and through isolation by distance without apparent boundaries separating populations (Krützen and others, 2004; Rosel and others, 2009). Consequently, bottlenose dolphins are subdivided into small discrete coastal groups residing relatively close to shore and a much larger wide-ranging offshore population. The relationships both within and between those coastal and offshore populations remain unclear (Rosel and others, 2009; Toth and others, 2012; Richards and others, 2013; Louis and others, 2014b).
Coastal bottlenose dolphin groups occur along the Atlantic seaboard of Europe from Scotland in the north, to Spain in the south. Bottlenose dolphins occur in coastal waters of Spain, Portugal, Northwest France, West and South Ireland (including a genetically distinct group in the Shannon estuary and a more wide-ranging coastal group, moving along the west coast). In UK waters, there are four coastal groups: East Coast Scotland, West Coast Scotland, Coastal Wales and Coastal South West England. Assessment units for coastal bottlenose dolphins (Figure 2) have therefore been determined by a combination of spatial separation, lack of photo-ID matches, and genetic differences (Evans and Teilmann, 2009; ICES, 2013; 2014). In past centuries, the species appears to have regularly occupied the southern North Sea and a number of estuaries where bottlenose dolphins are now uncommon. Recent records suggest they may be returning (Peter Evans, personal communication).
Key pressures and impacts
Pressures from some human activities may affect coastal bottlenose dolphins. The most obvious pressure in coastal areas is human disturbance as a result of industrial development (Bailey and others, 2010; Merchant and others, 2014; Pirotta and others, 2014; 2015) and recreational activities including commercial dolphin watching (Feingold and Evans, 2014; Norman and others, 2015). Research has demonstrated high pollutant loads in stranded animals purportedly from most of the investigated coastal bottlenose dolphin populations, possibly leading to health and reproductive issues (Jepson and others, 2013; 2016). Exposure to high pollutant levels has been suggested as one reason for past declines and the disappearance of some populations (Jepson and others 2013; 2016). Incidental bycatches of bottlenose dolphins through entanglement in fishing gear (mainly gillnets and pelagic trawls) also occur (ICES, 2015a; 2015b) but is rare in the UK. Fishing activities may also indirectly affect populations through depletion of the prey resource (ICES, 2015c). Habitat loss has also been shown to affect coastal populations (Camphuysen and Peet, 2006; Camphuysen and Smeenk, 2016). Climate change may also impact bottlenose dolphins, positively or negatively, either by altering human activities and thus pressures, or by affecting the abundance and distribution of their prey.
Assessment method
Introduction
Although the baseline for any assessment ideally should be derived from historical data obtained before major human impacts, these data are not available. Moreover, the historical abundance and distribution of bottlenose dolphin where they are known to have declined are unknown and cannot realistically be restored as today’s marine environment is very different and it not being feasible to remove all anthropogenic pressures. Climatic changes may also have important consequences. A more recent baseline, therefore, has to be used. In this assessment, the beginning of the data time series for each assessment unit has been used as the baseline, with trends identified as a deviation from that baseline value.
Bottlenose dolphins are a long-lived and slow to reproduce so there may be significant time lags before issues with reproductive success can be detected. Therefore, abundance data should always be considered separately for each assessment unit, along with any associated data on distributional changes, causes of death in stranded animals, and possible links to human activities where data are available.
Abundance
The abundance of coastal bottlenose dolphin groups has been calculated for each Assessment Unit where sufficient data exist. Abundance estimates were made largely using photo-identification, capture-recapture, and line transect methods. These estimates may indicate the trend in the population since the beginning of monitoring as: (1) stable, (2) declining, (3) increasing, or (4) unknown. The UK target of ‘no statistically significant decrease in abundance’ was considered to be achieved if there was no decrease of greater than 5% over a ten-year period. This assessment required at least four abundance estimates from different years within a ten-year period. Table 1 shows that the quality of the time-series was only sufficient in two of the UK coastal bottlenose dolphin Assessment Units: East Coast Scotland, and Coastal Wales.
Table 1. Quality of time series data in each UK coastal bottlenose dolphin assessment units.
|
Assessment Unit |
Quality of time series |
Population trend |
|
|
≥ 10 years |
≥ 4 abundance estimates |
||
|
East Coast Scotland |
Yes (1990-2014) |
Yes |
Stable (possibly increasing) |
|
Coastal Wales |
Yes (2001-2015 for Cardigan Bay SAC; 2005-2015 for wider Cardigan Bay) |
Yes |
Stable |
|
West Coast Scotland |
Yes (Sound of Barra 1995/98 and 2006/7; Inner Hebrides 2006/7) |
No |
No assessment
|
|
Coastal South West England |
No (some partial monitoring by different organisations but no collation of effort) |
No estimates available |
No assessment |
Distribution
Records of both sightings and strandings were used to identify where populations of coastal bottlenose dolphins existed historically but are no longer present today.
Results
Results and assessment of progress
Findings from the 2012 UK Initial Assessment
The coastal bottlenose dolphin population was considered to be in a good or favourable condition throughout UK waters (HM Government, 2012).
Latest Findings
Status assessment
In the Greater North Sea, the East Coast Scotland assessment unit contained 170 individuals in 2014, and the range has extended south from the Moray Firth to as far as St Andrews Bay in Fife.
In the Celtic Seas, the largest of the three coastal bottlenose dolphin groups inhabiting the Coastal Wales assessment unit, held an estimated 222 individuals in 2015. The group is concentrated around the Cardigan Bay area but ranges more widely at certain times of the year. In the West Coast Scotland assessment unit, there is a small resident bottlenose dolphin population of around 15 animals in the Outer Hebrides. An additional 30 bottlenose dolphins reside around the Inner Hebrides.
Bottlenose dolphins have regularly inhabited Coastal South West England assessment units since the 1990s and are most common around Cornwall. No systematic photo-identification surveys have been undertaken in this area, but it was estimated that around 100 individuals were present during 2008 to 2013. It is unclear what proportion of this estimate may constitute animals from the wider-ranging offshore population.
Trend assessment
In the Greater North Sea since the Initial Assessment (HM Government, 2012) was conducted, there has been no statistically significant change (> 5%) in the size of the East Coast Scotland group (Figure 3).
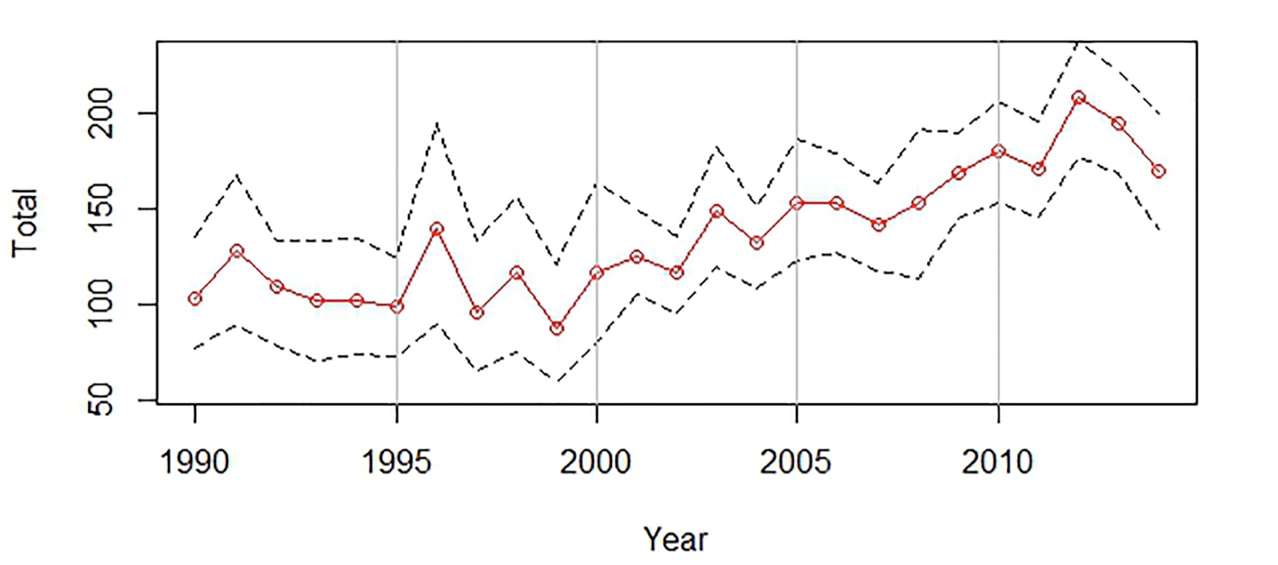
Figure 3. Annual estimates of bottlenose dolphin abundance (from mark-recapture) in the East Coast Scotland Assessment Unit (see map in Figure 2). Dashed lines show the confidence interval.
In the Celtic Seas since the Initial Assessment (HM Government, 2012) was conducted numbers in Coastal Wales have been stable (Figure 4). There has been no statistically significant change in the size of the population over the last ten years. There are insufficient data to accurately determine population trends in West Coast Scotland, although the numbers appear to have been stable. There are insufficient data to assess trends in the Coastal South West England assessment unit.
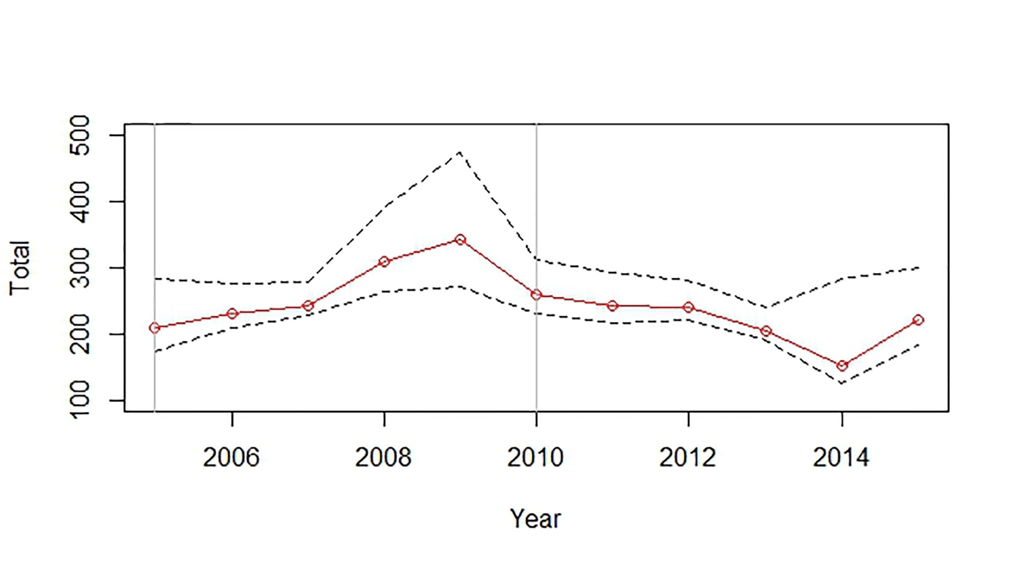
Figure 4. Annual estimates of bottlenose dolphin abundance (from mark-recapture) in the Coastal Wales assessment unit (in the wider Cardigan Bay area). Dashed lines show the confidence interval.
Further information
East Coast Scotland
Monitoring of bottlenose dolphins in the inner Moray Firth started in 1990 and later was extended to a wider part of the Firth. Even though bottlenose dolphins ranged all along the north and south coasts of the Moray Firth during the 1990s, it was not until the mid-1990s that the species started extending its range around the Grampian coast (Evans and others, 2003; Wilson and others, 2004). Bottlenose dolphin is now regularly encountered particularly off Aberdeen, the coast of Fife and in St Andrews Bay (Weir and Stockin, 2001; Cheney and others, 2013) and also seen annually along the coast of North East England as far south as Yorkshire. Some of the individuals along the coast of North East England have been photo-identified as belonging to the Moray Firth population (Sea Watch Foundation, unpublished data).
Analysis of mark-recapture studies using a Bayesian approach estimates the population on the East coast of Scotland at 87 to 208 animals, with the latest estimate (2014) being 170 (95% highest posterior density interval: 139 to 200). Despite the inter-annual variability, the population is stable or increasing, with no decline over the available time series of more than 5% in 10 years (Figure 3; Cheney and others, 2014).
Coastal Wales
Annual monitoring of bottlenose dolphins in the Cardigan Bay Special Area of Conservation (often referred to as SAC), began in 2001. This was extended to incorporate the wider Cardigan Bay area from 2005. Since 2007, there have been opportunistic photo-identification surveys in the coastal waters of North Wales, and occasionally around the Isle of Man and in Liverpool Bay. A proportion of the population inhabiting Cardigan Bay in the summer ranges more widely between November and April, occurring particularly off the North Coast of Anglesey, the mainland coast of North Wales and further north around the Isle of Man. Summer mark-recapture estimates for Cardigan Bay Special Area of Conservation have varied from 116 to 260 animals. The latest estimate (from 2015) is 159 animals (95% confidence interval: 130-228). For the wider Cardigan Bay, summer mark-recapture estimates have varied from 152 to 342 animals, with the 2015 estimate being 222 animals (95% confidence interval: 184-300). The Coastal Wales assessment unit population is considered to be stable, with no decline over the available time series of greater than 5% in ten years (Figures 3 and 4). Similar results were also found with the line transect surveys with a population estimate of 85 to 214 individuals in 2001 to 19 to 220 in 2015. For the Cardigan Bay Special Area of Conservation survey region (Figure 4), the mark-recapture population estimates between 2013 and 2015 have been amongst the lowest recorded (a pattern also reflected in data from line transect surveys) but due to variability in the estimates it is too early to determine whether this indicates a decline or change in distribution (in other words, the dolphins are beginning to utilise other areas).
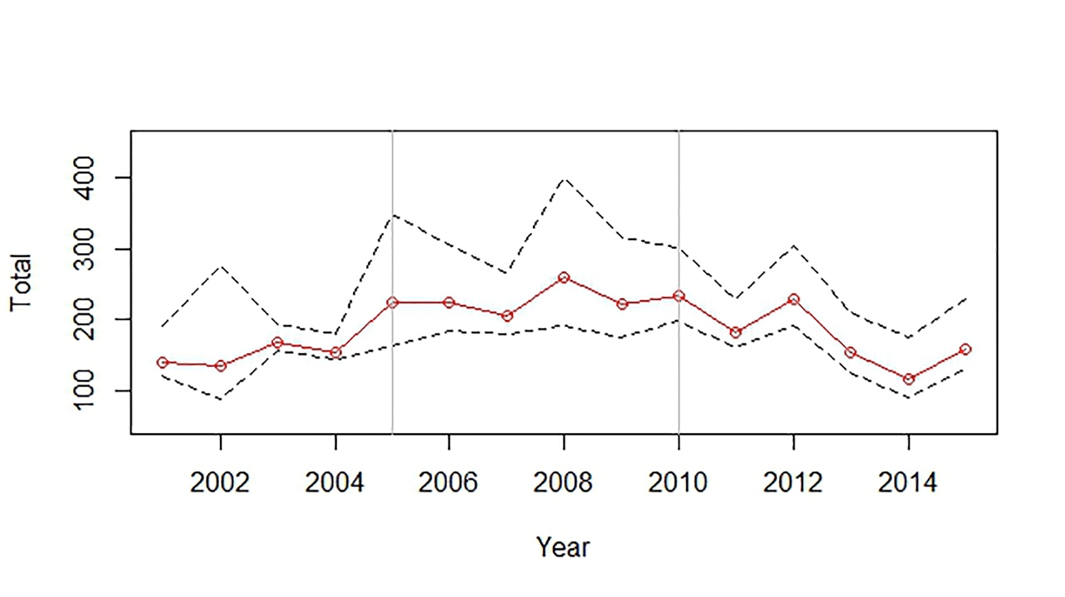
Figure 5. Yearly abundance estimates from photo-identification mark-recapture (closed population model) for the population bottlenose dolphins in Cardigan Bay Special Area of Conservation in Wales. Dashed lines show the confidence interval.
West Coast Scotland
A small resident bottlenose dolphin population numbering around 15 animals, inhabits the vicinity of the Sound of Barra in the Outer Hebrides, while an estimated 30 bottlenose dolphins range around the Inner Hebrides spending periods of time around Islay, the Small Isles, Skye, and occasionally the Minch, north of Skye. There are insufficient data to determine the population trends, although the numbers appear to have been stable over the two last decades.
Coastal South West England
Bottlenose dolphins have regularly inhabited the south and south-west coasts of England since the 1990s, being most common around Cornwall but rare east of Dorset (Williams and others, 1997; Evans and others, 2003; Brereton and others, 2018). No systematic photo-identification surveys have been undertaken, but Brereton and others (2018) have reported maximum abundance estimates for south-west England coastal waters, using two mark-recapture methods, ranging between 102 and 113 (95% confidence interval: 87-142) individuals over the combined period 2008 to 2013. There are, therefore, insufficient data to assess trends. Sightings have increased, but this partly reflects the increase in effort.
Historical Distribution
Bottlenose dolphins appear to have used some coastal areas for limited periods of time, possibly forming ephemeral groups. For example, between the 1960s and 1990, there were no resident bottlenose dolphins in the South West England coastal area. There were few records of the bottlenose dolphins in Scottish waters prior to the late 19th Century, though further south during the same period, groups of an unknown size disappeared from the Severn, Thames and Humber Estuaries. In the last year or so animals seem to be returning to these areas.
Confidence in the assessment
There is high confidence in the assessment for the Greater North Sea where there is only a single resident coastal group which has been extensively studied. For the Celtic Seas Sub-Region, the confidence in the assessment is low to moderate. There were no data available for two of the three coastal groups in this Sub-Region. The third group, Coastal Wales, has however been extensively studied for many years.
Conclusions
The UK target of ‘no statistically significant decrease in abundance’ was met in the Greater North Sea, where numbers in the only coastal group, in East Coast Scotland, have been stable since the Initial Assessment (HM Government, 2012), following a steady increase during the 2000s.
In the Celtic Seas, there was ‘no statistically significant decrease in abundance’ in the largest group, Coastal Wales, where numbers have been stable since the UK Initial Assessment and since monitoring began. Elsewhere, trends in abundance of bottlenose dolphins in West Coast Scotland and Coastal South West England were unknown due to insufficient monitoring data.
Further information
Some estuaries that once held bottlenose dolphin populations no longer do so. Some of these losses occurred over a century ago, while others are more recent. Coastal bottlenose dolphins disappeared from the southern North Sea around the late 1960s. More specifically for UK waters, coastal groups were lost from the Severn and Humber estuaries and the Firth of Forth in the late 19th Century. It might be that bottlenose dolphins use some coastal areas for limited periods, possibly forming temporary groups. In contrast to the losses already noted, between the 1960s and 1990 there were no resident bottlenose dolphins in south-west England where they exist today. Towards the end of the 19th-century recording of bottlenose dolphins began in Scotland, prior to this there are no records of the species. Today, animals appear to be returning to some of the areas from where they were previously lost. It is unknown whether the distributional changes of coastal groups result from human activities or whether they are temporary groups that move as conditions change.
The consequences of human activities, particularly habitat deterioration (including pollutants), and disturbance from recreational activities (including commercial dolphin watching) and industrial development on these populations are unclear. Coastal bottlenose dolphin populations can have an ephemeral nature, possibly related to prey availability. The effects of fisheries bycatch and prey depletion may be more important than has been estimated. The full consequences of habitat alterations due to climate change are currently unknown.
Knowledge gaps
Due to the lack of data, this assessment was only possible for two of the four populations of the coastal bottlenose dolphin in UK waters.
For Coastal South-West England, data have been collected since the 1990s by various non-profit organisations and academics and would need to be collated if quantitative assessments of the group are to be conducted. The West Coast Scotland group of bottlenose dolphins is small and highly mobile and difficult to survey using conventional methods. Alternative methods would need to be developed before the size of this group can be accurately estimated.
If the UK target is not met, a better understanding of the relationships between coastal bottlenose dolphins and their wider-ranging offshore relatives would be beneficial.
Further information
Assessments could only be made for two of the four coastal groups of bottlenose dolphins against the target set for this indicator. This was because relevant monitoring had not been undertaken for long enough (at least ten years, with a minimum of four assessments during that period) or was of such disparate nature both temporally and spatially that an assessment was not possible.
Information on historical distribution and, particularly, abundance collected prior to major human impacts is scarce or lacking. There are some published accounts, but much of the information is anecdotal. It is unlikely that such information will become available in sufficient detail to qualify as a baseline.
Defining assessment units at an appropriate scale for bottlenose dolphin is challenging. They have been divided into coastal and offshore types but could also be divided into three types related to their patterns of mobility and habitat use: truly resident in a small area, coastal (ranging over a larger area) and wide-ranging oceanic or offshore. The connectivity between these types is poorly understood. As a result, within the assessment units identified for coastal bottlenose dolphins, the smaller resident populations have often been included. For example, the East Coast Scotland population encompasses a much smaller group that almost exclusively inhabits the Inner Moray Firth, in contrast, the West Coast Scotland assessment unit contains a very small Sound of Barra residential group and a wider-ranging Inner Hebrides group. Such overlaps between the resident, coastal and offshore populations make it difficult to identify which group is being surveyed at any one time.
Human activities can affect coastal bottlenose dolphins. However, the cause-effect relationships between bottlenose dolphins and human activities remain to be studied in more detail.
References
Ansmann IC, Parra GJ, Lanyon JM, Seddon JM (2012) ‘Fine-scale genetic population structure in a mobile marine mammal: inshore bottlenose dolphins in Moreton Bay, Australia’ Molecular Ecology, 21:4472–4485 (viewed on 5 December 2018)
Bailey H, Senior B, Simmons D, Rusin J, Picken G, Thompson PM (2010) ‘Assessing underwater noise levels during pile-driving at an offshore wind farm and its potential effects on marine mammals’ Marine Pollution Bulletin 60:888–897 (viewed on 5 December 2018)
Bilgmann K, Möller LM, Harcourt RG, Gibbs SE, Beheregaray LB (2007) ‘Genetic differentiation in bottlenose dolphins from South Australia: association with local oceanography and coastal geography’ Marine Ecology Progress Series 341:265–276 (viewed on 5 December 2018)
Brereton T, Jones D, Leeves K, Lewis K, Davies R, Russell T (2018) ‘Population structure, mobility and conservation of Common Bottlenose Dolphin off southwest England from photo-identification studies’ Journal of the Marine Biological Association of the United Kingdom 98: 1055-1063 (viewed on 12 December 2018)
Camphuysen CJ, Peet G (2006) ‘Walvissen en dolfijnen in de Noordzee’ Fontaine Uitgevers, Kortenhoef, The Netherlands. ISBN-10:90 5956 2216 (viewed on 12 December 2018)
Camphuysen CJ, Smeenk C (2016) Tuimelaar Tursiops truncatus. In: S Broekhuizen, JBM Thissen, KJ Canters, JC Buys (editors). Atlas van de Nederlandse zoogdieren. – Natuur van Nederland 12. Naturalis Biodiversity Center/European Invertebrate Survey, Leiden.
Cheney BJ, Thompson PM, Ingram SN, Hammond PS, Stevick PT, Durban JW, Culloch RM, Elwen SH, Mandleberg L, Janik VM, Quick NJ, Islas-Villanueva V, Robinson KP, Costa M, Eisfeld SM, Walters A, Philips C, Weir CR, Evans PGH, Anderwald P, Reid RJ, Reid JB, Wilson B (2013) ‘Integrating multiple data sources to assess the distribution and abundance of bottlenose dolphins (Tursiops truncatus) in Scottish waters’ Mammal Review, 43: 71-88 (viewed on 12 December 2018)
Cheney B, Corkrey R, Durban JW, Grellier K, Hammond PS, Islas-Villanueva V, Janik VM, Lusseau SM, Parsons KM, Quick NJ, Wilson B, Thompson PM (2014) ‘Long-term trends in the use of a protected area by small cetaceans in relation to changes in population status’ Global Ecology and Conservation, 2:118-128 (viewed on 12 December 2018)
Chilvers BL, Corkeron PJ (2001) ‘Trawling and bottlenose dolphins’ social structure’ Proceedings of the Royal Society of London, Series B 268:1901–1905 (viewed on 5 December 2018)
Evans PGH, Anderwald P, Baines ME (2003) ‘UK Cetacean Status Review. Report to English Nature and the Countryside Council for Wales’ Sea Watch Foundation, Oxford, 160 pages (viewed on 29 November 2018)
Evans PGH, Teilmann J (2009). ‘Report of ASCOBANS/HELCOM Small Cetacean Population Structure Workshop’ ASCOBANS/UNEP Secretariat, Bonn, Germany, 140 pages (viewed on 5 December 2018).
Feingold D, Evans PGH (2014) ‘Bottlenose Dolphin and Harbour Porpoise Monitoring in Cardigan Bay and Pen Llyn a’r Sarnau Special Areas of Conservation 2011-2013’ Natural Resources Wales Evidence Report Series Number 4, 124 pages (viewed on 5 December 2018)
HM Government (2012) ‘Marine Strategy Part One: UK Initial Assessment and Good Environmental Status’ (viewed on 5 July 2018)
HM Government (2015) ‘Marine Strategy Part Three: UK Programme of Measures’ (viewed on 5 July 2018)
Hoelzel AR (1998) ‘Genetic structure of cetacean populations in sympatry, parapatry, and mixed assemblages; implications for conservation policy’. Journal of Heredity 89: 451–458 (viewed on 5 December 2018)
ICES (2013) ‘Report of the Working Group on Marine Mammal Ecology (WGMME), 4-7 February 2013, Paris, France’ ICES CM 2013/ACOM:26, 117 pages (viewed on 6 December 2018)
ICES (2014) ‘OSPAR request on implementation of MSFD for marine mammals. Special request’ In: Report of the ICES Advisory Committee, 2014. In: Report of the Advisory Committee, ICES Advice 2014, Book 1, Section 1.6.6.1 (viewed on 5 December 2018)
ICES (2015a) ‘Bycatch of small cetaceans and other marine animals – Review of national reports under Council Regulation (EC) 812/2004 and other published documents’ In: Report of the ICES Advisory Committee, 2015. ICES Advice 2015, Book 1, Section 1.6.1.1 (viewed on 5 December 2018)
ICES (2015b) ‘Report of the Working Group on Bycatch of Protected Species (WGBYC), 2-6 February 2015, ICES Headquarters, Copenhagen, Denmark’ ICES CM 2015\ACOM:26, 82 pages (viewed on 5 December 2018).
ICES (2015c) ‘Report of the Working Group on Marine Mammal Ecology (WGMME), 9–12 February 2015, London, UK’ ICES CM 2015/ACOM: 25, 114 pages (viewed on 5 December 2018)
Jepson PD, Deaville R, Barnett J, Davison NI, Paterson IAP, Penrose RS, Perkins MP, Reid RJ, Law RJ (2013) Persistent organic pollutants in UK stranded cetaceans (1990-2008): linking exposure with toxic effects In: PGH Evans (editor) Chemical Pollution and Marine Mammals. European Cetacean Society Special Publication 55:16-24 (viewed on 6 December 2018)
Jepson PD, Deaville R, Barber JL, Aguilar A, Borrell A, Murphy S, Barry J, Brownlow A, Barnett J, Berrow S, Cunningham AA, Davison NJ, ten Doeschate M, Esteban R, Ferreira M, Foote AD, Genov T, Giménez J, Loveridge J, Llavona A, Martin V, Maxwell DL, Papachlimitzou A, Penrose R, Perkins MW, Smith B, de Stephanis R, Tregenza N, Verborgh P, Fernandez A, Law RJ (2016) ‘PCB pollution continues to impact populations of orcas and other dolphins in European waters’ Nature Scientific Reports 6: 18573 (viewed on 5 December 2018).
Krützen M, Sherwin WB, Berggren P, Gales N (2004) ‘Population structure in an inshore cetacean revealed by microsatellite and mtDNA analysis: bottlenose dolphins (Tursiops sp.) in Shark Bay, Western Australia’ Marine Mammal Science 20:28–47 (viewed on 5 December 2018)
Louis M, Fontaine MC, Spitz J, Schlund E, Dabin W, Deaville R, Caurant F, Cherel Y, Guinet C, Simon-Bouhet B (2014a) ‘Ecological opportunities and specializations shaped genetic divergence in a highly mobile marine top predator’ Proceedings of the Royal Society B, 281:20141558 (viewed on 5 December 2018)
Louis M, Viricel A, Lucas T, Peltier H, Alfonsi E, Berrow S, Brownlow A, Covelo P, Dabin W, Deaville R, de Stephanis, R, Gally F, Gauffier P, Penrose R, Silva MA, Guinet C and Simon-Bouhet B (2014b) ‘Habitat-driven population structure of bottlenose dolphins, Tursiops truncatus, in the North-East Atlantic’ Molecular Ecology, 23:857–874 (viewed on 5 December 2018)
Merchant ND, Pirotta E, Barton TR, Thompson PM (2014) ‘Monitoring ship noise to assess the impact of coastal developments on marine mammals’ Marine Pollution Bulletin, 78:85-95 (viewed on 5 December 2018)
Möller LM, Beheregaray LB (2004) ‘Genetic evidence for sex-biased dispersal in resident bottlenose dolphins (Tursiops aduncus)’ Molecular Ecology 13:1607–1612 (viewed on 5 December 2018)
Natoli A, Birkun A, Aguilar A, López A, Hoelzel AR (2005) ‘Habitat structure and the dispersal of male and female bottlenose dolphins (Tursiops truncatus)’ Proceedings of the Royal Society B, 272:1217–1226 (viewed on 5 December 2018)
Norman EB, Dussan-Duque S, Evans PGH (2015) ‘Bottlenose dolphins in Wales: Systematic mark-recapture surveys in Welsh waters’ Natural Resources Wales Evidence Report Series Number 85. Natural Resources Wales, Bangor, 83 pages.
OSPAR Commission (2017) ‘Intermediate Assessment 2017’ (viewed on 21 September 2018)
Pirotta E, Thompson PM, Cheney B, Donovan CR, Lusseau D (2014) ‘Estimating spatial, temporal and individual variability in dolphin cumulative exposure to boat traffic using spatially explicit capture-recapture methods’ Animal Conservation 18:20-31 (viewed on 5 December 2018)
Pirotta E, Merchant ND, Thompson PM, Barton TR, Lusseau D (2015) ‘Quantifying the effect of boat disturbance on bottlenose dolphin foraging activity’ Biological Conservation, 181:82-89 (viewed on 5 December 2018)
Quérouil S, Silva MA, Freitas L, Prieto R, Magalhães S, Dinis A, Alves F, Matos JA, Mendonça D, Hammond P, Santos RS (2007) ‘High gene flow in oceanic bottlenose dolphins (Tursiops truncatus) of the North Atlantic’ Conservation Genetics, 8:1405–1419 (viewed on 5 December 2018)
Richards VP, Greig TW, Fair PA, McCulloch SD, Politz P, Natoli A, Driscoll CA, Hoelzel AR, David V, Bossart GD, Lopez JV (2013) ‘Patterns of population structure for inshore bottlenose dolphins along the eastern United States’ Journal of Heredity, 104:765-778 (viewed on 5 December 2018)
Rosel PE, Hansen L, Hohn AA (2009) ‘Restricted dispersal in a continuously distributed marine species: common bottlenose dolphins Tursiops truncatus in coastal waters of the western North Atlantic’ Molecular Ecology, 18:5030–5045 (viewed on 5 December 2018)
Toth JL, Hohn AA, Able KW, Gorgone AM (2012) ‘Defining bottlenose dolphin (Tursiops truncatus) stocks based on environmental, physical, and behavioral characteristics’ Marine Mammal Science, 28:461-478 (viewed on 5 December 2018)
Weir CR, Stockin KA (2001) ‘The occurrence and distribution of bottlenose dolphins (Tursiops truncates) and other cetacean species in the coastal waters of Aberdeenshire, Scotland’ Sea Watch Foundation, Aberdeen. 68pp.
Williams AD, Williams R, Heimlich-Boran JR, Evans PGH, Tregenza NJC, Ridoux V, Liret C, Savage S (1997) ‘A preliminary report on an investigation into bottlenose dolphins (Tursiops truncatus) of the English Channel: a collaborative approach’ Proceedings of the tenth annual conference of the European Cetacean Society, Lisbon, Portugal 11-13 March 1996, European Research on Cetaceans, 10:217-220.
Wilson B, Reid RJ, Grellier K, Thompson PM, Hammond PS (2004) ‘Considering the temporal when managing the spatial: a population range expansion impacts protected areas-based management for bottlenose dolphins’ Animal Conservation, 7:331-338 (viewed on 12 December 2018)
Wiszniewski J, Allen SJ, Moeller LM (2009) ‘Social cohesion in a hierarchically structured embayment population of Indo-Pacific bottlenose dolphins’ Animal Behaviour, 77:1449–1457 (viewed on 12 December 2018)
Wiszniewski J, Beheregaray LB, Allen SJ, Möller LM (2010) ‘Environmental and social influences on the genetic structure of bottlenose dolphins (Tursiops aduncus) in Southeastern Australia’ Conservation Genetics, 11:1405–1419 (viewed on 5 December 2018)
Assessment metadata
| Assessment Type | UK MSFD Indicator Assessment |
|---|---|
D1/D4/D6 Biodiversity and Food Webs, Cetaceans | |
| Point of contact email | marinestrategy@defra.gov.uk |
| Title | Abundance and Distribution of Coastal Bottlenose Dolphins |
| Resource abstract | Common indicator assessment of abundance and distribution of cetaceans: coastal bottlenose dolphins. Applicable to the Greater North Sea, Celtic Seas and the Bay of Biscay and Iberian coast (OSPAR Regions II, III and IV). |
| Linkage | |
| Conditions applying to access and use | Terms and Conditions for data used in the assessment. The data reported for a number of coastal bottlenose dolphin populations can only be used for this assessment reported here. For other use agreement should be sought with the data owners: East Coast Scotland: Aberdeen University Lighthouse Field Station. Cardigan Bay, Wales: Sea Watch Foundation. Shannon Estuary, Ireland: Shannon Whale and Dolphin Federation and the University College Cork. St Malo, France: Groupe d’Etude des Cétacés du Cotentin, Cherbourg-Octeville. Ile de Sein, France: Parc naturel marin d’Iroise, Brétagne. Sado Estuary, Portugal: Projecto Delfim – Portuguese Center for the Study of Marine Mammals, Lisbon; and others (Unidade de Investigação em Eco-Etologia, Instituto Superior de Psicologia Aplicada). |
| Assessment Lineage | |
| Indicator assessment results | |
| Dataset metadata | |
| Links to datasets identifiers | |
| Dataset DOI | Please, see reference above |
The Metadata are “data about the content, quality, condition, and other characteristics of data” (FGDC Content Standard for Digital Geospatial Metadata Workbook, Ver 2.0, May 1, 2000).
Metadata definitions
Assessment Lineage - description of data sets and method used to obtain the results of the assessment
Dataset – The datasets included in the assessment should be accessible, and reflect the exact copies or versions of the data used in the assessment. This means that if extracts from existing data were modified, filtered, or otherwise altered, then the modified data should be separately accessible, and described by metadata (acknowledging the originators of the raw data).
Dataset metadata – information on the data sources and characteristics of data sets used in the assessment (MEDIN and INSPIRE compliance).
Digital Object Identifier (DOI) – a persistent identifier to provide a link to a dataset (or other resource) on digital networks. Please note that persistent identifiers can be created/minted, even if a dataset is not directly available online.
Indicator assessment metadata – data and information about the content, quality, condition, and other characteristics of an indicator assessment.
MEDIN discovery metadata - a list of standardized information that accompanies a marine dataset and allows other people to find out what the dataset contains, where it was collected and how they can get hold of it.
Recommended reference for this indicator assessment
Eunice Pinn1, Ian Mitchell1 and Jane Hawkridge1 2018. Abundance and distribution of coastal bottlenose dolphins*. UK Marine Online Assessment Tool, available at: /biodiversity-food-webs-and-marine-protected-areas/cetaceans/abundance-and-distribution-of-coastal-bottlenose-dolphins/
* Adapted from OSPAR Intermediate Assessment 2017 on Abundance and Distribution of Coastal Bottlenose Dolphins
1Joint Nature Conservation Committee